

I'm Sorry, they Haven't a Clue
Analysis of another HMGov database reveals a deep lack of understanding of a fundamental issue with electrical energy storage

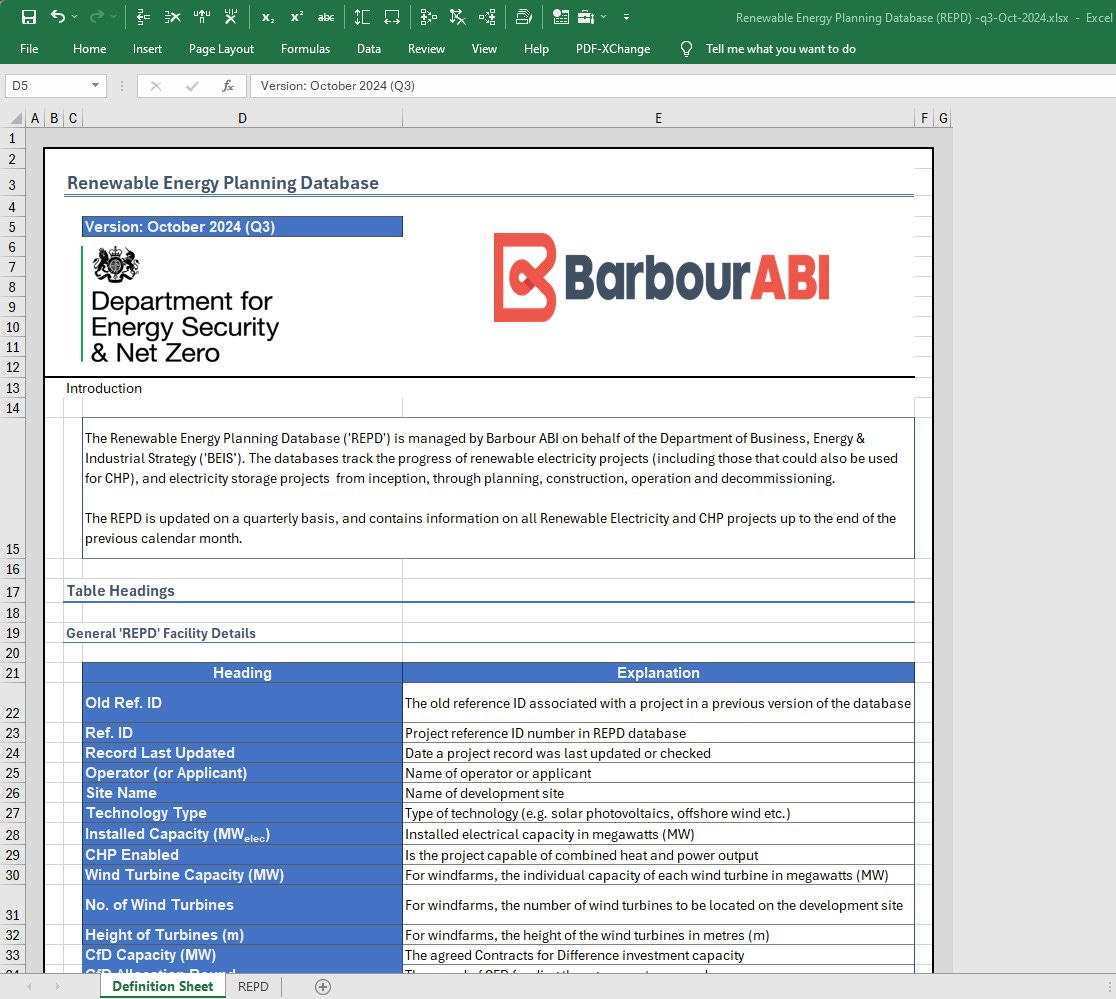
This post follows on from yesterday’s “No Wonder We're Skint” post, after I was made aware of HMGov’s Renewable Energy Planning Database (REPD) last updated 18 November 2024.
Before I continue, you may notice a recurrent theme in a number of my Substack posts:
a) data from GB shows that HMGov really does NOT understand what it’s committed itself to with its accelerated rush to ‘decarbonise’ the UK power system by 2030, and UK primary energy within ~2 decades thereafter.
b) data more generally shows that as jurisdictions install greater *capacities* of Wind and Solar generation, they have to curtail increasing quantities of power generated when weather conditions are good for ‘renewables’ in order to maintain control of grid frequency. [Because in an electrical grid, Supply must equal Demand every second of every minute of every day.]
c) data also generally shows that dispatchable sources of generation (hydro, coal, gas, nuclear) that are largely not weather-dependent have to be kept available and operational as ‘backup’ at night when the Wind is not blowing, otherwise the lights go out. Interconnections with neighbouring regions can postpone this effect, but as everyone in a wide area transitions to higher proportions of weather-dependent ‘renewable’ generation the margin before blackouts will be eroded.
d) data also shows that electrical energy storage does not yet exist at sufficient scale, nor sufficiently cheaply, to change b) or c) by significant amounts.
Today’s data from the official HMGov REPD database shows that neither HMGov’s Department for Net Zero, nor its consultant BarbourABI, understand a fundamental technical aspect of Energy Storage:
How long will it keep the lights on?
The ¦REPD¦ tab of the database has over ten thousand rows/records, and unlike in yesterday’s [poor] effort, at least uses numerical format for numbers. So one point for effort there for BarbourABI.
I filtered the database for “Operational” status, and for the following Technology Types:
“Hot Dry Rocks” [mainly to satisfy my own curiosity];
“Pumped Storage Hydroelectricity”;
“Liquid Air Energy Storage”;
“Battery”;
“Flywheels”;
“Compressed Air Energy Storage”; and
“Geothermal” [again mainly to satisfy my own curiosity]
This reduced the list to the following 126 records (in four page views):


The filtered data shows:
- there is a single operational “Hot Dry Rocks” scheme rated at 3 MW [probably continuous] at the top of screen #1. Worth noting by any ‘geothermal’ aficionado.
- also at the top of screen #1 the UK’s four Pumped Hydro Storage schemes are listed, rated a total of 2,828 MW. BUT there is no data telling us how many hours each might continue at that power / alternatively, how many MWh each stores at full capacity. [poorest of poor in an official database]
It gets worse.
- midway down screen #1 we see “Flywheels” rated at 400 MW. [Unless these have infinite mass and/or rotate at infinite speed, physics tells us they will run down as energy is taken from them. How quickly? Goodness only knows, this HMGov database doesn’t tell us… POOR!]
- screens #2 and #3 have only batteries [I’ll get back to them in a moment]
- screen #4 shows one operating “Compressed Air Energy Storage” scheme, but gives no indication of either a power rating nor a duration [Poor cubed]
Also no indication of a power rating for the one operating “Geothermal” scheme, but it again is likely to be continuous not energy storage [still poor]
There is no “Liquid Air Energy Storage” listed.
Batteries
You have to do a bit of logical manipulation on the data in the filtered database to determine the total installed power rating of all the operating batteries in the UK.1
The relevant formula is shown for cell BB10844 (the bottom right corner of the displayed area): if cell F10844 is “Battery” then cell BB10844 value equals cell I10844 value. And so on for all of column BB in the filtered worksheet.

Then the total power rating of all the batteries is given by summing column BB,
i.e. is 2,498.1 MW…
for an unknown duration, maybe 1 hour, who knows? [Not DNZ, that’s for sure.]
So, when DNZ2 tells you that everything is fine and their Net Zero plans are on track and absolutely achievable, ask yourself this:
Does the data show DNZ understand Energy?
I think the data shows the answer is a resounding NO!
Concerning, no?
Copyright © 2024 Chris S Bond
Disclaimer: Opinions expressed are solely my own.
This material is not peer-reviewed.
I am against #GroupThink.
Your feedback via polite factual comments / reasoned arguments welcome.
If you simply sum column I you get a huge number because all the power ratings of other non-battery schemes are included in that total. This is a weakness of using Filters in Excel.
I refuse to call them DESNZ because all the evidence indicates the “Energy Security” part of their Dept. name is no longer valid. They are simply and solely the “Department of Net Zero”. #GroupThink writ large.
Other outfits that don't have a clue are:
House of COMMONS Library researchers, and (remarkably), the British Hydropower Association (BHA).
Earlier this year (19/4/2024), the former published their Research Briefing on Battery Energy Storage Systems
https://researchbriefings.files.parliament.uk/documents/CBP-7621/CBP-7621.pdf
Page 10:
"Other types of energy storage systems
Some examples of long-duration energy storage include:
• Pumped hydroelectric storage: Electricity is generated when water is released from a reservoir and travels downhill through a turbine. The water is pumped uphill during lower energy demand. According to the British Hydropower Association, the UK’s pumped hydropower capacity
was 2.8 GW or 32 GWh (see box 2 for an explanation of the difference)."
Ummm. 32GWh of pumped hydro??? That didn't pass the sniff test.
The late Prof Sir David Mackay's pumped hydro table in 'Without the hot air' informs we've 26.7GWh.
Since the HoC referred to BHA, I looked at its site
https://british-hydro.org/pumped-storage-hydropower/
Scroll down to, and expand 'Key statistics'.
We are informed by "... the leading trade membership association solely representing the interests of the UK hydropower industry." that:
"There are four operational PSH plants in the UK:
Dinorwig (1983) 1.7 GW, 10.4 GWh
Foyers (1974) 300 MW, 6.4 GWh
Ffestiniog (1963) 360 MW, 7.6 GWh
Cruachan (1966) 440 MW, 7.6 GWh"
It claims Ffestiniog stores 7.6 GWh whereas the ex-Chief Scientific Advisor to the UK Department of Energy and Climate Change stated Ffestiniog has an energy storage capacity of 1.3GWh.
The only way to settle that was to contact Ffestiniog's owners.
https://i.postimg.cc/FKmHPmPX/temp-Image-Ta-TNl-P.avif
A change/error of 0.1GWh in a 16-year old pamphlet is tolerable; a 6.2GWh / 590% exaggeration in 'THE' trade association's webpage really isn't.
Worse, when a member of the HoC research team was personally informed of its error, all that resulted was an auto-reply that the email had been received. They clearly did sweet FA, their error is still visible to the world today.
Chris, historically the pump storage uses night time “cheap” electricity to pump the water from the lower to the upper reservoir. The operators tend to be wait for peak electricity demands to release the energy over a 30-60 minute window. This maximises revenue and is not designed to support a government’s macro “green” ethos.