An Energy Security Strategy?
The British energy 'security strategy' throws options at the walls; many don't stick.
UK energy policy updated
Summary
The British Energy Security Strategy “to secure greater energy independence for the UK” has been published by HM Gov. I remain entirely unimpressed.
HM Gov has not clearly defined the problem (of UK power decarbonisation). It has some working technologies which it is hosing up the walls in the hope they work, regardless of their cost or effectiveness. This is a classic example of the politician’s syllogism: We must do something! This is something. Therefore, we must do this.
My previous posts identified the need for immense energy storage of 13,000,000 MWh without which even 2½ times our current wind generation will fail to keep the lights on 60/24/365. As we add nuclear generation capacity I concluded that more and more renewable generation would have to be constrained = wasted because of the high rates of change of wind and solar, but I had not quantified these.
My analysis in this post quantifies the variability of current gas generation. Whatever replaces gas has to be able to ramp by at least +/- 12,000 MW in 2 hours, and by
+/- 120 MW/minute. Current nuclear technology cannot do this. Neither can electrolysers cope with these power flows or levels of intermittency, so there can be no ‘green hydrogen’ to feed instead to the gas turbines.
Energy storage remains the most difficult part of the decarbonisation puzzle, and if indeed we need to decarbonise, it is a major policy error to avoid addressing it.
The British Energy Security Strategy
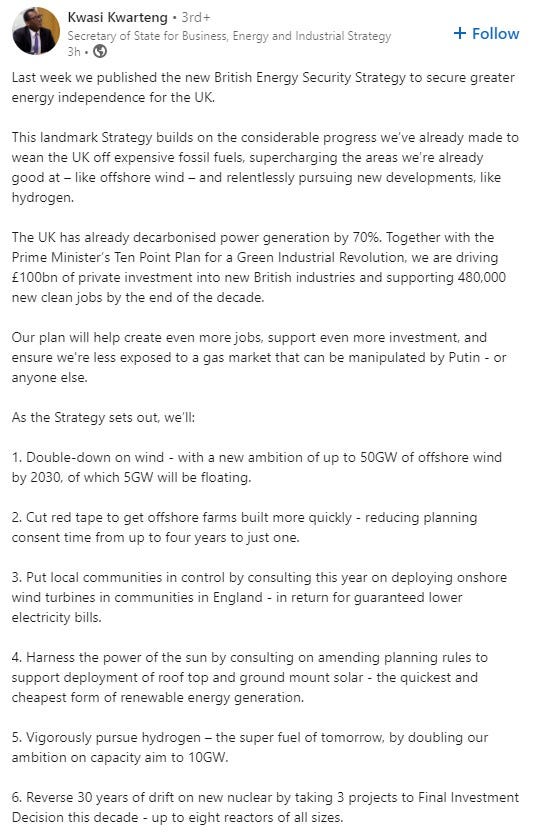
As published via LinkedIn on 19 April 2022:
Re: 1., 2., 3. and 4. More off- and onshore wind plus more solar PV just throw more and more taxpayer and energy-bill-payer money at the problem in the hope that the lights will stay on. They won’t, as I explained in my second post.
Re: 5. The Hydrogen Science Coalition summed up the technical arguments why to ‘Vigorously pursue hydrogen’ is decarbonisation policy self-harm.
Or, if like me you prefer a bit of humour, Andrew Orlowski summed up the ‘vigorous pursuit of hydrogen’ nicely [paywalled]. “Engineers will rarely tell you something is impossible, even when your proposal is a very bad idea… They called it “kicking a dead whale down a beach”… The Hacker’s Dictionary defines this as a “slow, difficult, and disgusting process”. Yes, you can do it like that. But you really don’t want to.” And “Special interest groups, however, have discovered that the magic words “net zero”… open up an unlimited trove of research grants and subsidies, and tap into abundant buckets of ill-directed “green” capital.”
Re: 6. You don’t reverse ‘drift’ by making vague aspirational statements. You do so by publishing a costed plan with milestones and defined responsibilities for hitting the latter while remaining within the budget. You commit to a defined number of reactors (hopefully the same design as Hinkley Point C - HPC - to gain the benefit of regulatory approval and engineering investment. I identified in my third post that 6 or 8 more HPCs appears to be about right.) Whether small modular reactors (SMRs) can be added to that fleet is currently an unknown as they do not yet have regulatory approval.
Re: 7. Good to have more North Sea oil and gas instead of imports for what we need, but we should include onshore fracking for gas - as I also explained in my third post.
Re: 8. Zero percent VAT on solar installations, heat pumps and energy efficiency measures only benefits relatively wealthy people who can already afford those goods. Welfare for the middle-classes while the least well-off are shivering in their homes? A tone-deaf policy.
Re: 9. I guess it’s necessary to support what remains of UK industry. Hopefully the new mine for coking coal in Cumbria can also be resurrected so that what little remains of the UK steel industry won’t have to import Russian coking coal.
Introduction
In this post I explore how fast and how far the United Kingdom’s combined cycle gas turbine (CCGT) generation varies. This is because currently CCGT is the main variable technology ensuring that the grid remains balanced, supply = demand, 60/24/365. In a fully decarbonised future the CCGT generation would be gone and so needs to be replaced by something. But what? Lithium ion battery energy storage? Pumped hydro? Gas turbines fuelled with green hydrogen produced by electrolysers powered by renewable electricity? Fast-adjusting nuclear power? Or quite possibly new technology not yet developed.
HM Gov’s ambition is apparently to build a nuclear fleet equal to about 25% of future UK demand, as well as to “double-down on wind”. I fear that a significant proportion of the renewable assets will be ‘stranded’ once there is a higher proportion of nuclear baseload. In other words, the ‘investment’ in more and more renewable generation will end up being wasted.
I continue to use real UK power data but this time show more detail. I selected one week’s worth of data from each month from March 2021 to March 2022. I began downloading the sets of data at 13:20 on 18 March 2022, so for no other reason than that, each set of data spans 7 days from 13:30 on the 11th to 13:20 on the 18th of each month. Because I have taken so long to write this post I have added the equivalent week from April 2022. I also continue to use the same units, mega-watts (MW) for power flows and mega-watt hours (MWh) for amounts of energy to keep it human-scale. Note that 1,000 MW = one giga-watt (GW).
The HM Gov target is to decarbonise UK power generation, presumably while keeping the lights on. Thus far HM Gov has not adequately quantified the problem: instead it has proposed spending quite vast sums of money on a range of measures without providing any evidence they will be effective.
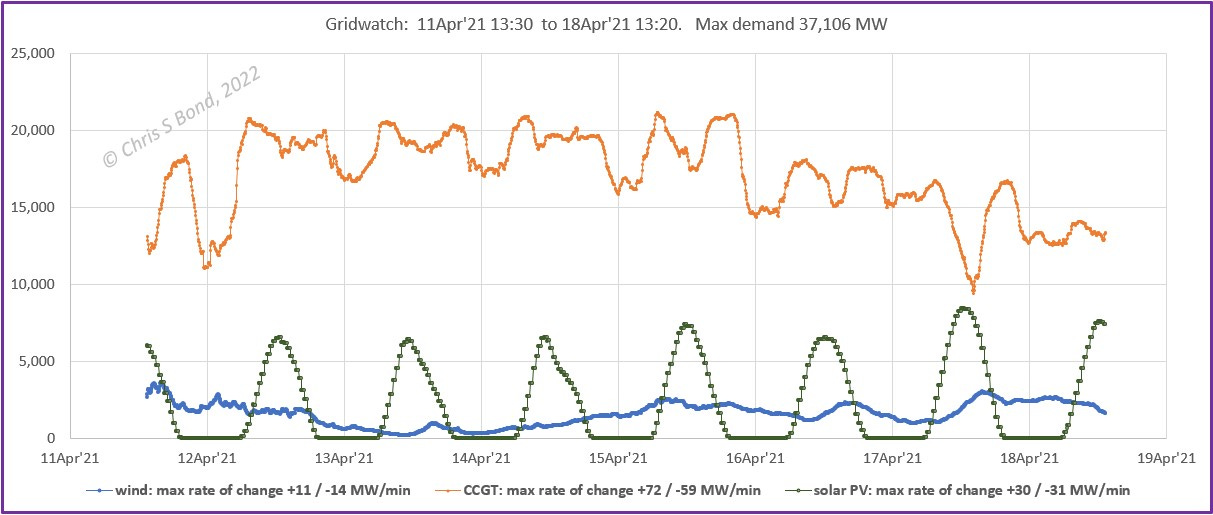
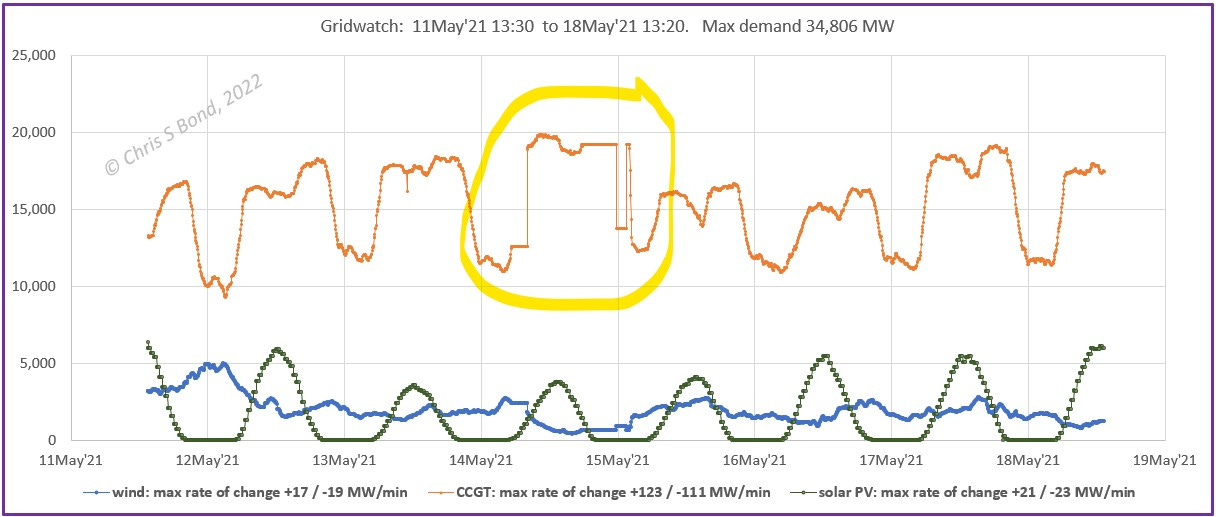
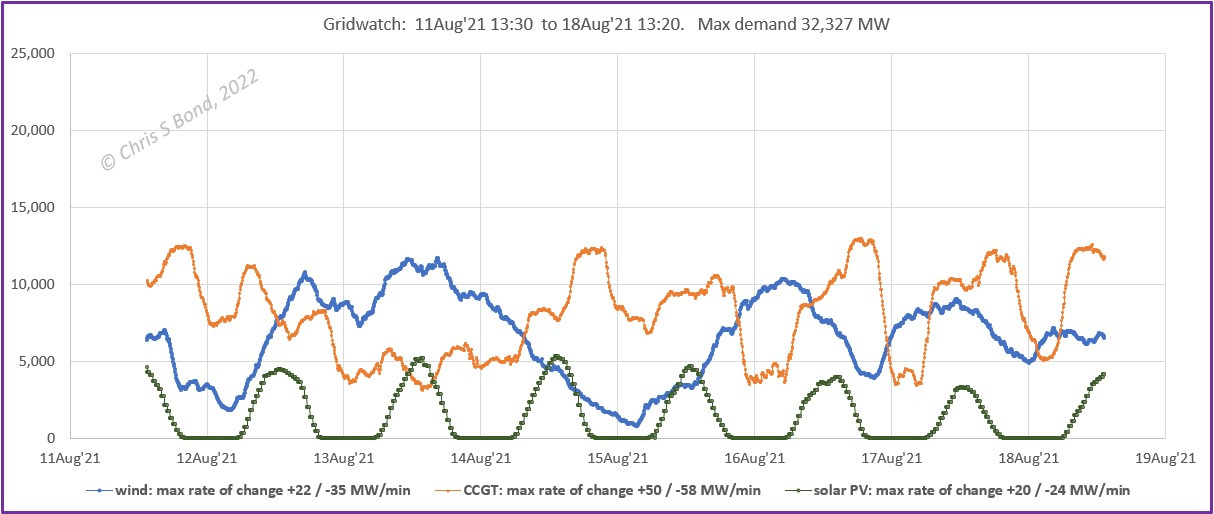
I have plotted below actual Gridwatch power flow data, recorded every 5 minutes i.e. 60/5 = 1/12th of an hour. There are 2,015 sets of real data in each of the 13 weeks. They illustrate the variety of size and rate of change of generation that the UK Grid has to keep balanced. They also illustrate some data inconsistencies present in the Gridwatch database.
1 Week / Month Charts
March 2021
April 2021
May 2021
The highlighted CCGT data has large discontinuities (horizontal and vertical sections of the chart) indicating bad / unreliable / dodgy data.
June 2021
July 2021
August 2021
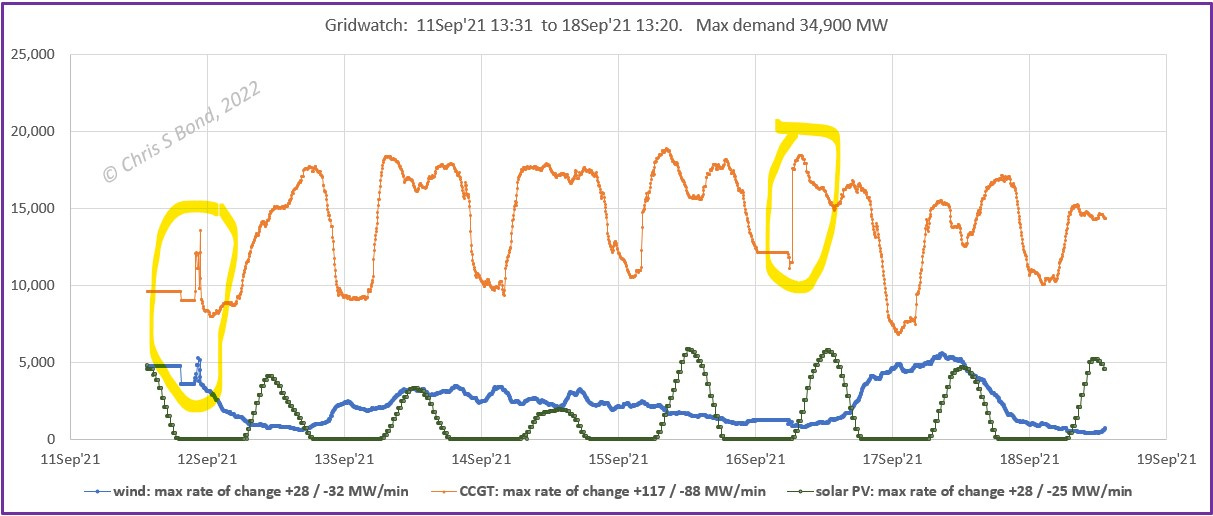
September 2021
Obvious dodgy CCGT and wind data highlighted
October 2021
The steep climb in the CCGT data early on 15Oct’21 gives the highest rate of increase, 119 MW/minute. Manual checking of the data revealed no discontinuities. The total change in CCGT generation is from ~5,000 to ~17,000 MW i.e. about 12,000 MW in 110 minutes. That is equivalent to bringing the gross output of eight Hinkley Point C reactors (1,600 MW each) fully online in under 2 hours.
November 2021
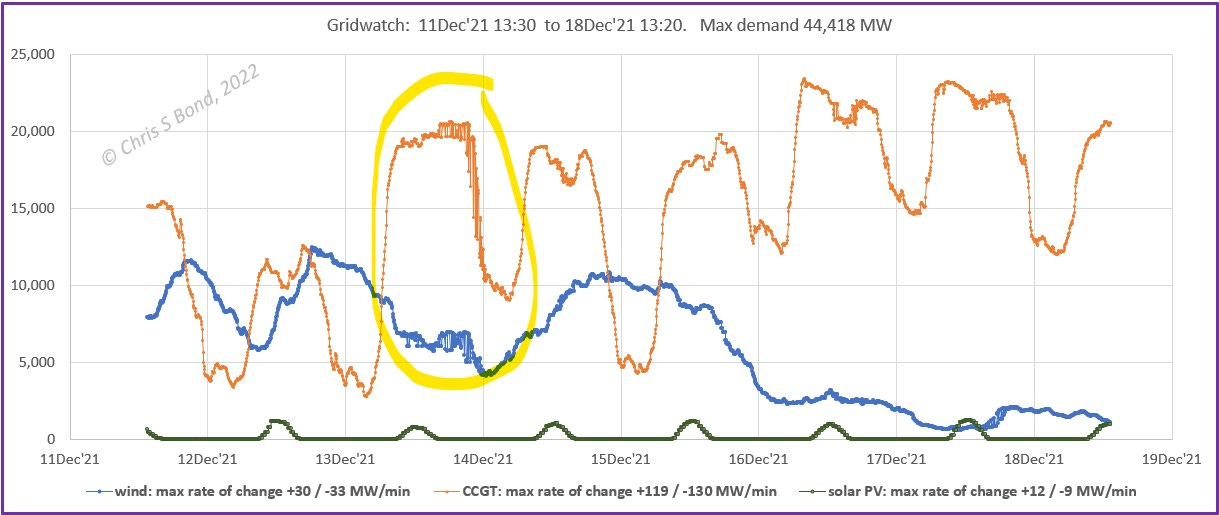
December 2021
Obvious dodgy CCGT and wind data highlighted. Note also how minimal solar PV is in December.
January 2022
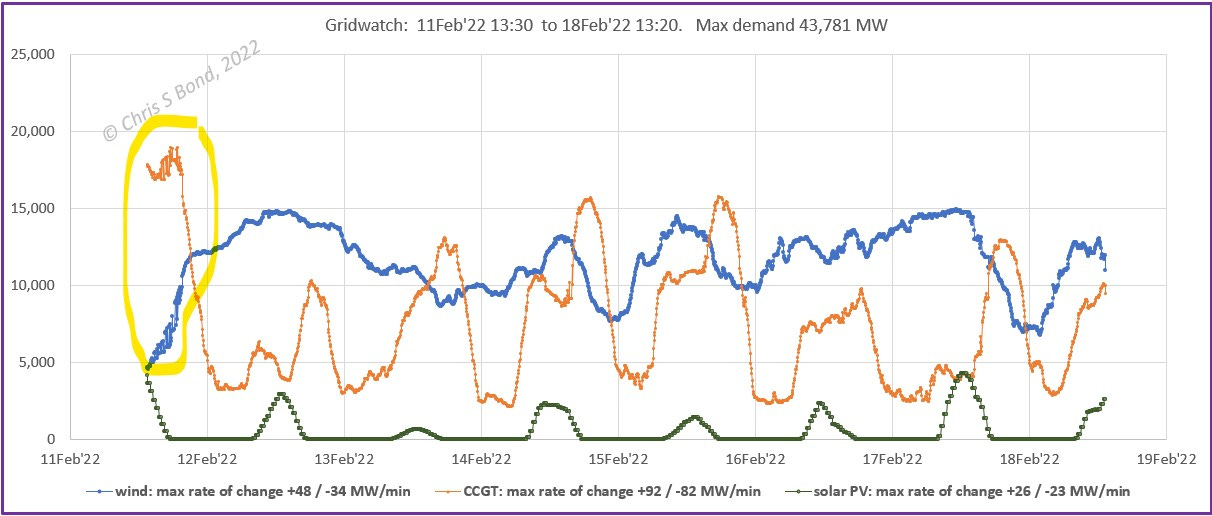
February 2022
Obvious dodgy CCGT and wind data highlighted.
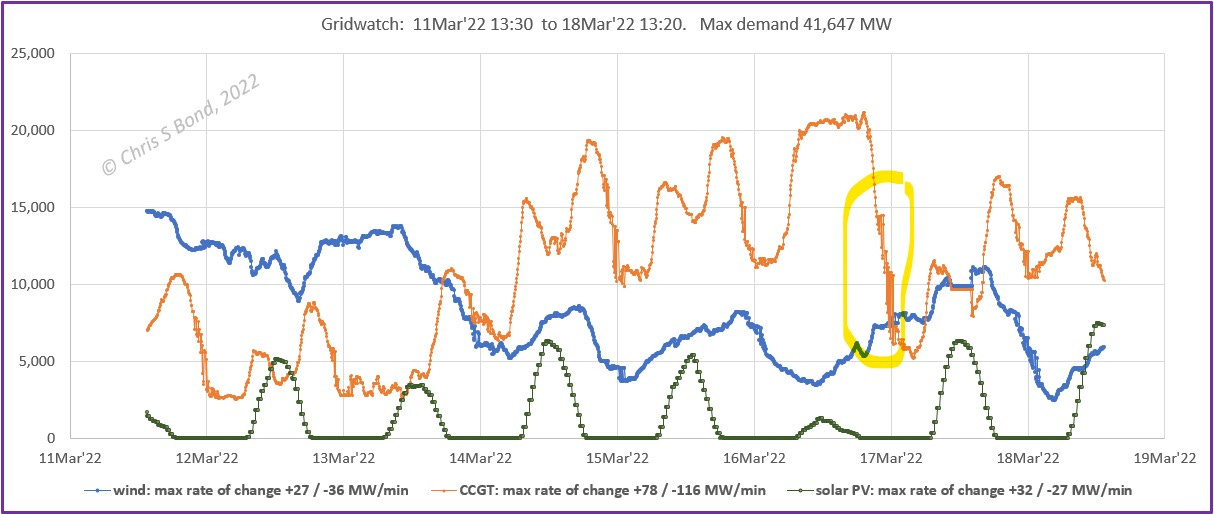
March 2022
Obvious dodgy CCGT data highlighted.
April 2022
Obvious dodgy CCGT data highlighted.
Summary from the above 14 weeks
The Effects of Dodgy Data
The ‘dodgy data’ i.e. data anomalies / inconsistencies prevent me performing simple arithmetic analyses of say a year or two’s worth of data. The rate of change of a parameter is the magnitude of the change divided by the interval of time. Large vertical lines on the charts result arithmetically in very large changes over the fixed intervals of time, i.e. they give misleadingly-high apparent rates of change. Manually filtering using smaller data-sets allowed me to screen out some dodgy data and identify spurious results.
Therefore, this is a limited sample. I cannot be certain that the rates of change and magnitude of change in CCGT generation I state here are the highest the UK has experienced over the last year or two. But I believe they are reasonably indicative.
So What?
The October 2021 week featured the highest rate of change in CCGT generation of nearly 120 MW/minute. Meanwhile, the total CCGT output rose from ~5,000 MW to ~17,000 MW, that is about 12,000 MW in a little under 2 hours. That is equivalent to bringing the gross output of eight Hinkley Point C reactors (1,600 MW each) fully online in under 2 hours.
Nuclear engineers have assured me that, although nuclear reactors can change power output rapidly, there would be strongly negative consequences if they kept doing so day after day. In other words you would not want to try to control the future reactor fleet to follow the fluctuations in renewables output. Even if SMRs (small modular reactors) are individually more flexible, the sheer magnitude of the variations will likely prevent nuclear from replacing CCGT as the highly-adaptable power source.
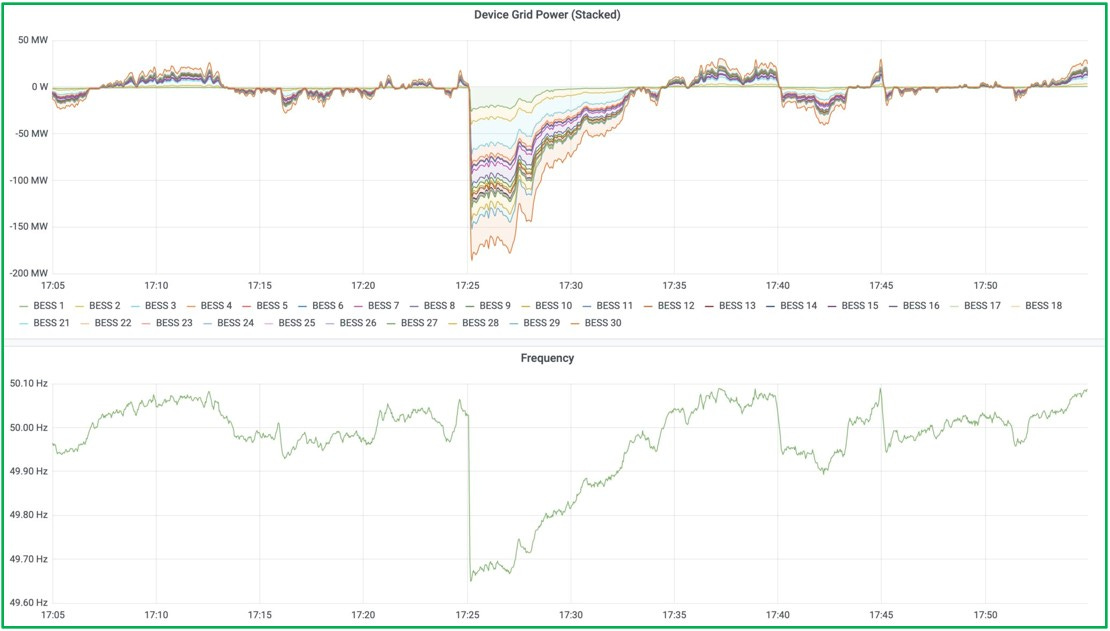
Current lithium ion battery energy storage systems (BESS) certainly can react quickly enough. This was demonstrated on 18 April 2022 when the Sizewell B nuclear reactor system went completely offline unexpectedly at about 17:25 in the afternoon. The grid frequency dropped below its critical level and a fleet of 30 KrakenFlex BESSs were instantaneously called into action, stabilising frequency and saving the day with a cumulative ~190 MW of injected power:
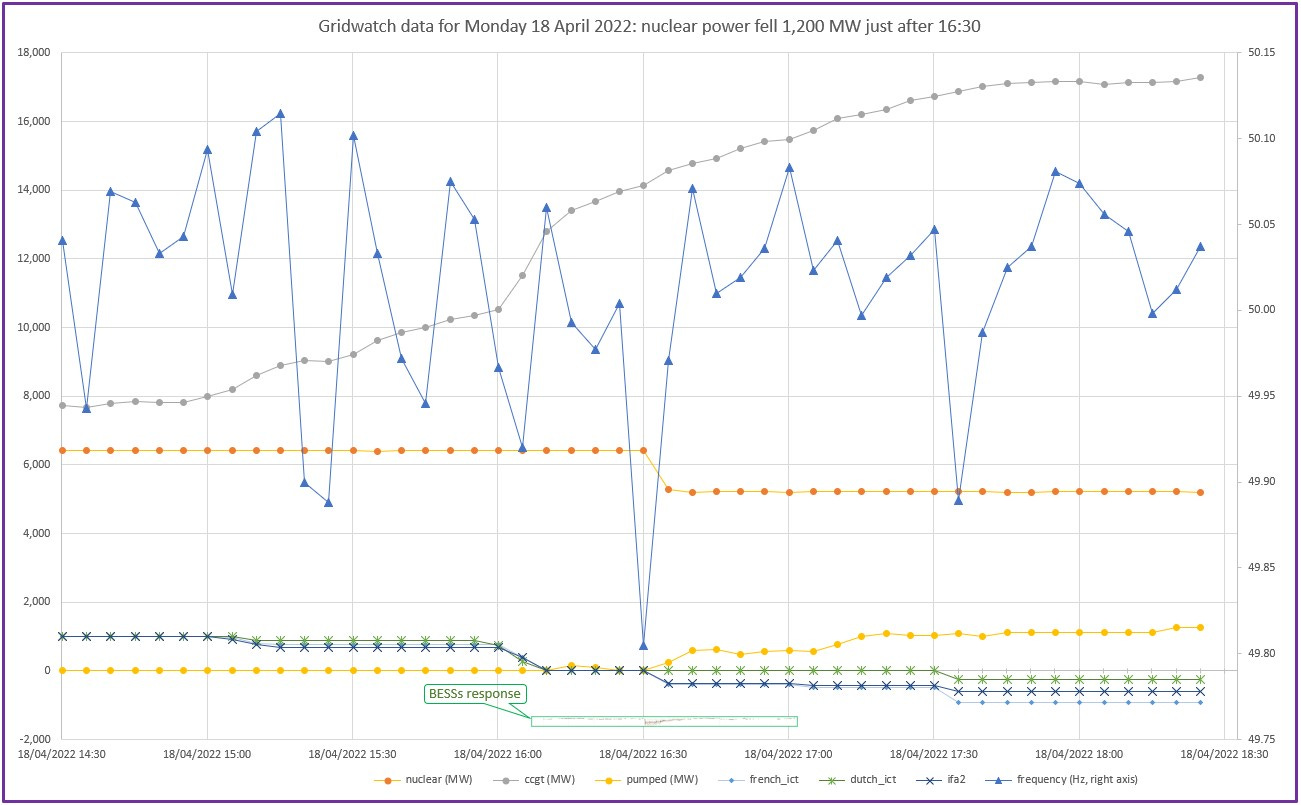
Looking at the wider UK context of the same UK event via selected Gridwatch data:
CCGT was already ramping up from about 10,500 MW to 14,000 MW in the half hour before the nuclear trip, and continued up to over 17,000 MW on the chart.
Power interconnections with France (IFA, IFA2) were already ramping down to switch from power import (1,000 MW and 990 MW respectively) ultimately to power export (928 MW and 614 MW respectively) and that went ahead, presumably for contractual reasons.
Similarly, the BritNed interconnection transitioned from 1,000 MW power import to 250 MW power export over the same time interval.
Dinorwyg (pumped energy storage, see my second post) took about 10 minutes to reach ~600 MW and carried on up to ~1200 MW after about an hour. (They claim they can reach full power in about 20 seconds… maybe there was a game on in Cardiff?)
In the above plot of selected GridWatch data, frequency is the ultra-spiky plot with its scale on the right axis. Its resolution is too low to capture the minimum frequency recorded in the KrakenFlex data at just after 17:25. The times also have a 1-hour offset (I assume BST versus GMT).
Conclusion: it is very good that the grid-connected batteries (BESS 1 through 30) were able to jump in and instantaneously stop the frequency from falling further and hence stabilised the grid and possibly saved parts of the country from a power cut. But the 30 BESSs did this with a combined power flow of less than 200 MW: barely 20% of one typical interconnector power, and 1-2% of the CCGT power flows.
I made a copy of the KrakenFlex power chart and re-sized it to be consistent with the timings and scale of the Gridwatch chart. I placed it between the 0 MW axis and the -2000 MW power line with the call-out “BESSs response”. Can you see it?
Sorry, but we are back in the room with that immense energy storage elephant which HM Gov is studiously avoiding mentioning. (To be fair, so are most governments.) Meanwhile, all the lobbyists for more wind-farms, more solar PV and the “hydrogen economy” are busting open the bottles of bubbly effectively at public expense.
If you are a UK tax-payer or bill-payer, are you crying yet?
At least we live in a democracy of sorts, so we have the opportunity on 5th May to cast our votes (albeit only in local elections) to register a verdict on how well or otherwise HM Gov is doing. Admittedly Partygate / ‘what is a woman?’ are possibly the issues uppermost in your minds. But if you can, please spare a thought for the ineptitude demonstrated in the “British Energy Security Strategy” and its direct effects on the cost of living crisis while failing in is primary aim of providing energy security, and maybe that will tip you one way or the other.











Comment #2 - Ramp Rates
"The October 2021 week featured the highest rate of change in CCGT generation of nearly 120 MW/minute. Meanwhile, the total CCGT output rose from ~5,000 MW to ~17,000 MW, that is about 12,000 MW in a little under 2 hours."
October - so the weather would probably have been coolish but not excessively cold for that morning's ramp-up.
But that is to meet only *existing* electricity demand!
To achieve that 'NetZero', some expect to switch many millions of gas boilers *serving un- time-shiftable* space-heating demand over to heat pumps.
An indication of the magnitude of short term natural gas vs electricity demands and ramp rates is given by UKERC in "Challenges for the decarbonisation of heat: local gas demand vs electricity supply Winter 2017/2018"
Table 1 shows Peak Hour & Peak Day, and, 1-hour & 3-hour Ramp Rate ratios
Gas vs electrical ramp rate ratios were 7.6 and 7.3 respectively!
Their Figure 3 shows gas vs electricity 3-hour difference in demand over a year
https://d2e1qxpsswcpgz.cloudfront.net/uploads/2020/03/ukerc_bn_decarbonisation_heat_local_gas_demand_vs_electical_supply_web.pdf
Feeding heat pumps will triple / quadruple / quintuple existing peak Hour & Peak Day, and, 1-hour & 3-hour Ramp Rates.
(Assuming also, that those millions of EVs will be ramp-rate neutral)
Hi Chris
Another great detailed post that takes two reads. One to skim, and one to read slowly to assimilate the details.
The first is done, hence this response before I forget:
"My analysis in this post quantifies the variability of current gas generation. Whatever replaces gas has to be able to ramp by at least +/- 12,000 MW in 2 hours, and by
+/- 120 MW/minute. Current nuclear technology cannot do this. Neither can electrolysers cope with these power flows or levels of intermittency, so there can be no ‘green hydrogen’ to feed instead to the gas turbines."
That latter point might be a blessing in disguise ;-)
Apparently, a literature search "Injecting hydrogen into the gas network –
Prepared by the Health and Safety Laboratory for the Health and Safety Executive 2015" exposes 'concerns':
<blockquote>"3.7.1.9 Gas turbines
A combustion system particularly sensitive to variations in gas composition is the lean premixed gas turbine. Gas is mixed with high pressure and temperature air and the resultant expanding flames impinge on the turbine blades. Unwanted spontaneous ignition before reaching the burner and flashback of the flame into the burner can both have potentially disastrous effects on the integrity of the machine. At the other extreme, flame blowout is equally unwanted, and even partial flame lift can result in undesirable acoustic instability. A particular concern regarding ignition is the presence of hydrogen; since this gas ignites easily, there is concern that even small quantities of hydrogen in natural gas would be catastrophic for turbine behaviour. To illustrate this apprehension one major turbine manufacturer allows only traces of hydrogen in the fuel gas, while another manufacturer allows only 8.5% of hydrogen (64)."</blockquote>
Page 32, here:
https://www.hse.gov.uk/research/rrpdf/rr1047.pdf