

Follow-Up to But... What if I'm Wrong?
Responding to David Osmond and Peter Farley in a new post because I need to provide step-by-step demonstrations of the arithmetic for those who cannot/will not see

After publication of my “But… What if I’m Wrong?” post I put a comment beneath David Osmond’s [week ending 04 Jun 2025] X post with a link. I heard back from him on X:
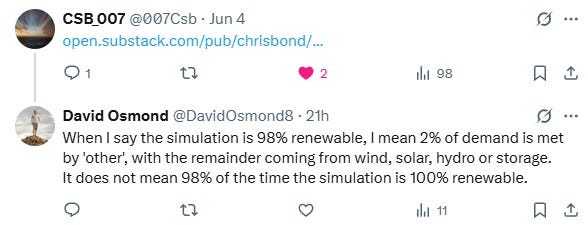
“When I say the simulation is 98% renewable, I mean 2% of demand is met by 'other', with the remainder coming from wind, solar, hydro or storage. It does not mean 98% of the time the simulation is 100% renewable.
7:31 PM · Jun 8, 2025”
David: you’re still comparing your results against your 3-year averages, aren’t you?
Think: what does AEMO do?
“The wholesale electricity markets and Victoria’s DWGM allow market participants to buy and sell energy, with supply and demand being matched in real-time through a coordinated dispatch process, …”
MATCHED IN REAL TIME...
Hence my analysis looks at the energy balance every ½ hour.
What probably matters1 to your fellow citizens, David, is whether the lights stay on ½ hour by ½ hour. And under your future scenario my post demonstrated that they won’t 35.8% of the time.
(Of course I realise that a competent grid operator would cope with a short, small Shortfall. However, long deep Shortfalls for example on May 15th-16th, preceded and followed by other long deep Shortfalls, would either black out half of Aus, or would require a *lot more* than you’re admitting of dispatchable fossil power generation.)
So here, for the hard of understanding, I present an extract from the NEM ½-hourly data 12 May 2025 22:00 to 19 May 2025 22:00 (I’m sure David would be able to verify the numbers and timings below are accurate).
Specifically, the NEM ½-hourly data for the interval 15/05/2025 16:00 thru 16/05/2025 08:00 when my previous post’s Figure 2B showed a long-lasting deep period of Shortfall.
Figure 1: NEM ½-hourly data 15/05/2025 16:00 thru 16/05/2025 08:00:
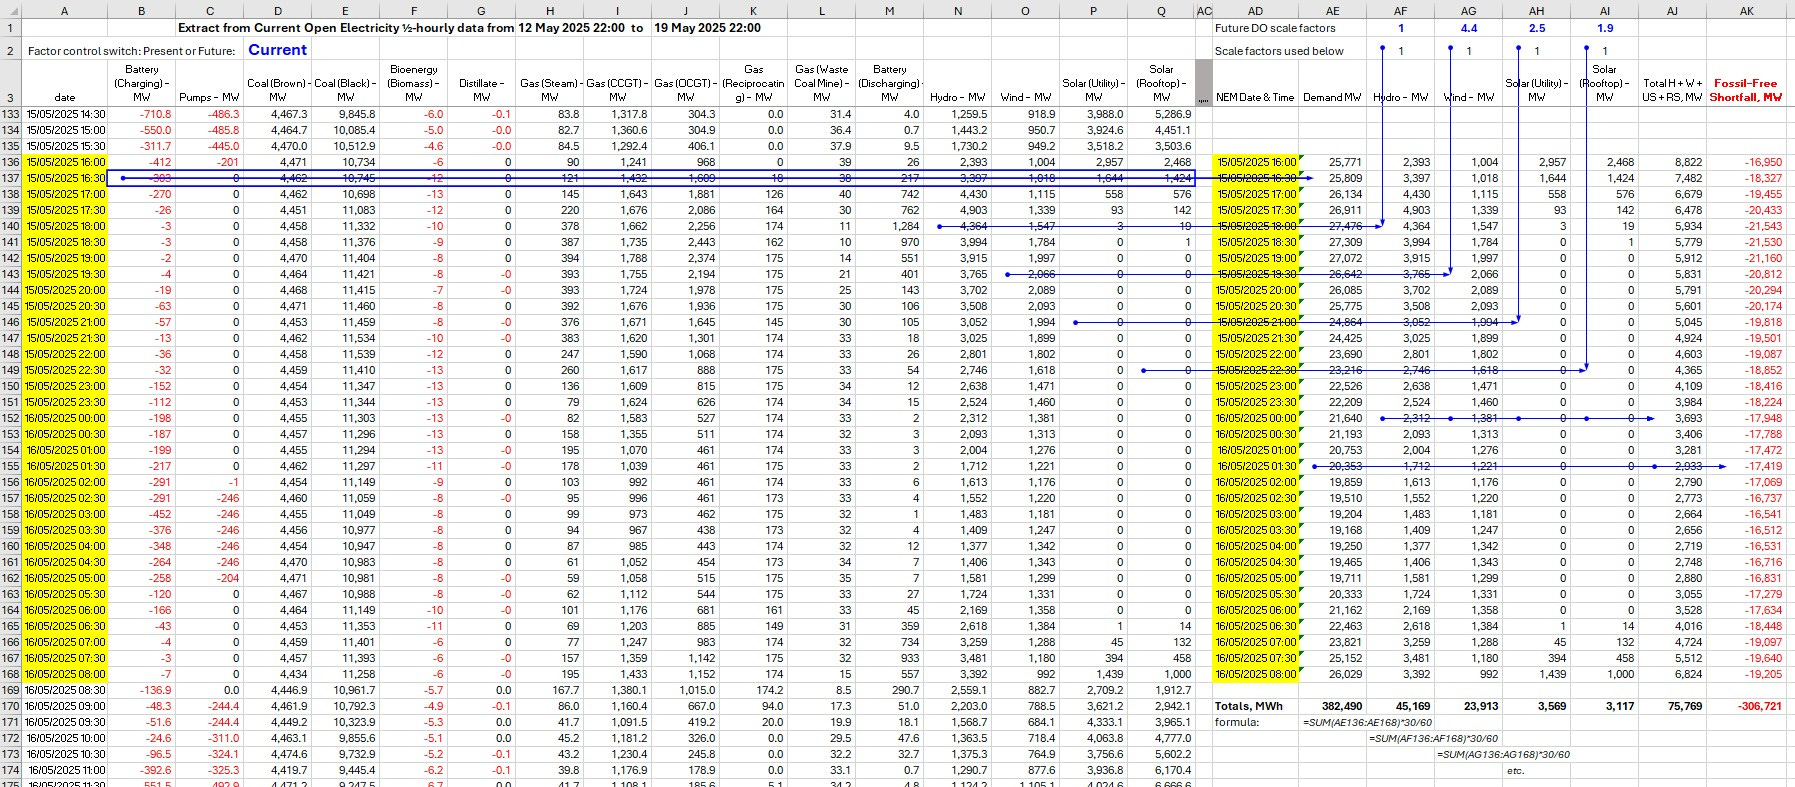
The recorded, published NEM values are in columns A thru Q of my Excel file.
Each row has the recorded power flows for that half-hour interval.
I have formatted the numbers to show negative numbers in red; all numbers to show thousands comma-divided; and all numbers to zero decimal places. These give a clearer visual picture of the relative importance of the various sources of generation.
(For example, they clearly show the minimal [all negative] values of Biomass.)
In columns AD thru AK I show my *arithmetic*, as follows:
- column AD just reflects the NEM Date & Time stamp of that set of data;
- column AE sums all the power generation values in that set of data and, because Demand must = Supply continuously, that must = DEMAND in that interval;
- column AF shows all the HYDRO values (Peter F please note);
- column AG shows all the WIND values;
- column AH shows all the SOLAR UTILITY values;
- column AI shows all the SOLAR ROOFTOP values;
- column AJ shows the addition of each data-set’s HYDRO + WIND + SOLAR UTILITY + SOLAR ROOFTOP = combined fossil-free generation;
- column AK shows the result of subtracting DEMAND from [HYDRO + WIND + SOLAR UTILITY + SOLAR ROOFTOP]; negative numbers represent Shortfalls of fossil-free generation i.e. failure to satisfy Demand that ½-hour interval.
Figure 2: DO’s Future NEM 15/05/2025 16:00 thru 16/05/2025 08:00:
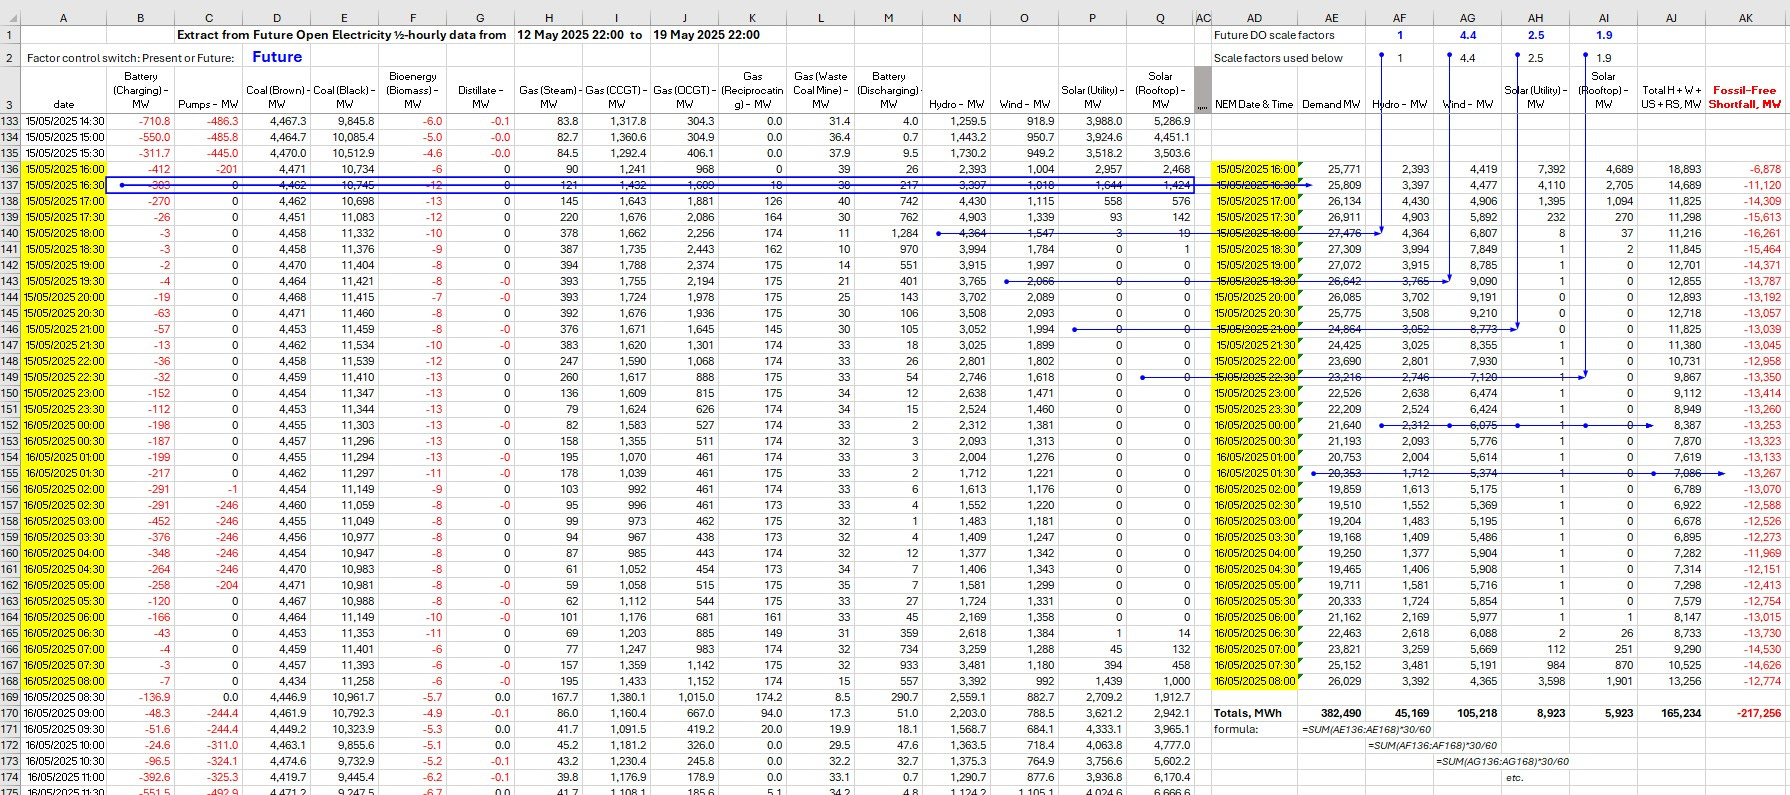
David Osmond published the Scale Factors [the factors by which Wind and Solar would need to be increased in the bright new (nearly-)fossil-free Australia] as shown in cells AG2 thru AI2, viz:
4.4 for Wind;
2.5 for Utility Solar;
1.9 for Rooftop Solar.
He doesn’t publish a scale factor for future Hydro, and Peter F gets very excited about future Hydro and how he claims I’ve missed out Hydro from my analysis (but I haven’t as you can see). I’ll come back to Hydro, below. First, just look at the ½-hourly energy balances that result from DO’s factors in Figure 2.
Across that 16-hour interval the NEM would be over 200,000 MWh Short of fossil-free electricity. (No wonder the DO-postulated 120,000 MWh energy storage
= ~ 71 times the Waratah Super-Battery at AUS 1 billion each
would go flatter than a pancake.)
The magnitudes of the deepest Shortfalls are over half of Demand:
In other words, over half of Aus would be in blackout unless that 217,256 MWh Shortfall was made up by burning fossils.
The magnitudes of the Shortfalls are also mostly ~10,000 MW greater than the Hydro in each interval. In drought-prone Aus I greatly doubt that a future expanded Hydro would come to the rescue.
What’s that, Peter?
“On the highest hydro day in the last year hydro ran at 27% capacity for the 24 hours and peaked at about 60 %. For the highest week it ran at 21%. By the time Cethana, Snowy II, Borumba and Kidston are on line peak hydro can be doubled and output for a week can be more than doubled. Nowhere is that accounted for in Chris's calculations.” [Part of a comment left on my previous post]
Quite what relevance the first part of his comment has to my approach generating an energy balance every ½-hour, I fail to see. Straw-manning? Deflection?
Anyway, re: “Nowhere is that accounted for in Chris's calculations.” Au contraire, Peter, Hydro is in there as you can clearly see above.
And, Peter who is the [self-declared] expert on Hydro, you have made the very basic error in confusing Pumped Hydro energy storage [Cethana, Snowy II, Borumba and Kidston are ALL pumped energy storage schemes] with Hydro generation. Your listed pumped energy storage schemes are included in the 120,000 MWh storage side of the energy balance ledger. They will be handy to time-shift energy, as all energy storage is, but they will be net consumers of energy from the NEM grid.
But… but… bifacial Solar panels… super-dooper Wind turbines…
They are all included in DO’s scale factors, Peter. The exact details of how the scale factors are achieved don’t matter.
Whether the scale factors are sufficient to close the energy balances ½-hour by ½-hour is the key thing.
I have shown in my previous post that David Osmond’s scale factors are NOT sufficient to close the energy balances ½-hour by ½-hour for
nearly 36%
of the time across that 1008-hour period about which he made his claims.
I have further demonstrated my detailed methodology in this post.
If you have a RELEVANT polite technical argument to let me know where you think my ½-hourly energy balances are incorrect, please let me know. If you just want to deny without providing numerical evidence, or provide irrelevant obfuscation, I’ll ignore you.
Copyright © 2025 Chris S Bond
Disclaimer: Opinions expressed are solely my own.
This material is not peer-reviewed.
I am against #GroupThink.
Your feedback via polite factual comments / reasoned arguments welcome.
[sarc font needed]
I may be completely misunderstanding what you are doing, but why have you included hydro in column AJ?
Surely it should be treated the same as Batteries and fossil fuels, because it can be dispatched when needed and turned off when not. Batteries and pumped hydro need to charge using other power sources. Non-pumped hydro needs to charge with rainfall, but the rain doesn't have to fall within the 1/2 hour period.
(Fossil plants may also have a limit on how fast they can be "charged" depending on how close they are to their source of fuel and how quickly it can be extracted or delivered, but it's likely that they can be charged at close to 100% of their maximum generation, so this can probably be ignored).
https://open.substack.com/pub/mliebreich/p/decarbonizing-the-last-few-percent?utm_source=share&utm_medium=android&r=o2bbq
What do you think of this analysis?