NESO Maths: Double Ungood
NESO's dodgy arithmetic could mislead when judging how the GB power grid 'transition' is going

Summary
The UK National Energy System Operator (NESO) provides a data portal of “Historic generation mix and carbon intensity”.
The NESO data for ZERO_CARBON_perc [percentages] reported each ½-hour time interval throughout the datafile is wrong. Real ZERO_CARBON percentages are lower / much lower than those reported in NESO’s data-file.
The NESO GENERATION data for whole years is not reconciled to energy quantities reported in the Digest of UK Energy Statistics (DUKES) [National Statistics]. This means real percentages [of LOW_CARBON and RENEWABLE] are likely lower than reported in NESO’s data-file .
If NESO cannot get simple maths right, how are we meant to trust NESO claims?
Also, “All Net-Negative values are curtailed at zero” means NESO fails to report round-trip energy losses for Pumped Hydro and other forms [e.g. battery] of electrical energy storage: a significant and increasing misrepresentation.
NESO Data (available from 01 January 2009)
I’ve recently become aware of the UK National Energy System Operator (NESO) data portal of “Historic generation mix and carbon intensity”. The introductory blurb states:
“… It has seasonal decomposition applied to correct missing or irregular data points. The data is subject to change due to a data cleansing process taking place to provide the most accurate figures.
Batteries (NET discharge) are currently included in the OTHER category. Transmission-connected solar farms are currently included in the OTHER category. Pumped Storage units (NET) are represented in the STORAGE category.
All Net-Negative values are curtailed at zero.
Updates will be released later in 2026, to highlight BESS (Battery Energy Storage System) and Transmission Solar values.”
[I have modified paragraph breaks to make clear the various claims being made. Note also to NESO: today is 2nd July i.e. half-way through the year, where are the ‘updates’?]
Anyway, excellent! I thought. Here is data from the grid system operator which is being corrected and improved in near-real time…
The NESO comma-separated variable (.csv) data-file currently comprises nearly 307,000 rows = data sets, with data recorded every 30 minutes1. It is currently a reasonably-modest 59Mb. It can be readily converted to Excel which can then be used for number manipulations (SUM, AVERAGE, MIN, MAX, etc.) The same (or extrapolated) data can also be readily plotted. Double excellent!
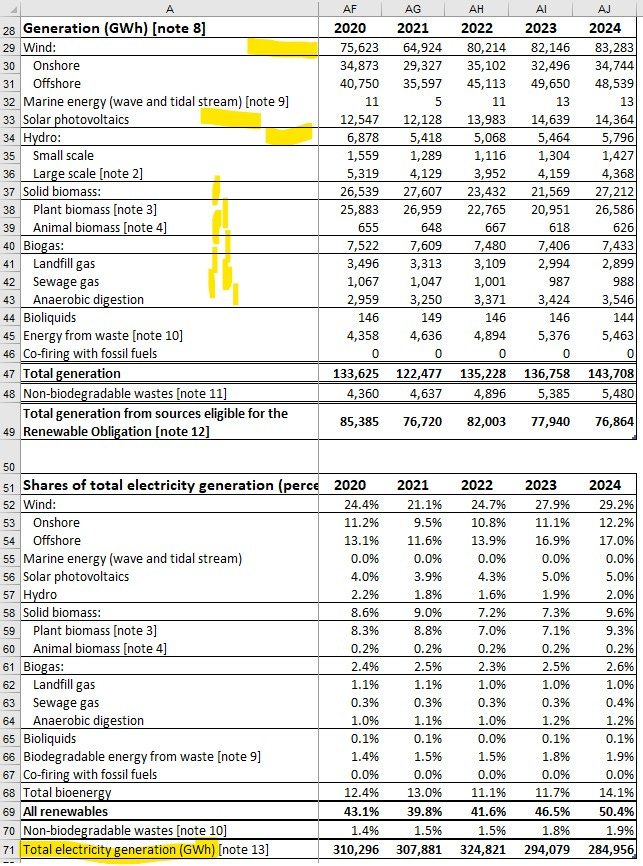
I hoped this would save me from having to apply adjustment factors to the Gridwatch data I’ve used heretofore to force overall agreement between Gridwatch energy quantities and those in the National Statistics publication Digest of UK Energy Statistics (DUKES) produced by the Department for Energy Security & Net Zero (DESNZ), see Figure 1.
Figure 1: DUKES 6.2 for 2020 thru 2024:
Because when NESO claims: “… data is subject to change due to a data cleansing process taking place to provide the most accurate figures”, they surely mean they are rationalising their data to ensure agreement with the official energy statistics published in DUKES…
NOT AT ALL.
Details of how I analysed the NESO data are included in Appendix 1.
Figure 2: Whole Year 2020:

Clearly, NESO’s “data is subject to change … to provide the most accurate figures” does NOT extend to rationalising the year’s total MWh of GENERATION to that presented in UK Energy Statistics. The total MWh of GENERATION is the denominator in all the calculations of [ENERGY]_perc, so using NESO’s lower value of total MWh of GENERATION artificially inflates NESO’s reported [ENERGY]_perc values.
I found that the totals of Wind generation reported by NESO are quite similar to DUKES. The Solar totals are less similar, but NESO states that ‘Transmission-connected solar farms are currently included in the OTHER category’ leaving a degree of fuzziness / uncertainty in the NESO reporting of that / those parameter(s).
I’m not sure that I’ve correctly inferred the origin of the numbers in NESO’s derived columns entirely correctly, reference Appendix 1. Regardless, some of the numbers visible in the above snapshot are simply and literally incredible. For example, in my row 17570 (the data for 31 Dec ‘20 22:30):
NESO LOW_CARBON 15,443 MW is > NESO ZERO_CARBON 14,415 MW;
yet NESO LOW_CARBON_perc 48.5% is < NESO ZERO_CARBON_perc 53.6%
Etc. etc.
Make it make sense, NESO!
Figure 3: Whole Year 2021:

It is a similar story with 2021 [and subsequent years’] data. NESO’s figures for GENERATION are not reconciled to DUKES statistics, and NESO’s reported ZERO_CARBON generation total is NOT consistent with the input data. Consequently the percentages, particularly of ZERO_CARBON, reported by NESO in this data-file are markedly exaggerated. However, the Wind percentage total is quite close to the DUKES number, and Solar also may be.
Again, quick check of the ZERO_CARBON numbers from the top row of the above snapshot from whole year 2021:
LOW_CARBON 20,838 > ZERO_CARBON 18,875, but
LOW_CARBON_perc 73.4 < ZERO_CARBON_perc 82
Figure 4: Whole Year 2022:

Again, the relative sizes of the NESO ZERO_CARBON numbers and corresponding NESO ZERO_CARBON_perc values don’t make sense.
Figure 5: Whole Year 2023:

NESO ZERO_CARBON numbers again…
Figure 6: Whole Year 2024:

The total MWh of GENERATION from the NESO figures is much closer in whole year 2024 to the DUKES total. The Solar total is a match if “OTHER” is ignored: I don’t know if it should be.
However, look at those NESO ZERO_CARBON numbers yet again…
A Pattern?
This post has some similarity to the one I wrote in January of this year on the Australian National Energy Market as reported by Open Electricity. Different jurisdictions, different data sources, apparently similar issues of opaque number-crunching being done in the background that results in over-claiming progress with energy ‘transition’. How odd.
Am I Just Being Mean?
Poor NESO, you might be thinking. Couldn’t I have quietly sent an email to their contact details and given them the opportunity to make corrections without any egg on face?
Well, no. They are a well-funded quango2 responsible for keeping GB’s lights on. If they cannot do simple arithmetic, I think people should be aware of it.
After all, it begs the question: how else are they failing?
Appendix 1: Analysis of NESO “df_fuel_ckan.csv“ file
I searched for background technical information on the calculations behind the derived numbers in the file: I couldn’t find it on the NESO data portal home page.
The issue with NESO’s comma-separated values (.csv) file is that it cannot have e.g. explanatory or notes tabs, so the only information on what each variable is is in the column headings:
Columns A to M [data included for example set 2020-05-29T15:00:00 = row 200000]:
DATETIME text field format yyyy-mm-dd hh:mm:ss [= date time 29 May ‘20 15:00]
GAS 5091
COAL 0
NUCLEAR 4757
WIND 3058
WIND_EMB 1302
HYDRO 241
IMPORTS 4086
BIOMASS 2893
OTHER 122
SOLAR 6598
STORAGE 0
GENERATION 28148 [= sum of the listed generation quantities]:

Ignoring column N [CARBON_INTENSITY] as its derivation is secondary and opaque.
Columns O, P, Q and R [again with the data from 2020-05-29T15:00:00] are:
LOW_CARBON 18,849 = re-created by adding Nuclear + Wind + Wind Emb + Hydro + Biomass + Solar:

ZERO_CARBON 10,949: from the numbers listed the closest I can get to re-create this value is by adding Wind + Wind Emb + Solar = 10958 [not 10949, but close]:

RENEWABLE 11,199 = re-created by adding Wind + Wind Emb + Hydro + Solar:

FOSSIL 5,091: = GAS + COAL, ok
Then scrolling across to Columns AE, AF, AG and AH we find that NESO’s listed ZERO_CARBON_perc of 67.7% in Column AF is seriously in error. For the set of numbers from 2020-05-29T15:00:00 this should be 10,949 / 28148 i.e. 38.9%

I don’t know how you feel, but as soon as I find one derived number so seriously in error I begin to doubt the validity of the whole series.
Anyhow, having reconstructed how (I think) the derived values in NESO’s .csv tabulation are generated, I can analyse whole-year results and compare them with DUKES 6.2, see above.
Notes:
For the version of this data I’ve used for the screen-grabs above, I:
- focussed on recent years for which the generation capacities of our Wind and Solar fleets are high enough compared with future plans, that extrapolation is less of a stretch. Hence for this post I’m only looking at the NESO data from 01 Jan 2020 onwards, so I deleted all the rows before that date to reduce the size of the file;
- inserted columns next to the text date and time so as to convert each to plottable date and time [shown with pale green background in Column F].
Then I’ve used column summations in each of the energy columns to determine the whole-year quantities of energy generated by each technology, for example total GENERATION. The NESO data is recorded in MW in each 30-minute interval. Therefore the whole-year’s energy is the sum of the MW *30/60 to get MWh, then divided by 1000 to get GWh; as shown in the example below:
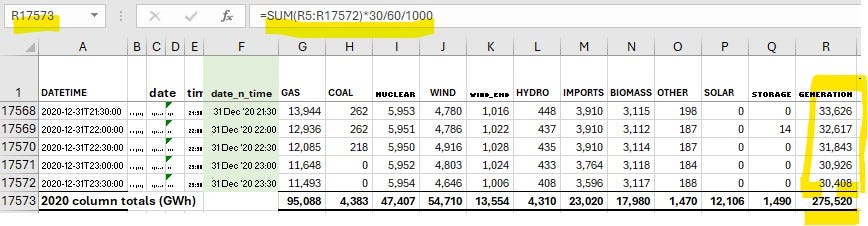
Using what I’ve inferred are the derivations of ‘LOW_CARBON’, ‘ZERO_CARBON’ and ‘RENEWABLE’ energies for a year I can then generate comparisons between column summations of NESO figures [T, U, V & W in the image below] versus the values [in row 17575 shaded pale blue] I can derive from the raw data:
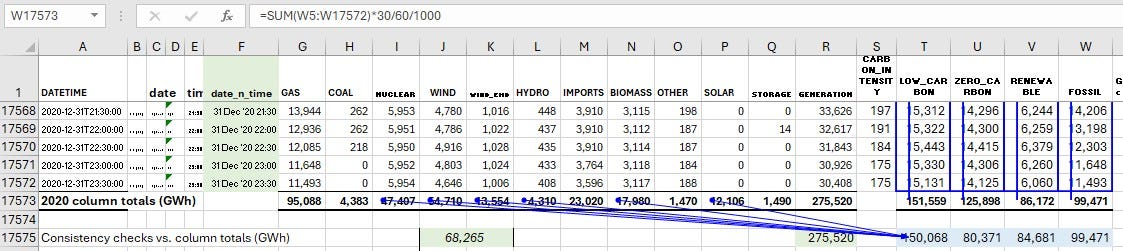
LOW_CARBON is a close match; column summation 151,559 GWh versus 150,068 GWh derived by adding Nuclear + Wind + Wind Emb + Hydro + Biomass + Solar.
ZERO_CARBON is not a match at all; column summation 125,898 GWh versus 80,371 GWh derived by adding Wind + Wind Emb + Solar.
RENEWABLE is a close match; column summation 86,172 GWh versus 84,681 GWh derived by adding Wind + Wind Emb + Hydro + Solar.
FOSSIL is an exact match.
What of it? you may ask. Well, the NESO data includes those derived columns LOW_CARBON_perc; ZERO_CARBON_perc; and RENEWABLE_perc
If, particularly, the ZERO_CARBON numbers in each data set are not consistent with the basic energy data, then the ZERO_CARBON_perc[ent] figures in the NESO data-file are significantly misleading:
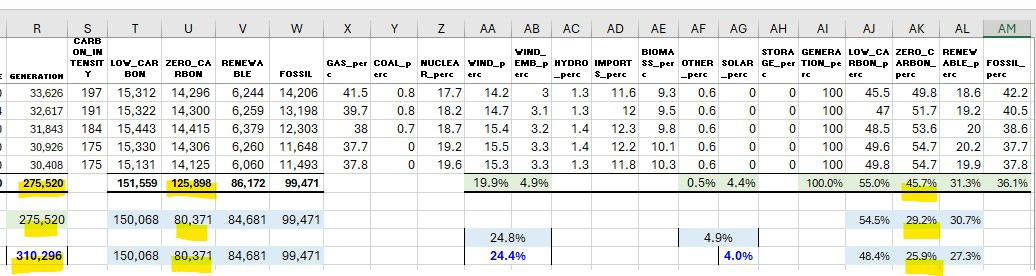
row 15573: GENERATION = 275,520 GWh; ZERO_CARBON = 125,898 GWh (NESO); ZERO_CARBON_perc = 45.7%
row 15575: GENERATION = 275,520 GWh; ZERO_CARBON = 80,371 GWh (CSB); ZERO_CARBON_perc = 29.2%
On top of that, if we base the comparison on the DUKES 6.2 (official UK statistics) total generation figure of 310,296 GWh in 2020, and ZERO_CARBON = 80,371 GWh which I can justify: the ZERO_CARBON_perc is lower still at 25.9%
Conspiracy or cock-up?
Lies, damned lies and statistics?
Take your pick!
Copyright © 2026 Chris S Bond
Disclaimer: Opinions expressed are solely my own.
This material is not peer-reviewed.
I am against #GroupThink.
Your feedback via polite factual comments / reasoned arguments welcome.
I contend that ½-hourly data is the minimum granularity needed to show the day/night extremes of power availability once significant quantities of Solar generation are added to a regional power grid.
I searched “is NESO a quango?” and got this response:

We, the taxpayers of formerly Great Britain, probably paid a large sum for the NESO calculations. So it's right to ask if they're incorrect or misleading. I am personally all too aware how easy it is to screw up calculations!
Secondly, I wonder if you found any instances where the NESO low/zero percentages were lower - as opposed to higher - than the DUKES derived data. If you did, it might suggest calculation errors rather than a methodology that effectively overestimates the contribution of renewables, overestimation being the obvious politically inspired preference to ensure the continuation of taxpayer support for this NGO.
Again, thanks for a thought-provoking article.
It is fascinating to dig into the use and abuse of numbers in the work of net zero planners around the world. They are operating in a parallel universe and there is not a lot of effective communication between them and us😊
We need to mount a more fundamental criticism of the whole enterprise and we have to explore ways to get the message out of our bubble to politicians and voters.
First to suggest the message that we went to send.
What if the transition to wind and solar is impossible in the face of windless nights and the lack of storage at the scale required to get through severe and prolonged wind droughts.
https://rafechampion.substack.com/p/wind-and-solar-aint-capacity
On top of all that, wind and solar don’t generate enough energy to reproduce themselves so they are parasites on the conventional power sources and a net drain on the energy economy at large. 😊
https://rafechampion.substack.com/p/wind-and-solar-are-parasites-on-the
And at the root of the net zero campaign, why are we worried about warming in the range experienced in recorded history and likely to prevail until the next ice age?
https://rafechampion.substack.com/p/enough-of-the-decarbonisation-cult