Part 2 of UK plc Power Decarbonisation
Generation capacity and power storage requirements, based on actual 2020 and 2021 data. I am not in the modelling business; I still prefer to stick close to reality.
Edited 15Mar’22 to add link to next post.
Summary
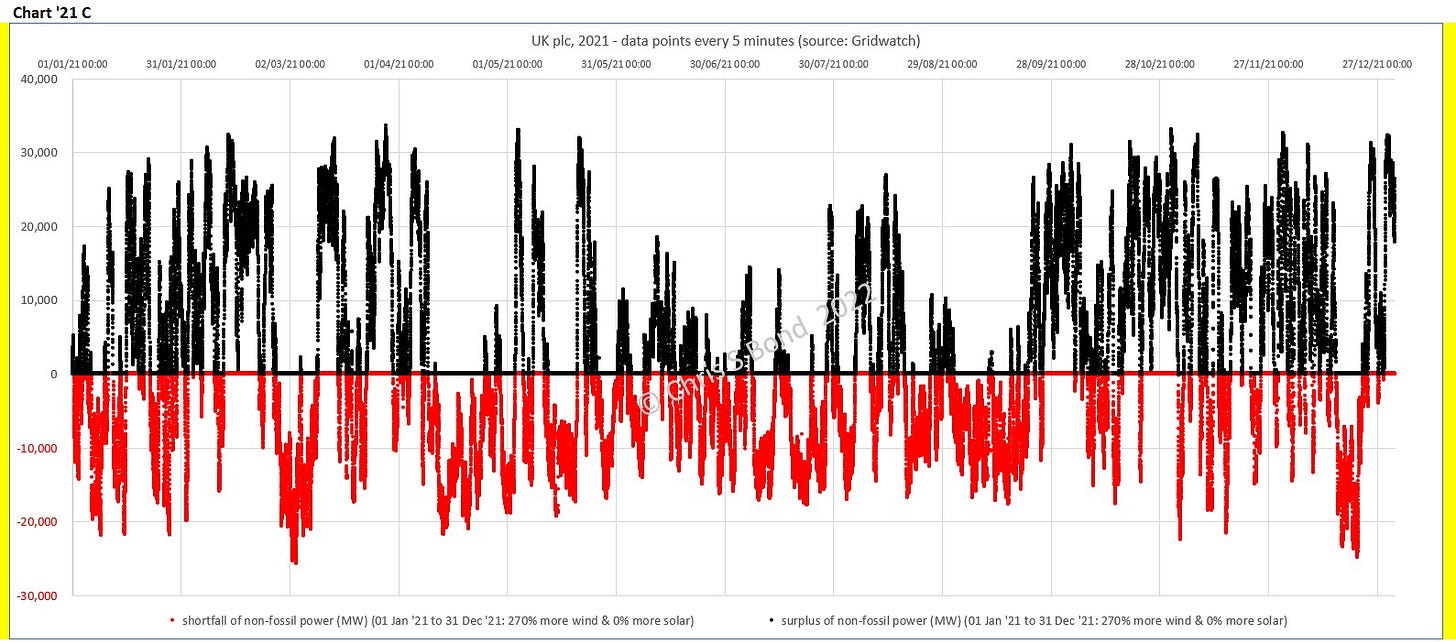
To decarbonise our electricity grid for current demand and recent (2020 and 2021) actual generation patterns, UK plc needs several times current wind generation (onshore + offshore), plus immense electrical storage capacity. I have adjusted my estimates of the requirements by applying a slightly more pragmatic approach than in my earlier substack.
I now conclude that to be Net Zero in a ‘bad’ wind year like 2021, UK plc requires an extra 270% of wind generation plus 13 million MWh of energy storage. With today’s battery technology (not recommending it) this storage is equal to 27,000 Mornington BESSs. At a cost of AUD 190 million ~GBP 100 million each, we get an indication of the potential cost of energy storage alone: around GBP 2,700 million (£2.7 trillion).
Even if the UK was able in future to produce ten times current wind generation there would still be lulls in a typical year when the renewable power produced would not meet demand.
Pumped storage schemes could be hugely expanded in the UK, especially in Scotland. However, when similar developments have been proposed the cost and potential damage to the natural environment have led to the proposals being rejected by the public. If a proposal for a massive pumped storage scheme in Scotland were to succeed the capacity of the north-south power grid would have to be increased immensely .
The UK power grid would anyway require enormous investment to support the huge increases in power flows from the expanded renewable generation facilities. UK plc is already losing renewable power because some windfarms have been approved without taking limited local grid capacity into account.
Nuclear fusion may be our only answer.
Introduction
This follows from my previous substack “UK plc Power Decarbonisation”, in which I began with the premise that UK plc’s power generation must be completely decarbonised. I use actual UK plc power data to begin to scope out the implications of Net Zero on a strictly technical basis. I am not making comment on the merit or otherwise of the Net Zero target, I am just looking at some of its logical implications.
Just a reminder on basic methodology. I use actual 2020 and 2021 Gridwatch power flow data, recorded every 5 minutes i.e. 60/5 = 1/12th of an hour. For around 105,000 sets of data per year I use Excel to convert the power flows (in MW) times 1/12th to get the amounts of energy in mega-watt hours (MWh). I thereby evaluate actual energy from renewables plus nuclear versus actual energy from fossil sources. I apply a multiplier to the renewable sources (wind and solar) to find out just how much more we need to achieve Net Zero. I use Excel to then plot 105,000 results per year, to derive the charts you see below and in my previous substack.
In this substack I continue to use the same units, mega-watts (MW) for power flows and mega-watt hours (MWh) for amounts of energy. This is to keep it human-scale. Most people can envisage 1 MW as the power requirement for 350 electric kettles or 130 electric cars on charge, and that if the car charging continues for 1 hour the amount of energy stored in the car batteries is 1 MWh.
I note that many people in the industry prefer tera-watt hours (TWh), where 1 TWh = 1,000,000 MWh. I think that is so far outside everyday experience as to obscure rather than illuminate. (As an aside, one of my personal bugbears is how jargon as well as undefined abbreviations or acronyms are used by people in every niche in modern life to bamboozle and confuse anyone not in their niche / silo / tribe.)
In this substack I have revisited the 2020 and 2021 data and realised my methodology needs to accommodate a rather fundamental truth: one cannot get electrical energy out of a flat battery. Therefore my analysis has changed slightly here. I also address some comments and broaden my analysis further.
Pumped Storage Expanded
In my previous substack I concluded that UK plc needs 19 million MWh of energy storage for the demand versus renewables generation actual profile of whole year 2021. I erroneously referred to Dinorwig as being the only energy storage system of significant size in the UK. But a commenter reminded me about “Sustainable Energy - without the hot air” by the late Professor David J C MacKay. That free publication is slightly dated but is packed full of really useful concepts and information, including this table in Section 26:
Of the four pumped storage stations listed:
Ffestiniog is also in Wales and pre-dates Dinorwig.
Cruachan and Foyers are both in Scotland.
According to online information they are all still operating and their ‘vital statistics’ are as reported by Prof. MacKay, except Cruachan has generation capacity 440 MW for more than 16 hours. Thus its full-power energy storage capacity is actually 440MW x 16h = 7,040 MWh (just over 7 GWh instead of the 10 GWh in Prof. MacKay’s table). I have indicated this in the red text.
Thus the UK currently has around 1.3 + 7 + 6.3 + 9.1 = 23.7 GWh ≈ 23,700 MWh of pumped storage. That is 0.12% of the 19,000,000 MWh we need to completely decarbonise UK plc power for current demand.
Could we greatly expand pumped storage in the UK?
Commenter Ron Hughes pointed me to a Euan Mearns / Energy Matters post "The Loch Ness Monster of Energy Storage" dating from 2015. There Euan talks about the Strath Dearn Pumped Hydro Storage concept beside Loch Ness in the Scottish Highlands, with capacity to store 6800 GWh (6,800,000 MWh, i.e. 36% of what I think we need. A very good start, no? Just two more of those and we’d be there.
Except, as Euan goes on to discuss, the environmental destruction required for a scheme of that immense scale is completely unacceptable to society. (Just take a look at the excavations the Dinorwig scheme required. At least Dinorwig was originally the world’s largest slate quarry, and by the time its scheme was proposed it was already the site of a massive scar in the mountainside.)
So the answer to “Could we greatly expand pumped storage in the UK?” is quite probably “NO!”
Storage Estimates: me versus Professor MacKay
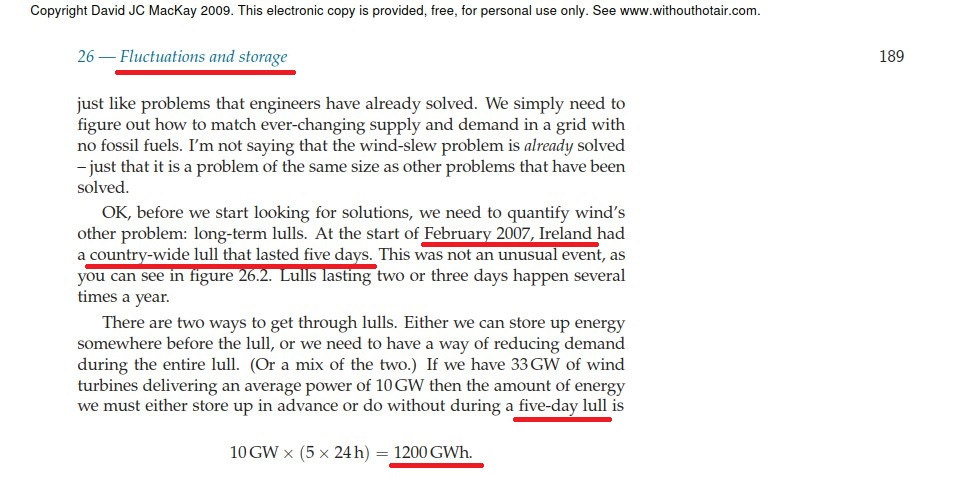
David J.C. MacKay FRS was Regius Professor of Engineering at Cambridge University Engineering Department, a much more eminent figure than me. I graduated from Cambridge University after a couple of years in the Engineering Dept. followed by two years in the Dept. of Chemical Engineering. Regardless, I do not flatter myself that I am anything like as smart as him. So why am I confident my 19,000,000 MWh is more realistic than his estimate of ‘only’ 1200 GWh = 1,200,000 MWh?
He considered lulls in wind and consequent energy storage needs:
He was writing based on the very limited data available to him as you can see from the extract above (my red underlining). The Gridwatch™ website was only created in 2009 (thank you again MontyDog.) It has recorded power flows every 5 minutes across UK plc for the last ten years. Thus we have access to vastly better data now, and from it can show the aggregate of the lulls across UK plc is much greater than 5 days in both 2020 and 2021. Essentially, Prof. MacKay had garbage data in, so despite his eminence I’m afraid his answer was garbage out.
Storage Estimates Revisited
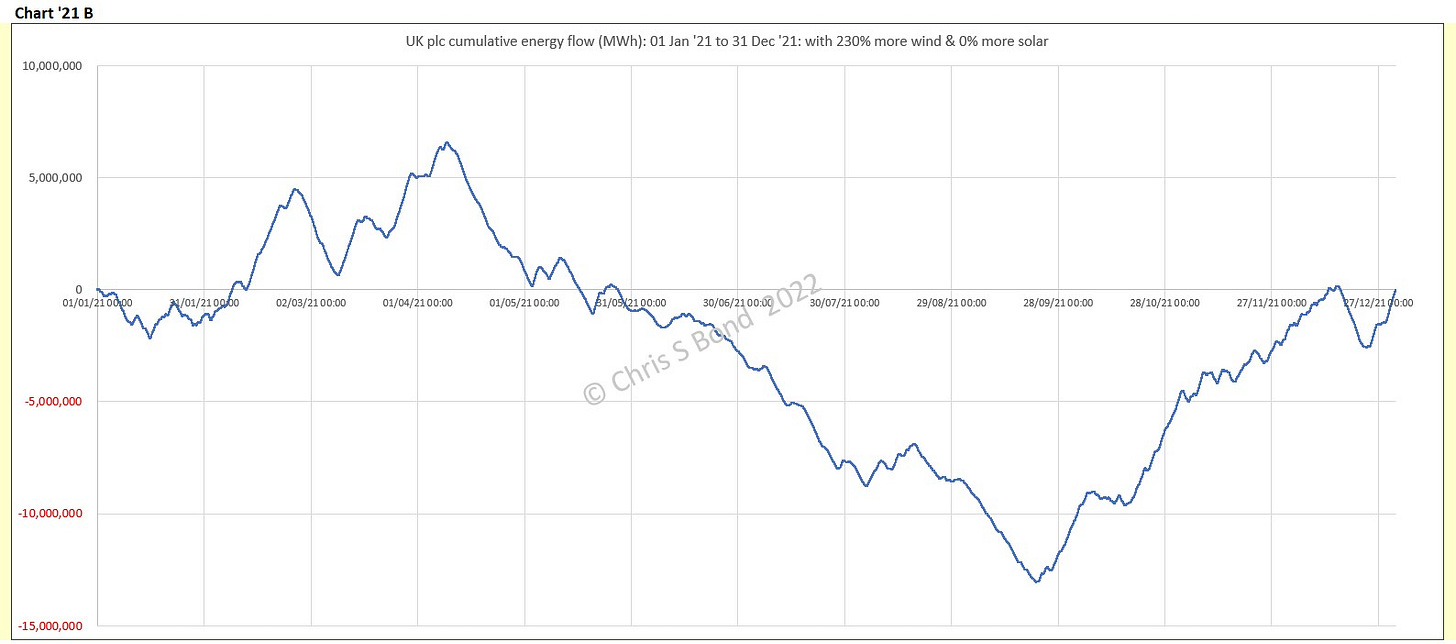
In my previous substack I used my British Standard Mark 1 eyeballs to estimate the difference between the high and low points on Chart 21B-5: 330% of current wind, 100% of current solar, cumulative energy 2021, re-posted below. That difference, high to low, is about 19 million MWh.
The problem is that one cannot get electrical energy out of a flat battery. This is where my original conceptual approach fell down, and my commenters were kind enough not to point it out to me. The whole of the chart needs to be shifted until the “mega-battery” never goes flat at any point in the year.
One way to shift that cumulative energy curve is bodily upwards until no point is negative, that is, at no time does the battery go flat.
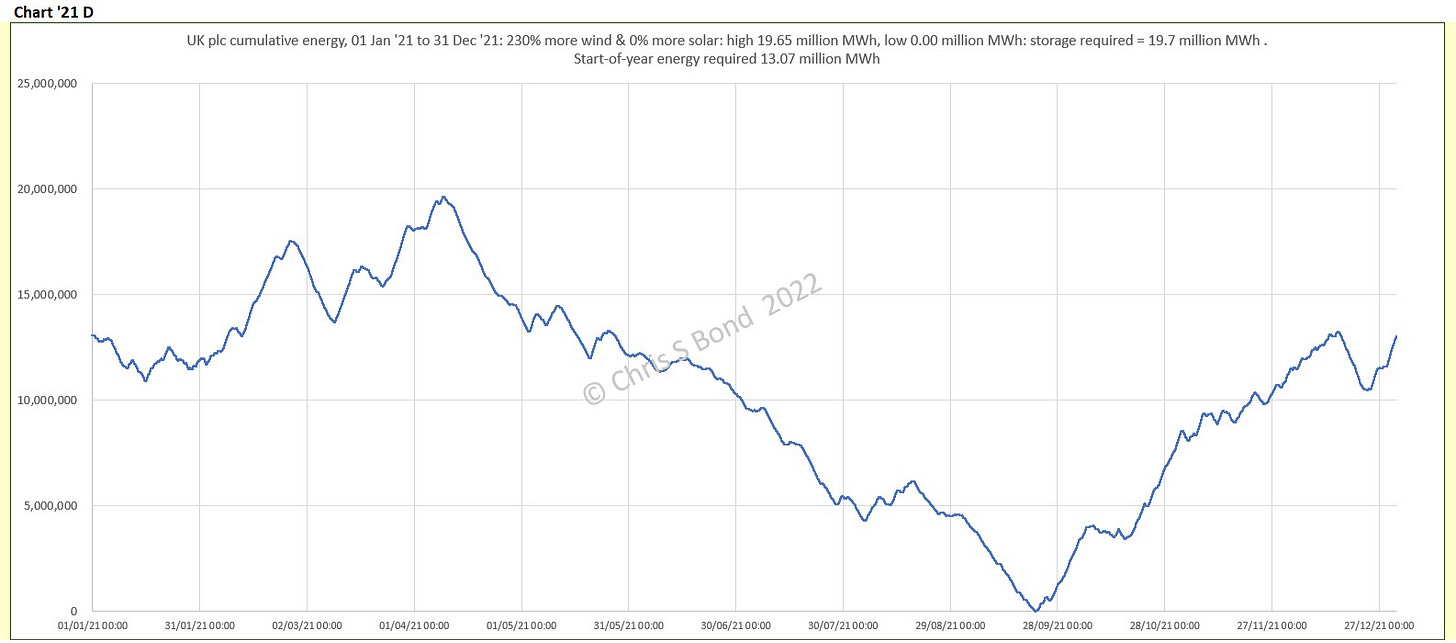
Chart 21D-1: 330% of current wind, 100% of current solar, shifted upwards with ‘other’ energy injection, cumulative energy 2021:
The upwards shift requires an injection of 13.1 million MWh of ‘other’ energy. For arithmetic convenience I have shown it as a “Start-of-year energy required” but energy ‘injections’ could actually be made along the curve to keep that lowest point positive. I have added to the chart header the high and low storage values and the resulting difference = the energy storage required for this scenario, is
19.7 million MWh. So my Mark 1 eyeballs were ‘close enough for Government work’.
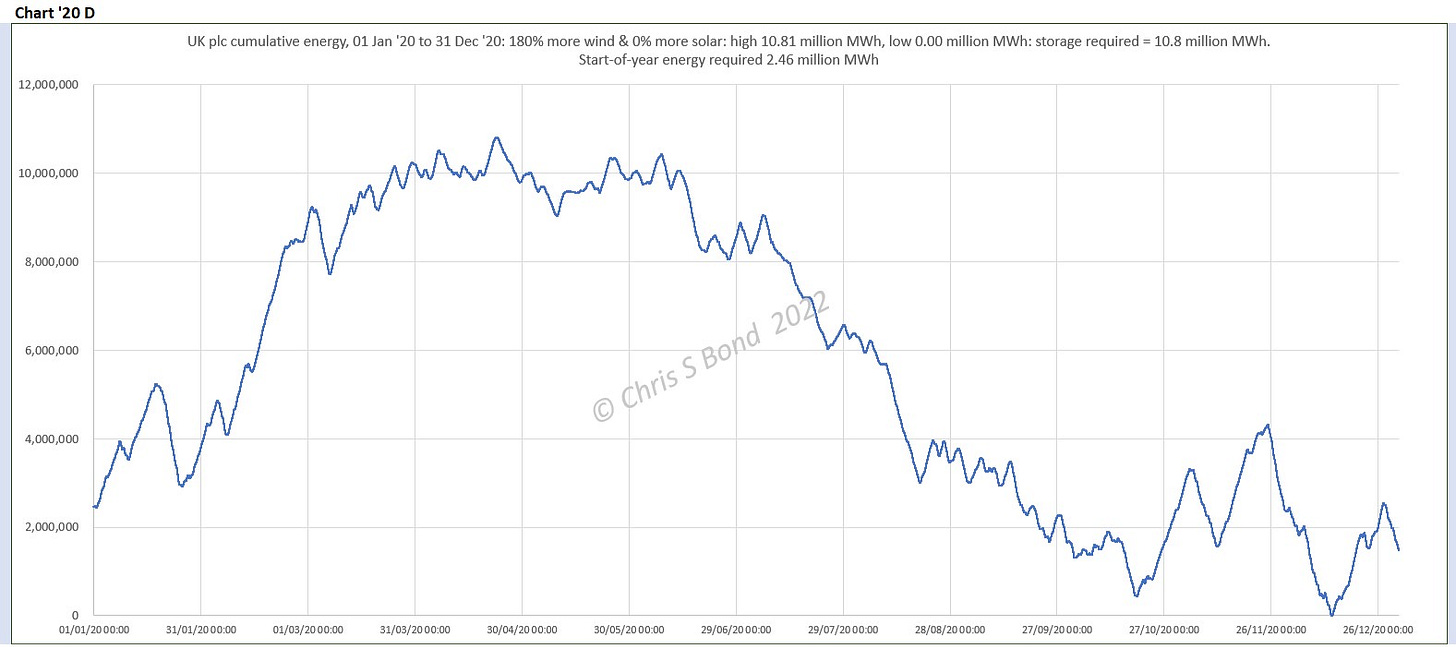
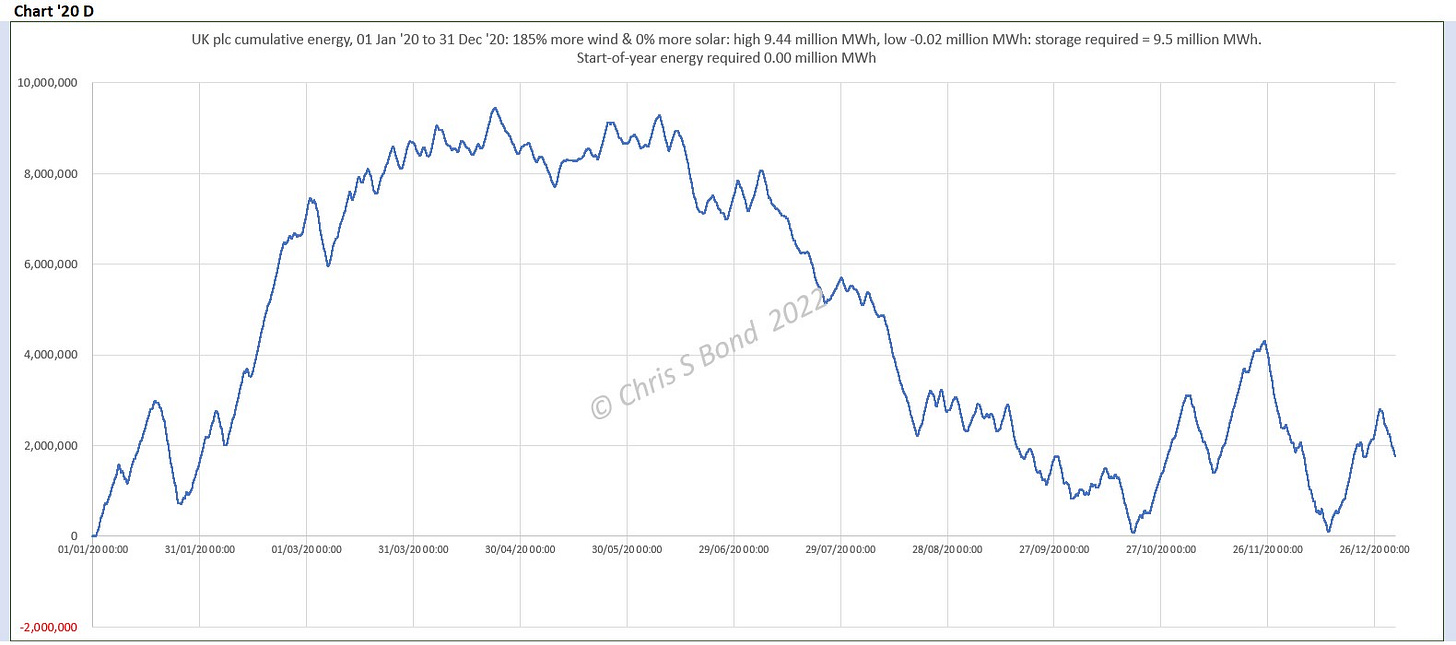
Revisiting the 2020 cumulative energy chart in a similar way gives Chart 20D-1 below.
Chart 20D-1: 280% of current wind, 100% of current solar, shifted upwards with ‘other’ energy injection, cumulative energy 2020:
Here the injection of ‘other’ energy requirement is only 2.5 million MWh for the year, while the energy storage requirement is the same as in my previous substack at
10.8 million MWh.
More Wind Generation - 2021
Our Prime Minister has declared it his ambition for the UK to be “the Saudi Arabia of wind power”. I have been inside the Saudi Aramco control centre in Dhahran. I can assure the PM that there is not the remotest similarity between Aramco’s tightly-controlled and minutely scheduled country-spanning oil, gas, utilities and shipping operations, and the UK’s unpredictable weather. But anyway, continuing to work with the 2021 actual data and dismissing pyramids of piffling problems such as cost and resources required, let’s see where more wind generation gets us.
My target is to just eliminate the injection of ‘other’ energy while staying above the zero axis. If we accept that a ‘small’ shortage can be accommodated I end up with the cumulative energy curve below.
Chart 21D-2: 370% of current wind, 100% of current solar, 'pragmatic' approach, cumulative energy 2021:
The extra wind generation has rotated Chart 21D-1 counter-clockwise until the large dip at the end of September is of the same magnitude as the dip at the start of the year. Only 1.4 million MWh of ‘other’ energy has to be injected in the first two weeks of the year. Then (to an engineering approximation) our battery would be charged and remain available for the other 50 weeks of actual 2021. The cumulative surplus is close to 20 million MWh by 31 December, a very good amount of charge in the battery for the year after.
Alternatively and more practicably, we could stop at the horizontal green line I have added to the chart. This accommodates the large peak in early April and most of the remainder of the year’s accumulation. This reduces the required energy storage to only 13 million MWh versus nearly 20 million MWh above.
Now 13 million MWh is still the gross energy storage capacity of about 160 million Tesla Model 3s. The Office for National Statistics (ONS) estimate of the UK population at mid-year 2020 is 67.1 million. If every man, woman and child in the UK each had 2½ Tesla Model 3s, all linked to the grid and at the grid’s command, that would do it. Elon Musk would be extremely happy, but I fear the business case to Rishi Sunak, our Chancellor of the Exchequer, would be tricky to make.
A bit more credibly, the 480 MWh Mornington battery energy storage system (BESS) can be our reference, at a cost per BESS of about GBP 100 million. This means the energy storage need is 27,000 Mornington BESSs at a cost of around GBP 2,700 million, or around seven times what the UK spent on emergency Covid measures. That is in addition to the costs of increasing wind generation by 370%, of strengthening the power grid, and so on.
We currently do not have that storage capacity, and we currently do not have ‘customers’ for that surplus energy. Consequently, if we went ahead and increased wind generation by another 270%, on windier days the farms would have to be turned down or off, with constraint payments being made to their owners.
Anyway, continuing with the premise of this whole exercise, the instantaneous renewable power generation chart for the above scenario is below.
Chart 21C-1: 370% of current wind, 100% of current solar, for the year 2021:
Maybe we would use the surplus power in electrolysers (which don’t currently exist) to intermittently generate green hydrogen? Although with peak power flows of
20-30,000 MW (20-30 GW), absolutely immense investment in the infrastructure of the electrical grid would be required at the least.
More Wind Generation - 2020
Applying a similar approach to the 2020 data and adjusting the wind generation factor with the target of reducing the injection of ‘other’ energy to near-zero, we get similar charts for 2020.
Chart 20D-2: 285% of current wind, 100% of current solar, 'pragmatic' approach, cumulative energy 2020:
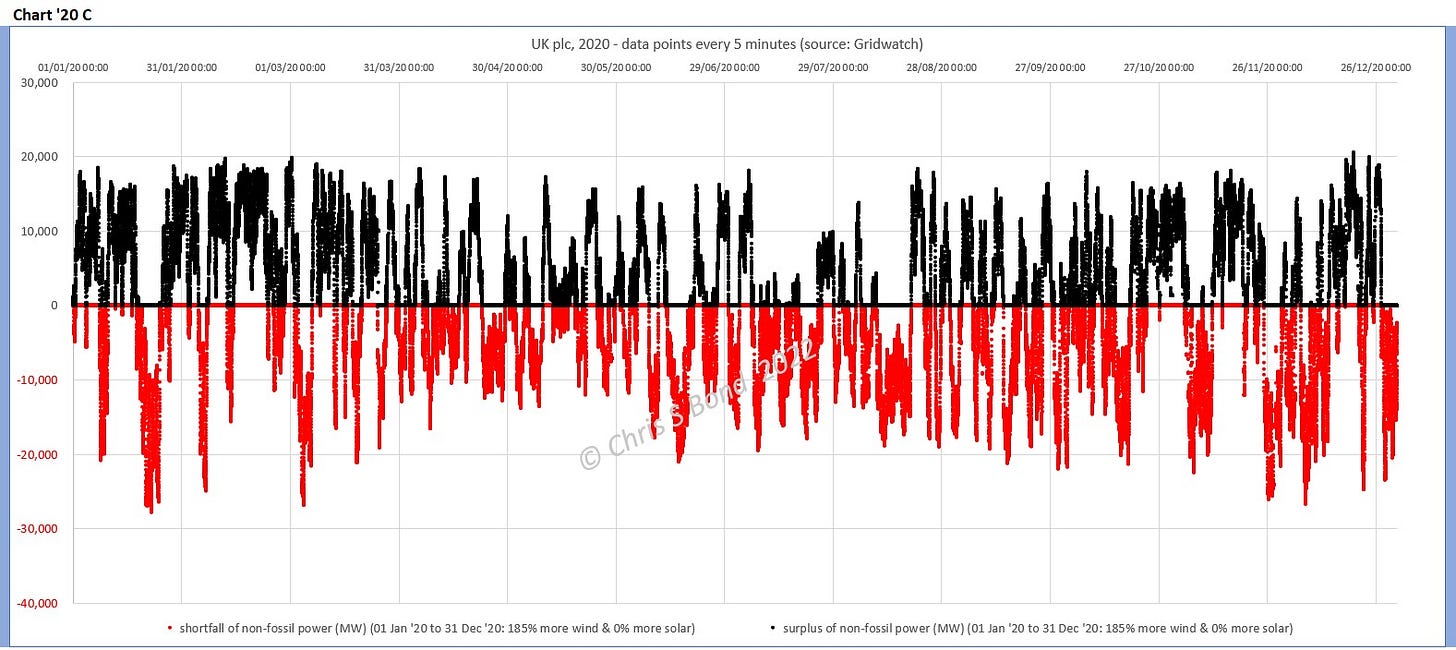
In 2020 the timing of the lulls was far more benign, so only a small adjustment in the wind generation factor achieves the target. The instantaneous renewable power generation chart for 2020 is below.
Chart 20C-3: 285% of current wind, 100% of current solar, for the year 2020:
Ten Times Wind Generation
Absolutist proponents of Net Zero tell us we must completely eliminate our dependence on fossil fuels and only use renewable energy. They say we only need to add more renewable capacity and we will reach the zero-carbon goal. Perhaps you have seen a newspaper headline or study result that says that in a given month country X’s share of renewable energy was 50%? And the response was along the lines, “Hoorah, we are half-way there!”
I’m sorry, but cherry-picked data from one benign week or month do not tell us that all we need to do is more of the same and we’ll keep the lights on 24/7. A power grid must be balanced every minute of every day of the year.
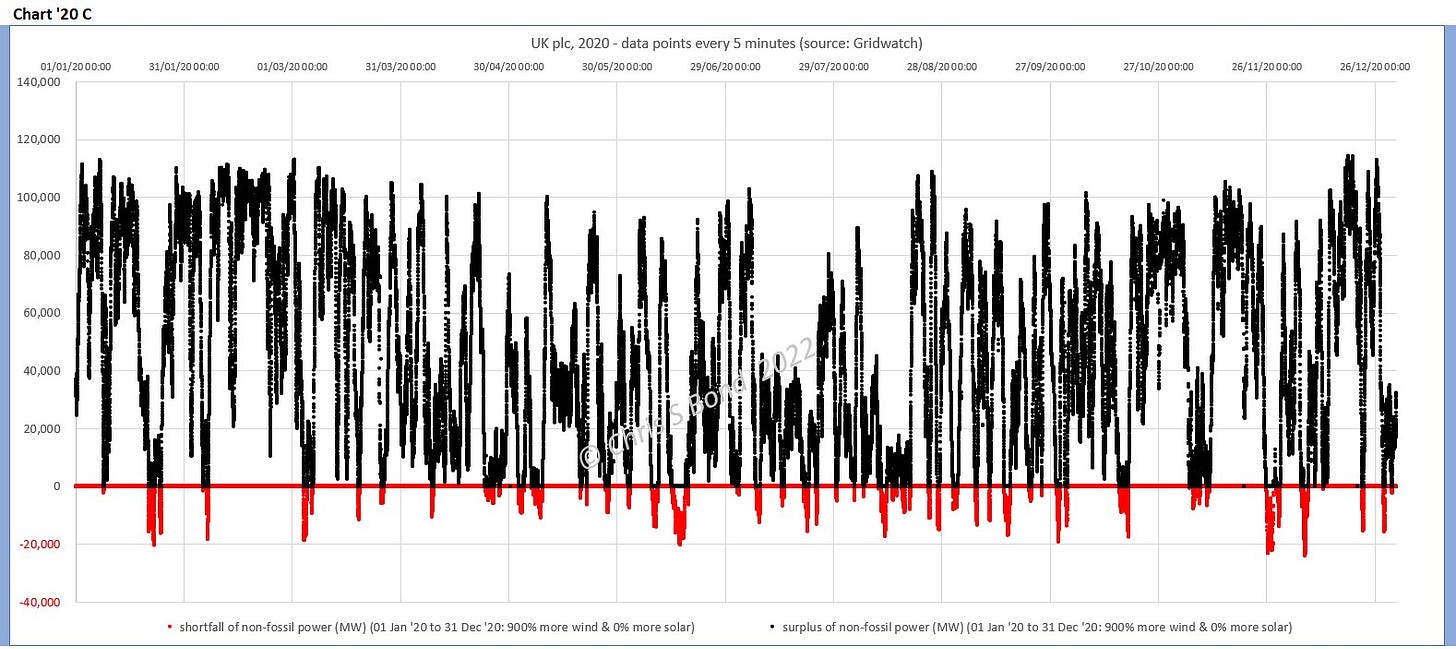
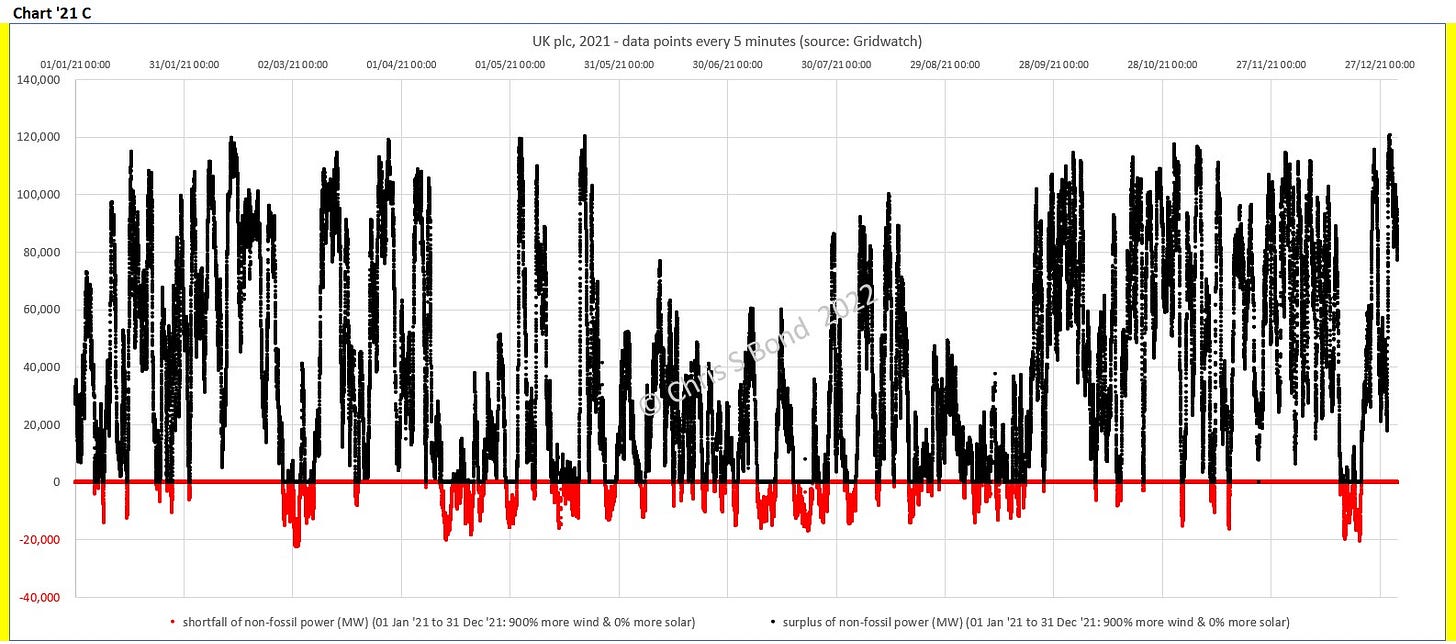
Let us look at the 2020 and 2021 records of actual renewables generation, and apply a 1000% (ten times) multiplier to current wind. First, for actual year 2020, then for actual year 2021.
Chart 20C-2: 1000% of current wind, 100% of current solar, for the year 2020:
Chart 20C-2: 1000% of current wind, 100% of current solar, for the year 2020:
In both years there were lulls so deep that even ten times the wind generation would not be sufficient to prevent power shortages, shown in red, of up to 20,000 MW. Also, look at those power peaks up to 120,000 MW = 120 GW. That is three times current maximum UK demand; our grid simply could not take it. Even if it could there would not be customers for it in the UK, and interconnectors currently only have capacities of a few GW.
What, Then?
Burn more bio-fuels? Prof. MacKay indicates in his book that a large proportion of the UK’s land surface would have to be planted with energy crops. Yes, we could import more than we are already doing to fire Drax. But that exports our problem to other countries with all the potential unintended consequences that can entail (deforestation, anyone?) as well as the increased emissions from transport.
Pray for benign wind? We could collectively pray for wind conditions that are as benign and consistent as modellers usually assume.
Interconnectors: To venture into the political for a moment, we are currently seeing the downsides of a sovereign nation constructing a barrel-shaped pipeline and then obligingly bending over it. Sovereign nations can have disagreements and threaten energy supplies to others to get their way. But, you say, that could never happen between UK and France… oh, wait. Apart from those trifling considerations, the whole of Europe and Scandinavia are going to wake up to these same implications sooner or later. A lot of Europe seems to be assuming that Norway with its hydro-power is going to come to the rescue. I think they are overestimating what Norway can do for a continent.
Apply the technical solutions we already have, right now, just get on with it. But we don’t have perfected technical solutions this big, and we don’t have the engineering and material resources available at a click of the fingers. Never mind the mind-boggling sums of money necessary.
I know. I have a cunning plan.
Develop nuclear fusion in 2023 and fully commercialise it by 2030.
Notes:
The combinations of generation plus storage I show are almost certainly NOT economically optimal. I am just indicating the potential requirements and limits consequent upon totally ending all fossil energy generation in UK plc.
Also and for the avoidance of doubt, I am NOT advocating current battery technology as the solution. I hope the realisation just how immense is this requirement, will stimulate immense innovation not endless lobbying.
Where I indicate that 2021 was a ‘bad’ year for wind generation, that is only in relation to 2020. In other words, I am not saying 2021 was the worst year the UK can ever experience for wind generation: it was simply worse than 2020. Even worse years may follow.
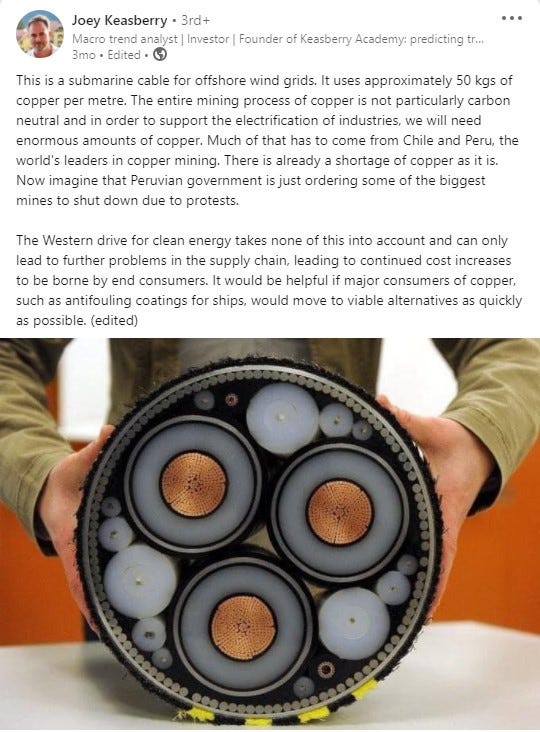
At all times where I use a factor to increase wind generation I mean the effective wind generation as measured and recorded every 5 minutes through 2020 and 2021. Future windfarms are likely to be bigger, with taller towers, longer blades, and larger generators, transformers, inverters, substations, cables, etc. They may possibly be located in generally windier areas, perhaps far offshore and linked to the mainland by cables as shown in Figure 1. (Cables which, despite their armoured exteriors, are susceptible to damage - as operators have been discovering recently.) Whatever the windfarm nominal generation capacities, the effect, the actual rates and amounts of power they generate, needs to be the multiple higher.
Figure 1: example of submarine power cable, posted on LinkedIn as shown.



I don't know whether you've released any new material on UK 100% renewable options, but you may be interested in these. Apologies if you've already seen them. I'd be interested in your comments.
https://100percentrenewableuk.org/wp-content/uploads/100_percent_RE_UK_Results_R2_final2.pdf
https://100percentrenewableuk.org/wp-content/uploads/100-RE-23-Dec-.pdf
Toby
I don’t know if you’ve read FES2023 yet, but National Grid ESO have now got to
"… this leads to a significant hydrogen storage requirement of 10.9 TWh, which is equivalent to two thirds of the UK’s natural gas storage capacity at the end of 2022. All these highlight the importance of hydrogen storage as we decarbonise the grid and move towards net zero in 2050. "
They’re getting closer to your numbers.
Regards
Toby