UK plc Power Decarbonisation
Generation capacity and power storage requirements, based on actual 2020 and 2021 data. I am not in the modelling business; I prefer to stick close to reality.
Edited 26 Feb ‘22 to add this link to my follow-up.
Summary
To decarbonise our electricity grid for current demand and recent (2020 and 2021) actual generation patterns, UK plc needs 2½ to 3½ times current wind generation (onshore + offshore), plus around ten to twenty million mega-watt hours (MWh) of electrical storage capacity.
If the UK continues to add more renewable generation capacity without addressing the immense storage issue I highlight, the result will be wasted power when winds are high and shortages of power when they are low.
Currently the largest grid-scale non-fossil energy storage system in the UK is the Dinorwig pumped power plant (commissioned in 1984: up to 1,728 MW for 5 hours, i.e. about 9,000 MWh, used to meet sudden peak demand). Other than that, the largest operating battery storage facility of 100 MWh capacity in the UK & Europe is currently the Minety battery located in Wiltshire, South-West England. Many plans currently exist for more UK storage, for example the 1,600 MWh Amp Energy project in Central Scotland, given the green light in January 2022.
Power storage needs to be efficient over timescales of weeks and months. Without power storage we will likely miss CO2 reduction targets, while our power will be unreliable. I would argue all future proposals for intermittent sources of electricity should require massive associated power storage systems to ensure the electrical output can be made predictable over timescales of at least weeks.
Solar generation is probably not best for UK plc. We have a northerly location and completely-predictable absence of sunlight for 12-16 hours every winter’s day. We also need electricity most in winter for heating (assuming future heat pumps): solar does not provide it. If, however, sufficient energy storage were to be installed then summer solar power could help to charge it ready for the next winter.
Introduction
Across the world there is huge pressure to generate more and more power from renewable sources of energy. Some modelling of what might be required to achieve Net Zero targets has been done, but thus far I have only seen theoretical models which appear to assume almost everything in their formulation, and then draw firm conclusions from the results.
It recalls British statistician George E.P Box’s aphorism: “All models are wrong; some models are useful.” Or perhaps even GIGO: garbage in, garbage out.
I wondered: how is a member of the general public meant to judge whether a particular model has too much GI to render the output pure garbage versus possibly useful?
Instead of a theoretical approach I decided to perform analysis on verifiable real data for UK plc. Over 10 years’ of actual data on our real demands and sources of electrical power is readily and publicly available, for example via the truly excellent Gridwatch™ website. Their dashboard looks like this:
The Download button on the dashboard gives access to data in .csv format, which can then be manipulated in Excel.
I decided to focus on complete recent years, 2020 and 2021. If I went further back there would have been fewer wind farms, solar farms, etc. in place and generating. There are over 100,000 lines of data per year (a set of records every five minutes) so each downloaded file is about 15 MB. I then needed to manipulate the data in Excel, for example to convert the text date-stamp of each line of data to the real time and date for plotting the charts. (I can make the Excel files available upon request: each is about 42 MB, or 38 MB when zipped.)
The data sets contain the real numbers for all sources of UK plc’s electrical energy as they change with time:
renewables: onshore and offshore wind and solar, plus hydro.
‘fossil’ sources: combined cycle gas turbines (CCGT), coal and open cycle gas turbines (OCGT), plus oil (but very rarely used).
Nuclear.
Biomass.
The UK currently has up to about 6½ thousand MW of nuclear generation, and typically uses 4 to 6 thousand MW of that for baseload. No new nuclear is likely to come on stream for the next several years so I’m assuming it will stay as-is for now.
Biomass can split opinion as to how ‘green’ it is, e.g. Campaigners say Drax biomass 'creates carbon', but for the sake of simplicity I have left its status as-is.
Basics
I aim to get an order-of-magnitude appreciation, a better ‘feel’, if you like, of what it would take to decarbonise UK power generation. So, I use round numbers and approximations in this analysis. In other words, I’m not worried about achieving spurious precision, I want to understand the big picture. I think we all need to understand the big picture in relation to Net Zero targets.
The Gridwatch dashboard shows powers: i.e. energy flows in giga-watts (GW). The downloaded data is in mega-watts (MW): 1 GW = 1,000 MW. One mega-watt power flow is still much greater than most people’s direct experience. Think of roughly 350 electric kettles or 130 electric vehicles (EVs) on overnight charge - that would be one MW. One MW is large enough to be meaningful at grid scale and yet I think it is (just) small enough to be meaningful for non-engineers.
We must do some simple arithmetic with the Gridwatch power flows to calculate amounts of energy. Sets of data are recorded every 5 minutes i.e. 60/5 = 1/12th of an hour. The amount of energy in mega-watt hours (MWh) is the power (in MW) times 1/12th for every set of data. This calculation is repeated for energy from renewables versus the amount from fossil sources for every data set. This gives the total amount of energy (MWh) we need to store - or that we are short of - every five minutes. Summing these amounts of energy gives us a cumulative profile over a year.
Note: I make a point of defining these terms because even energy company press releases say things like “a 360MW energy storage system” when I think they actually mean “a 360MWh energy storage system”. Nominally that could provide for example 360 MW for up to 1 hour, or 60 MW for up to 6 hours. In practice, if it is battery-type storage, to get the greatest life they must operate within the 0% and 100% fully discharged and charged limits.
Dinorwig Pumped Power Plant
Dinorwig in North Wales has a rare combination of features: two bodies of water separated by a large difference in elevation but only ~3 km from each other (no other equivalent site exists in the UK). The upper reservoir, Marchlyn Mawr, is about 500 m above the lower reservoir, Llyn Peris. The two reservoirs are connected by man-made tunnels. At full power, water flows down and through the generator turbines at 400 cubic metres per second.
The Dinorwig station's six reversible turbine generator/pump units are hidden within Europe's largest man-made cavern. They can reach maximum power output in less than 16 seconds. The units act as pumps to move water from the lower reservoir back up to Marchlyn Mawr using off-peak electricity. Overall energy storage efficiency is around 75%. Dinorwig was commissioned in 1984 and is the largest scheme of its kind in Europe.
UK plc Currently
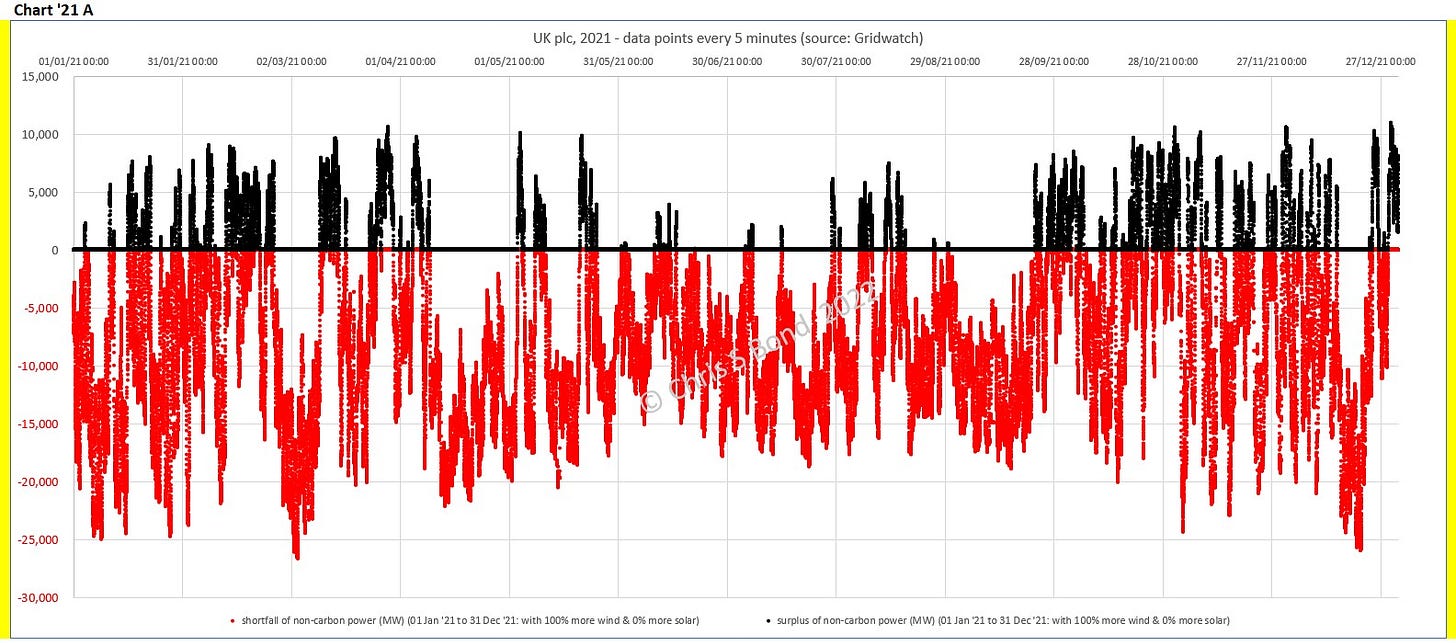
In charts 20A-1 and 21A-1, red shows the shortage of renewable energy. Renewable generation on every day of both years is inadequate to replace the fossil sources of power. On some days the shortage is as low as about 3,000 MW; on other days it is 25-30,000 MW.
Chart 20A-1: 100% of current wind, 100% of current solar, for the year 2020:
Chart 21A-1: 100% of current wind, 100% of current solar, for the year 2021:
The UK grid needs to be balanced: that is, the total supply of energy must equal demand for energy, every minute of every day. We have interconnectors with Europe and Norway, but these have limited power capacities (a total of around 5,000 MW) and they are operated (at least in part) for the benefit of their own populations. They may not be able to supply or receive in line with UK needs, even if willing. Therefore, I have assumed that UK plc will make its own strategic decisions regarding energy security and not rely on interconnectors to adjacent countries. History also indicates those countries can experience low-wind or high-wind conditions for days or weeks at roughly the same time as the UK.
UK Power
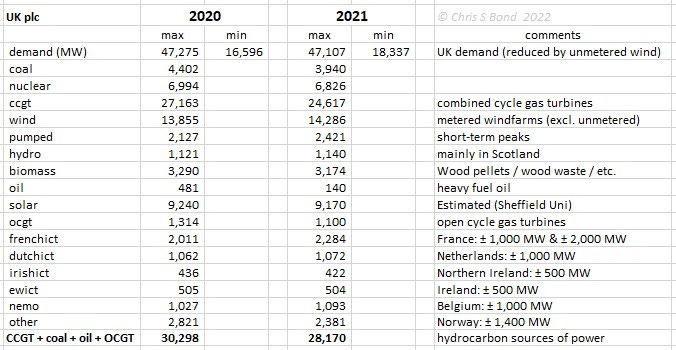
UK plc’s maximum power demand is around 47,000 MW. Currently the maximum actual wind power generated is around 14,000 MW, and maximum solar generation is around 9,000 MW on clear days in high summer. Maximum ‘fossil’ power generation is around 30,000 MW. But we learn almost nothing from peak (or average) numbers.
If we aim for Net Zero we need to replace all the fossil sources of power while at the same time we balance supply and demand, every minute. I have set up my Excel files with wind and solar multipliers; I can then calculate the renewable power surplus or shortfall under various scenarios. (I discuss reducing demand later.)
Double Wind, same Solar
If the UK added the same effective amount of wind generation as we have currently and kept solar the same as now, where would we get to?
Chart 20A-2: 200% of current wind, 100% of current solar, for the year 2020:
Chart 21A-2: 200% of current wind, 100% of current solar, for the year 2021:
Those charts look better: there are more intervals of surplus renewable power flows shown in black. But simply by looking at them we can see we are still short of renewable power overall.
Treble Wind, same Solar
If the UK added two times more of the same effective amount of wind generation and kept solar the same as now, then where would we get to?
Chart 20A-3: 300% of current wind, 100% of current solar, for the year 2020:
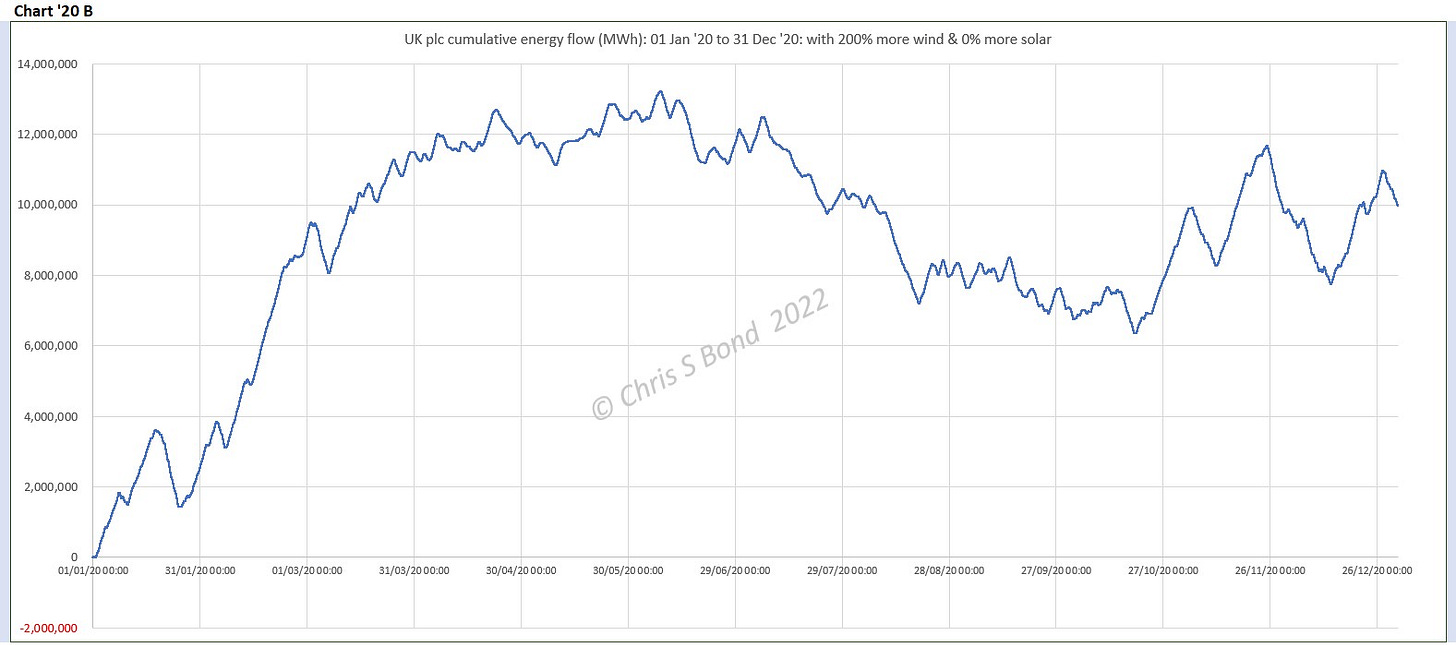
That looks like the amounts of surplus and shortage energy are much more equal. Plotting the cumulative total of energy for the year we get Chart 20B.
Chart 20B: 300% of current wind, 100% of current solar, cumulative energy 2020:
Yes, that would provide more than we need. If we’d had three times the wind generation in 2020 as we actually had, we would not have needed to burn any fossil fuels, and we would have ended the year with ten million MWh of surplus renewable energy.
But ONLY IF we’d had huge energy storage capacity to charge in the windy and sunny times.
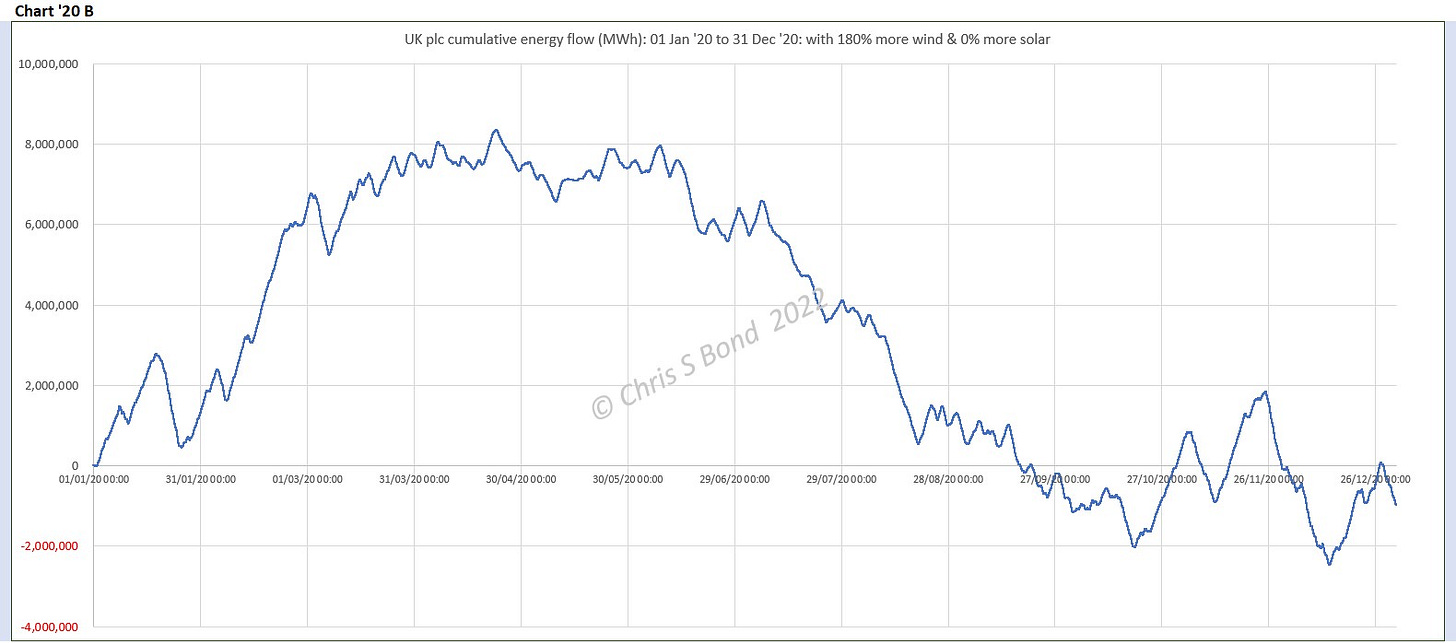
Adjusting the extra wind so that we don’t end the year in massive surplus we get Chart 20B-1.
Chart 20B-1: 280% of current wind, 100% of current solar, cumulative energy 2020:
For this scenario, as well as 2.8 times current wind capacity, we need about 10 million MWh of energy storage. That is 100,000 times the Minety battery, Europe’s largest operating battery. The actual conditions across the UK fleet of windfarms would have charged that storage during the first three months of 2020; the stored energy would have stayed about the same for the next 2½ months; and we would have drawn down that storage over the next 4 months to the end of October 2020. Then for the last 2½ months of 2020 we would have been approximately in energy balance, ± 2 million MWh.
2021, Treble Wind, same Solar
A further problem is that no two years are alike. Adding two times more of the same effective amount of wind generation and keeping solar the same as now for 2021 conditions, we get a chart that is visually more red than black.
Chart 21A-3: 300% of current wind, 100% of current solar, for the year 2021:
This is confirmed by the cumulative energy chart for 2021:
Chart 21B-3: 300% of current wind, 100% of current solar, cumulative energy 2021:
If we doubled the solar power that cumulative chart looks somewhat better but still leaves a huge shortage of renewable energy by the end of September 2021.
Chart 21B-4: 300% of current wind, 200% of current solar, cumulative energy 2021:
Adjusting the solar back to 100% (because as I say above, I don’t think solar is best for the UK) and increasing wind until we end the year roughly where we started in stored energy terms, the cumulative chart then becomes this:
Chart 21B-5: 330% of current wind, 100% of current solar, cumulative energy 2021:
The difference in energy storage between peak and trough is about 19 million MWh (190,000 times the Minety battery). Or, putting it in more familiar terms, about
232 million Tesla Model 3s @ 82 kWh each.
Big Numbers
These are very, very big numbers. Are they reasonable?
With 8,760 hours in a year, that 2021 energy storage variation peak to trough of
19 million MWh, is an average of 2,170 MW. That is about the output of a reasonably large fossil-fuelled power station. So that power looks quite reasonable in terms of what we have been used to.
Going back to 2020 and 2021 but without increasing wind or solar capacity, what do those cumulative shortage charts look like?
Chart 20B-2: actual cumulative energy 2020:
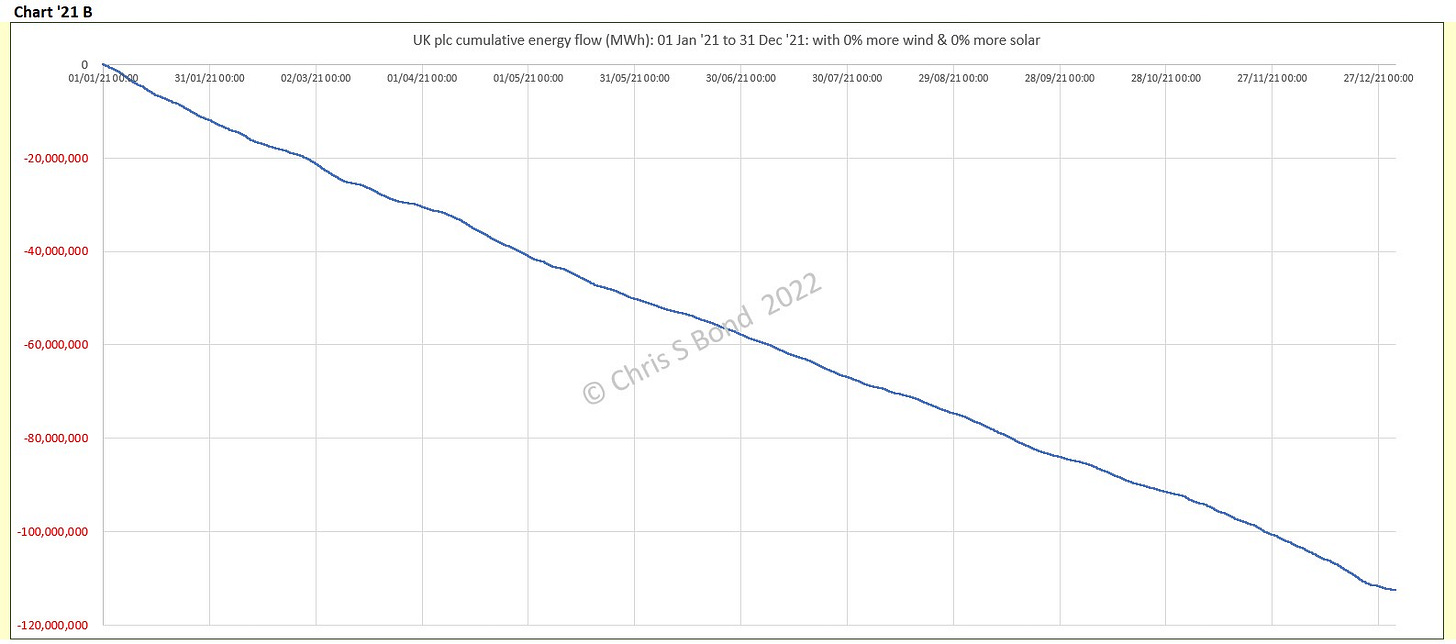
For 2020 the renewables shortage accumulates to 100 million MWh, i.e. 11,400 MW for 8,760 hours = 1 year. That is comparable with the average amount of fossil-fuelled generation that decarbonisation requires we replace. So that is looking reasonable.
Chart 21B-7: actual cumulative energy 2021:
For 2021 the renewables shortage accumulates to 112 million MWh, i.e. 12,800 MW for 8,760 hours = 1 year. Again, very credible.
What’s the Cost?
Battery energy storage at grid scale is not cheap, but it is probably the most cost-effective proven technology to date. Announcements of projects for battery energy storage systems rarely include total project values. However, an October 2021 article on the Mornington project in Victoria Australia for a 480 MWh battery energy storage system (BESS) states this is to be installed on Victoria’s Mornington Peninsula at a cost of “upwards of $190 million”. AUD 190 million is about GBP 100 million.
The 2021 UK energy storage requirement is 19 million MWh, which equals about 40,000 Mornington BESSs. Or close to £4,000 billion, roughly ten times what the UK spent on Covid-19 emergency measures.
I do not suggest for a moment that this combination of generation plus storage is the optimal economic solution. However, I think the numbers illuminate the scale of the problem.
Reducing Demand
Ah, people will say. But we are using energy more efficiently, so the problem will solve itself.
I doubt it. If we are going to replace gas heating with electrically driven heat pumps, we are going to increase electrical power demand. If we are going to ban fossil-fuelled vehicles and go fully electric, even allowing for the higher thermal efficiencies of electric vehicles, that still increases demand for electricity. UK power demand will increase.
Higher demand for batteries will likely increase their cost. This will counteract the economies of scale - we may already be seeing this in relation to EV batteries. Electrical storage at the scale I have outlined plus the cost of 2, 3 or more times the current wind generation fleet is, with luck, going to drive immense technological innovation rather than endless rent-seeking.
If government policy is to force large sectors of the population to stop using personal transport and make savings that way, then I think we need to have a full, frank, and factual debate. Such a massive lifestyle change requires a democratic mandate. In fact, the investments required to achieve Net Zero are so immense that democratic consent is already needed to continue this path. Otherwise, we may end up with fractures and polarisation across society of the kind we’ve seen over Brexit and Covid policy. Or possibly worse.






Thanks for your interesting & insightful analysis.
"If we are going to replace gas heating with electrically driven heat pumps, we are going to increase electrical power demand. If we are going to ban fossil-fuelled vehicles and go fully electric ...."
Whilst EVs' energy demands are relatively uniform throughout the year, space-heating demand is only over the heating season - *roughly* 6 months. So even if switching gas demand to electricity demand only doubles (non-gas generated) electricity demand over the year, it 'probably/possibly' quadruples (non-gas generated) electricity demand for the heating season which is *already* the time of peak electricity demand.
Space-heating demand is challenging to time-shift.
The *prime* advantage of the (heating) energy source that is expected to be shifted to electricity is that Britain has ~30,000,000MWh of natural gas storage, plus approx 4,000MWh of natural gas in Linepack. (The latter vs NetZero storage of energy in electricity cables.)
https://mip-prd-web.azurewebsites.net/DailySummaryReport
https://mip-prd-web.azurewebsites.net
What about integrating car battery storage into the grid as a buffer, and also reducing load peaks where this is possible - freezers etc.