Another 28 Days, and Conclusions
After some to and fro with David Osmond on X and LinkedIn as well as on Substack, I think I've figured out what he's doing...

Following several of my recent posts: But… What if I’m Wrong of 04 June; Follow-Up to But... What if I'm Wrong? of 10 June; and Another 28 Days Later of 18 June; a lot has become a lot clearer.
I’m bringing the strands together here in this post to explain what I’ve learned.1
First, to make explicitly clear: David uses the 7-day NEM data at ½-hour intervals as the basis of his work. On X each week he publishes what I refer to as “three-year average squiggle-woo” together with boiler-plate text he probably hasn’t materially changed in the last couple of years, and of course a reference to his Renew Economy article of Aug 23, 2023. The squiggle-woo charts are distractions. To understand what he’s doing, we need to focus on his ‘7 Days…’ and his ‘28 Days…’ charts.
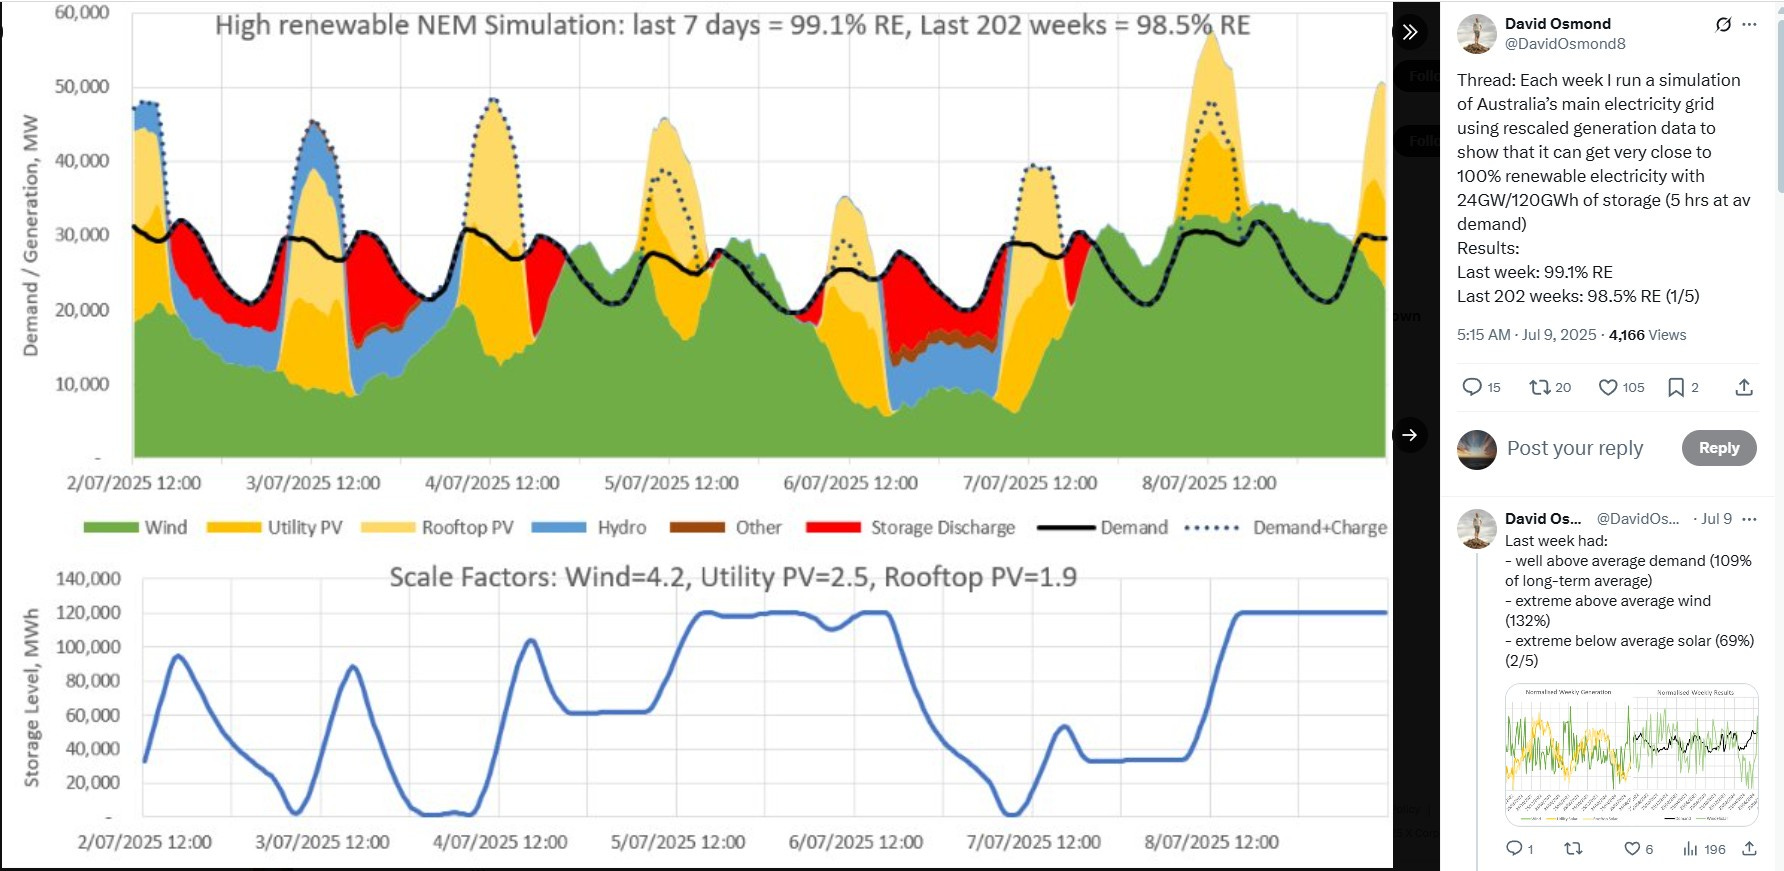
David’s latest “simulation” is for [week ending 09 July 2025] where he claims:
“Last 7 days = 99.1% RE, Last 202 weeks = 98.5% RE” … see Figure DO 1
[RE = renewable energy]
Figure DO 1 - 7 Days to Mid-09 July 2025: 99.1% RE
Running energy balances for the same 7 days of ½-hourly NEM data, I get 94.6% RE, see Figure CSB 1.
Figure CSB 1 - Same 7 Days to Mid-09 July 2025: 94.6% RE:
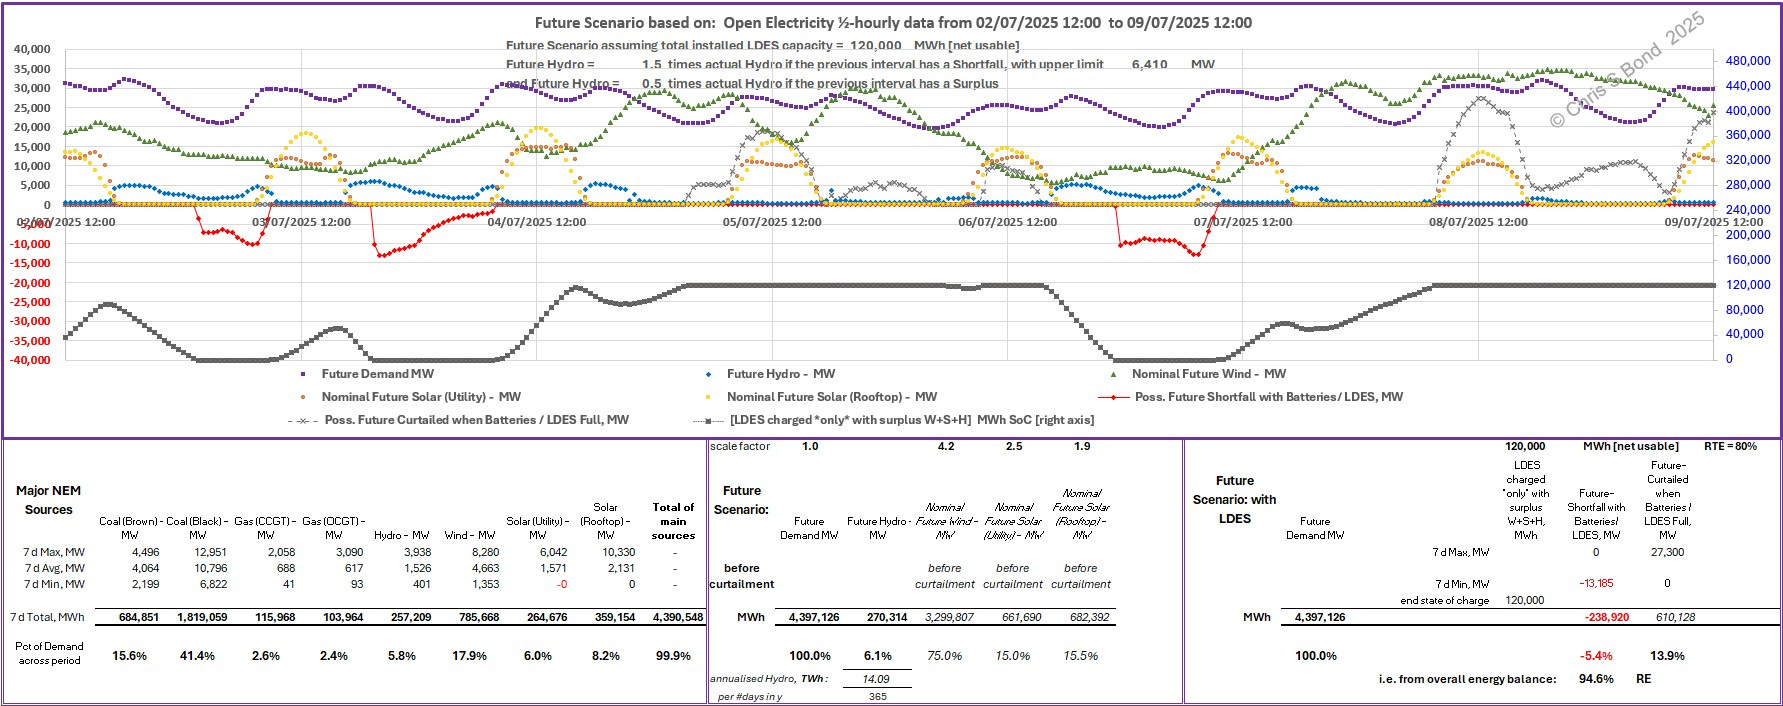
I’m using the same scale factors: Wind 4.2, Utility PV 2.5, Rooftop PV 1.9 2
But I get a significantly lower % RE.
Why?
Where is David getting all his extra ‘renewable’ energy from?
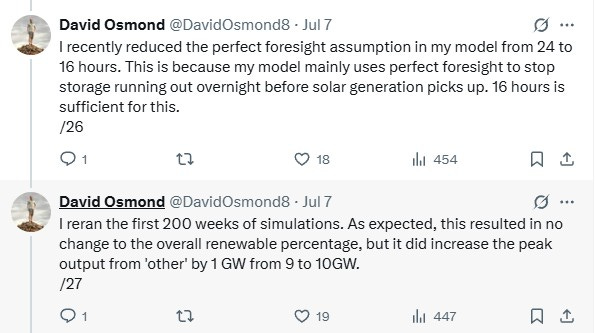
Perfect Foresight
David’s frequently-referenced Renew Economy article *does* include, way down at the bottom in FAQ 3, the following:
“Does your model assume perfect foresight? For the first 6 days of each 7-day simulation, my model assumes 24 hours perfect foresight. That is, it knows exactly what the wind, solar and demand will be 24 hours in advance. AEMO can reasonably accurately predict these quantities 24 hours in advance (and beyond), though not perfectly. For the last day of my 7-day simulation, the length of the perfect foresight linearly reduces to zero hours.”
And in his long X thread defending his “simulations” against Aidan Morrison, he included this:
Figure DO PF 1:
What does that means in real terms? Look at Figure DO 2. In the first three days, quite a bit of Hydro and ‘other’ fuel are being used at the same time as the Solar peaks. Then the same pattern of counter-intuitive use of Hydro and ‘other’ at the same time as the Solar peaks on a number of days including the several days beginning 26/06/2025. All to keep his energy storage charged up, to keep battery energy available for the following days when the “simulation” has perfect foresight of forthcoming periods of low Wind.
Figure DO 2: “Weeks 199-202, 28 day average = 92.7% RE”
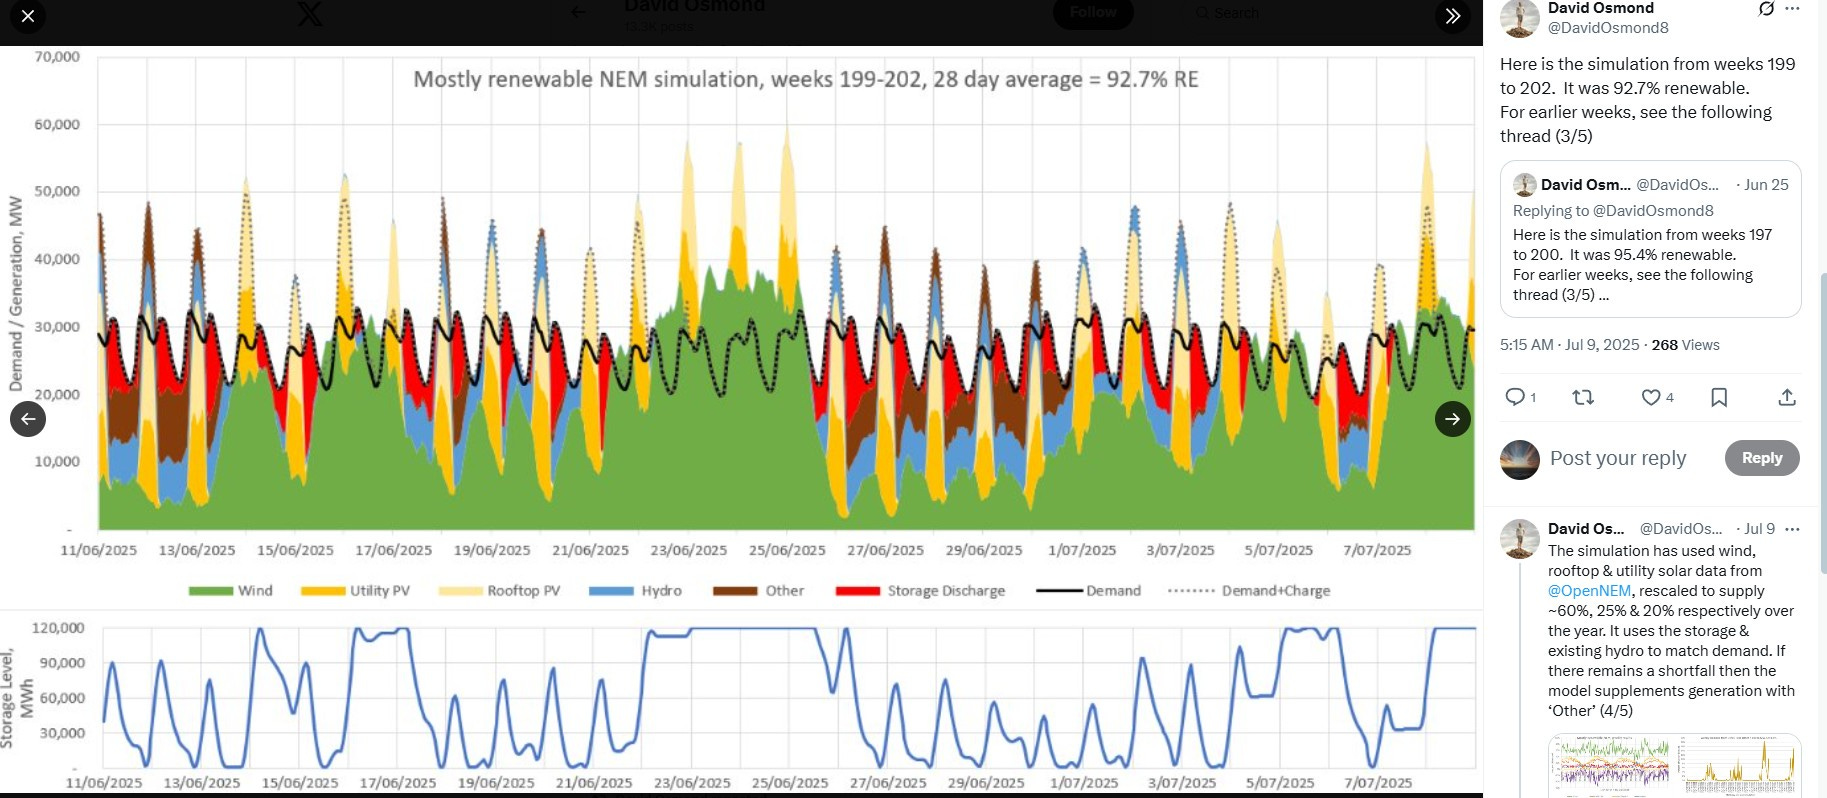
Compare with my analysis of the same 28 days shown in Figure CSB 2.
Figure CSB 2: Same 28 Days to Mid-09 July 2025: 87.6% RE
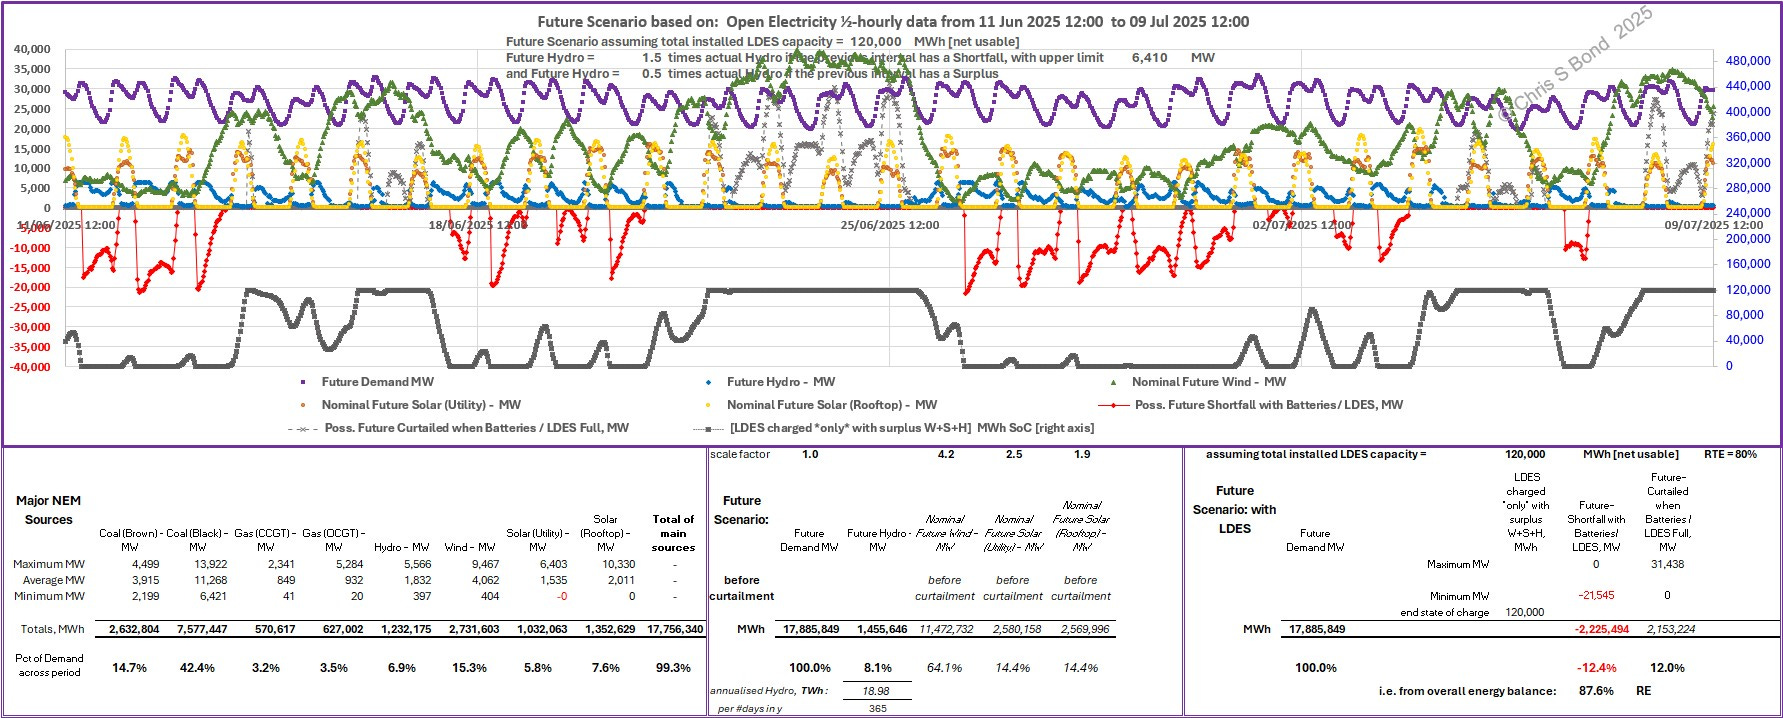
In my extrapolations I do NOT use any foresight. The adjustments to Hydro I make are in arrears, depending on whether the previous ½-hour interval has a RE Shortfall or [potential] surplus. Note how my energy storage (the black LDES chart along the bottom plotted against the right hand axis) goes completely flat much more frequently and for longer than David’s. And how I account for all the [potential] surplus energy that would have to be Curtailed to keep the NEM grid stable.
It all became clear after our interchange on LinkedIn, see Figure CSB PF 1.
Figure CSB PF 1: LinkedIn Exchange of Views
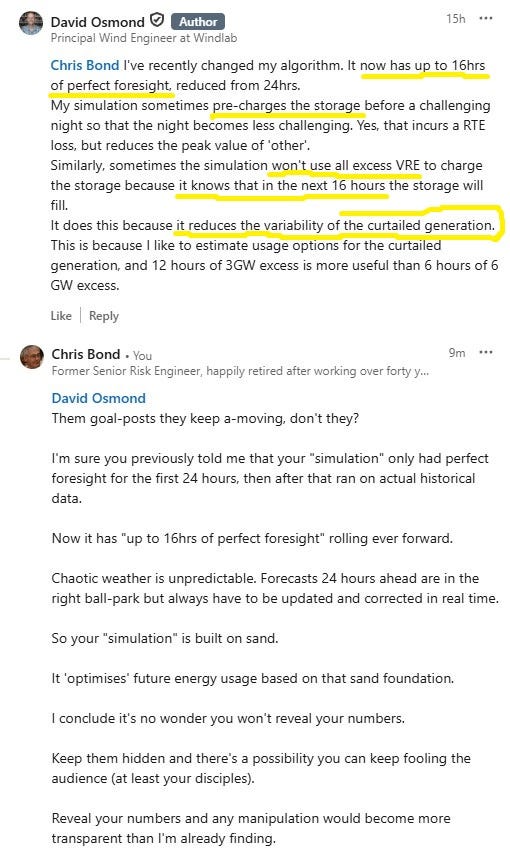
As you can see, I don’t think much of his use of ‘perfect foresight’ in his “simulation”. He mentions he uses it to reduce “the variability” of curtailment, but I am certain that it also reduces the quantity of curtailment. That in turn allows more RE to be useful i.e. to keep the lights on, and consequently boosts the %RE he can claim.
That’s where David is getting his extra ‘renewable’ energy from.
Note: the only ‘quantification’ of curtailment David offers each week’s set of X posts, is in the bar chart for all weeks of his “simulation”, i.e. utterly useless for cross-checking.
Half-Hourly Adjustments to Hydro [in Arrears]
Instead of David’s ‘perfect foresight’ approach, my energy balances vary Hydro ½-hour by ½-hour according to what happened in the previous ½-hour, as follows:
Future Hydro = 1.5 times actual Hydro if the previous ½-hour interval has a Shortfall, but with upper limit 6,410 MW3;
or Future Hydro = 0.5 times actual Hydro if the previous ½-hour interval interval has a Surplus.
Then if Supply > Demand in that interval, the energy storage can be charged, but once it is full any surplus must be curtailed to keep the grid in balance.
Figure CSB 2: ZERO Foresight, 28 Days to Mid-09 July 2025: 87.6% RE
You can see the results of my approach in repeated Figure CSB 2, above.
For the 28 days ending midday 09 July 2025:
- Future Hydro = 8.1% of Demand, annualised to 19 TWh per 365 days;
- [nominal] future Wind + [nominal] future Utility Solar + [nominal] future Rooftop Solar (i.e. all before Curtailment) = 64.1% + 14.4% + 14.4% = 92.9% which added to the 8.1 % from Hydro = 101% … isn’t it a rule of thumb that you need around 20% over-capacity of ‘renewable’ generation?
- Curtailment is 2.15 TWh i.e. 12.0 % of Demand, and
- Fossil-free ‘Renewable’ generation is over 2.2 TWh i.e. 12.4% Short of being able to satisfy Demand, hence RE = 87.6% over this 28 days.
All David’s “simulation” has to do is move approximately half of that Curtailment across into the useful RE column as if by magic and, hey presto! he gets his claimed 92.7% RE4
All it needs is perfect foresight for 16 hours into the future, every day…
Polish up your crystal balls, folks!
AEMO and Perfect Foresight [for Storage Devices]
After my “Another 28 Days Later” post I was sent a link to the Australian Energy Market Operator (AEMO) Draft ISP Methodology: “Addressing perfect foresight for storage devices in the time-sequential model” [pdf] Published: 1 April 2025
“The intention of this paper is to provide additional context and analysis for the topic of modelling imperfect foresight for storage devices.”5
“Current forecasting and planning models are optimised with perfect foresight of supply and demand conditions within each day and across the simulation horizon. This allows perfect energy management and ideal intra-day dispatch of storage technologies.6 Actual NEM dispatch is dynamic and battery operators make dispatch decisions with less certainty about market conditions in future periods of each day.7
The risk management involved in deciding whether to dispatch energy now or wait for a potential higher price later, may lead batteries to bid and be dispatched at lower discharge rates or not at all, even if the current price is above a reasonable price thresholds.8
To better represent the potential for suboptimal dispatch outcomes of storage devices across the modelling horizon and provide insight into the impact of imperfect foresight on the reliability and operability outcomes, particularly ahead of long winter periods of high residual demand, AEMO proposes to incorporate two alternative approaches into the time-sequential modelling that supports the ISP:
Headroom and footroom reservation – a small margin of energy at the upper and lower states of charge is reserved under most circumstances but remains accessible if required by the market. This reflects a proxy for operational risk mitigation strategies that preserve the option for storage devices to respond flexibly (either charging or discharging) to a future unforeseen event should it arise, and restricts storage devices from using its full capacity of stored energy on a daily basis.
Deliberate energy planning error – energy storages are modelled with an explicit target operating plan, formulated with alternative assumptions of generator outages, interconnector outages, availability of renewable energy, and demand conditions. In this approach, storage devices would plan their states of charge according to these alternative system conditions. As a result, when an unexpected period of energy scarcity occurs due to unpredictable events, operators will not have had the foresight to have stored energy levels in advance of the unpredictable circumstance.”
Congratulations, AEMO, you’re re-inventing Design Margins!
Copyright © 2025 Chris S Bond
Disclaimer: Opinions expressed are solely my own.
This material is not peer-reviewed.
I am against #GroupThink.
Your feedback via polite factual comments / reasoned arguments welcome.
This is mainly for those people who’ve asked me questions about my approach vs his and/or sent me copies of their own analyses of David Osmond’s “simulations” and/or who simply remain curious.
This ‘scale factors’ approach (I refer to it as ‘extrapolation’) is purely arithmetic. It doesn’t matter what type of widgets or gee-gaws are used, how high they are (if Wind) or what tilt mechanism they have (if Solar) or where any or all of it is located on a particular land-mass. Or whether it is practicable or cost-effective to install any or all of it, together with all the necessary grid reinforcement, inverters, synchronous inertia providers, and so on and so forth.
To the arithmetic, none of that matters.
It’s a thought experiment to see whether the concept of ever greater ‘renewables’ *capacity* could keep the lights on in an industrialised society.
As it’s only on spreadsheets and substacks and X posts, it’s a low-cost thought experiment.
Just go with it, and think.
In these respects, I agree with David Osmond.
Considering Australia is somewhat drought-prone it would be prudent to assume a reasonably Hydro-neutral strategy in future: i.e. use an ‘up-factor’ of 1.5 balanced with a ‘down-factor’ of 0.5; and limit the maximum Hydro generation to 6,140 MW i.e. the maximum recorded by the NEM in the last ~year.
I’m not claiming that some degree of foresight would never be used. Under benign weather conditions when the likely accuracy of predictions are high and likely consequences of getting it wrong are low, of course the clever modellers would be allowed to play. But as part of your power system design? No thank you.
For storage devices, not grids.
… but read the next sentence …
… which immediately contradicts the ‘perfect dispatch’ statement by saying the reality is less than perfect dispatch…
Seems to have been written by someone concerned only with battery operators’ profit margins.
I don't understand how foresight helps, because in Australia we have to anticipate worst-case scenarios like two or more successive nights during wind droughts. In Europe we can expect several weeks on occasion with with little or no wind.
The cost and land use of the storage required to ride through those periods is out of the question.
To make the challenge even more impossible, how will the storage ever be fully charged without enough conventional power installed to do it?
https://rafechampion.substack.com/p/grid-scale-electricity-storage-why
https://rafechampion.substack.com/p/are-we-taking-wind-droughts-seriously
You are correct about "Perfect Foresight". It is just smoke and mirrors.
David continues to ignore the need for dispatchable generation and Inertia. He has a long period every day where the Grid would collapse.
You can see more of my comments here:
https://wrjohn1.substack.com/p/reply-jul-12-2025-chris-b