

Battery Reality in Texas
I kept seeing claims that the Texas (TEX) power grid is being rescued from collapse by batteries, so I've investigated.

Once again I’ve used a set of data from the US Energy Information Administration (EIA). Following on from my post on Battery Reality, I wanted to use EIA data to see just how much batteries are contributing in one of the two major US states which has gone further than most in ‘decarbonising’ its power grid: Texas.
So just after the end of January 2025 I downloaded EIA file Region_TEX.xlsx
I have grown to realise that my previous analysis of the Texas power grid was deficient. Why? Because for convenience, I mostly used the inbuilt daily data worksheet. I only used short intervals of hourly data focussed on e.g. peak Demand.
But electricity grids fundamentally rely on closely sustaining the balance:
Supply = Demand 60/24/365
Hence using daily data omits the granular reality that in some hours of each day - at night, for example - ‘renewable’ sources might fail to keep the lights on.
This time I assembled 13 months of contiguous hourly data, beginning at 00:00 on 01 January 2024 and ending at midnight 31 January 2025. I chose to include two whole Januaries because it seems that even Texas experiences cold weather in that month and I wanted to see how the combinations of high Demand and low Solar were dealt with.
Here’s how it looks for a recent 2-week period.
Figure 1: EIA Top 5 Charts for TEX Hourly Data:
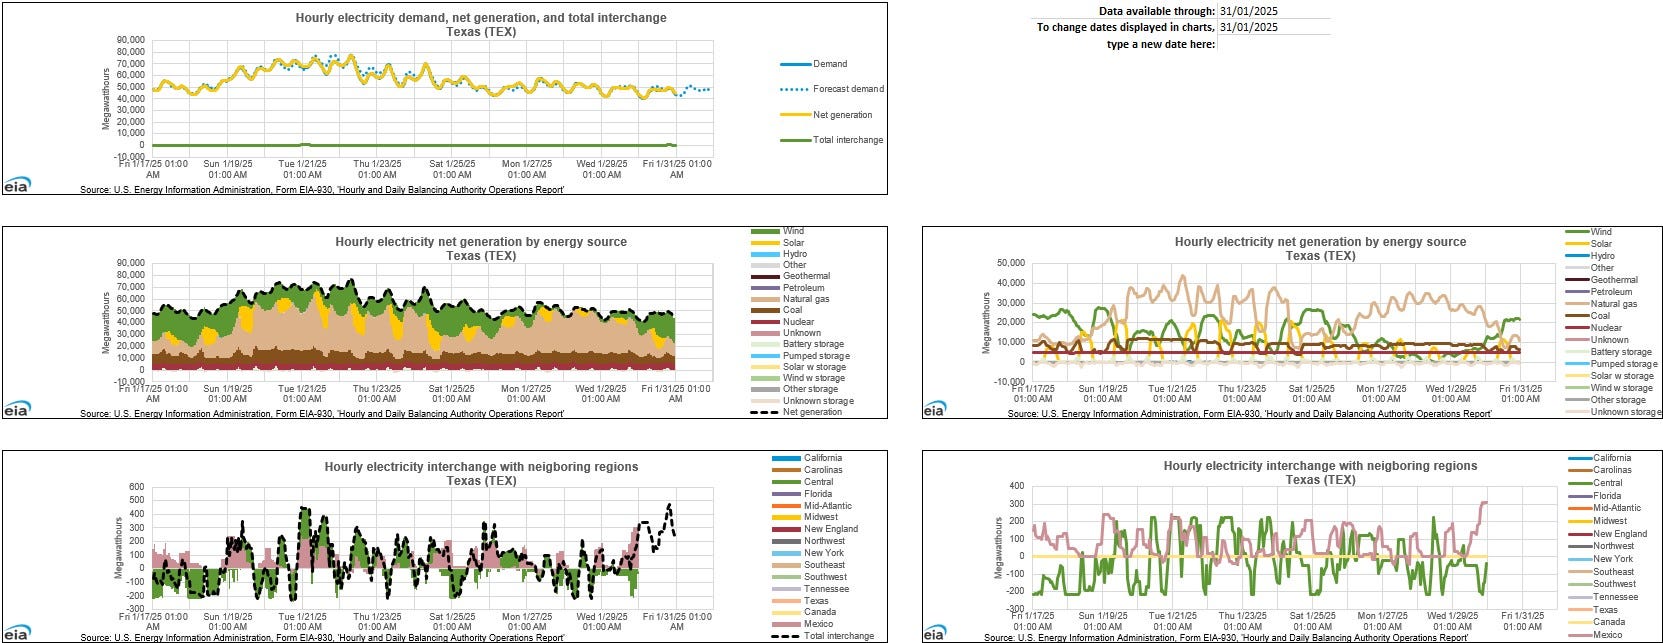
As I’d previously found, the EIA data-files are pre-populated with sets of charts on the ¦Hourly Charts¦ and ¦Daily Charts¦ workbook tabs. There are now more charts than before, and quite cleverly done. For instance: "Hourly CO2 emissions intensity for generated electricity” and “Hourly CO2 emissions intensity for consumed electricity” both plotted for the last two weeks. However, for this post I want to focus on batteries.
The two charts in the middle of Figure 1 include ‘Battery storage’ just below the mid-point of the list, but the default colour is very pale green. Any battery signal is completely lost among the other charts which have better contrast.
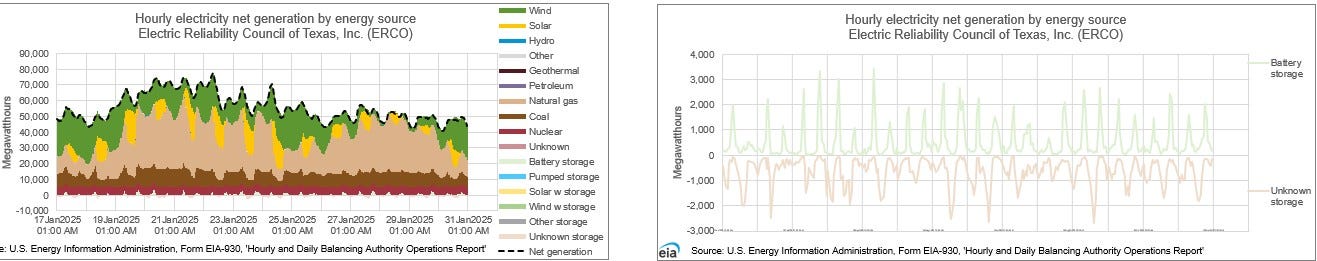
So I de-selected all but two: ‘Battery storage’, and what looks like battery charging but which is called “Unknown Storage”, see the right hand side of Figure 2.
Figure 2: EIA Chart for Recent 2 Weeks of TEX Hourly Battery Data:
Ok, good, I’ve found the battery data. Now to look at a longer time-span using the EIA ¦Daily Charts¦ workbook.
Figure 3: A Year of TEX Daily Battery Data:
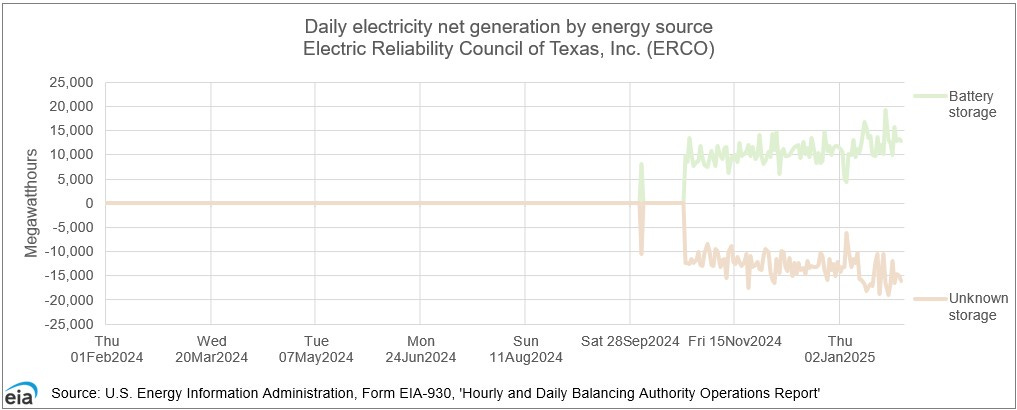
Ah, drat! Battery data only started 23 October 2024. Abandoning the idea of going back further, I focussed on the last 13 months of hourly data. To distinguish the smaller power flows from the larger ones I plotted on separate charts, see Figures 4.
Figures 4: 13 Months of TEX Hourly Power Flow Data:


I had to plot “Other / unknown storage” on the second vertical axis to separate the plotted points from those of “Batteries”. I plotted the minor energy flows separately from the major ones to give better visualisation. You can see the battery power flows are relatively tiny. But just to bring out more clearly the scale of the differences involved, I filtered all the results in descending order of magnitude, see Figure 5:
Figure 5: 13 Months of TEX Hourly Data - All Parameters:
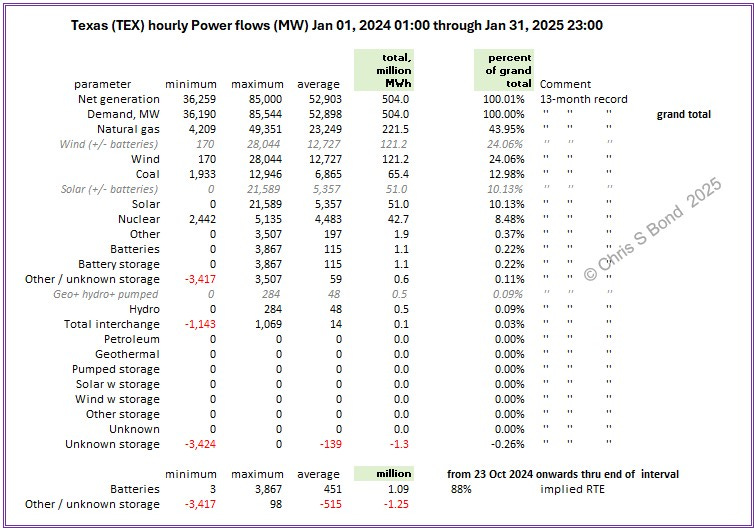
Currently, Net Generation is near as dammit equal to Demand; Total Interchange is minimal and anyway almost exactly balances out;
Wind provides ~24% of TEX power overall, but varies hugely from near-zero to over double its average;
Solar provides ~10% of TEX power overall, but also varies hugely from zero every night to nearly 22,000 MW (~22 GW);
Batteries from 23 October 2024 provided 1.09 million MW, but took -1.25 million MW to charge, implying an overall round trip efficiency (RTE) of ~88%.
In that 3+ months total Demand was 120.6 million MWh, so batteries provided 0.9% while drawing -1.03% of that interval’s Demand. Just on these overall numbers it looks like TEX needs one or two orders of magnitude more battery capacity to make much of a difference to the overall energy balance.
Also on these overall numbers:
Dirty dirty fossils (Gas + Coal) provided 43.95% + 12.98% = 56.93% of TEX power.
Wind + Solar provided 24.06% + 10.13% = 34.19%.
On these nominal overall numbers alone, it looks like Wind + Solar need to be increased by a factor of 2 or 3.
But this is where the granular data is so essential to gaining a true understanding: see below.
First, a battery capacity illustration.
Perhaps TEX will decide to use batteries to smooth its Solar generation to provide a steady flow of power instead of its current daily massive peak + nightly zero. What’s the problem with the massive Solar peak? Curtailment and diminishing returns. More ‘renewable’ generation will be curtailed more unless a huge breakthrough is made in cheap + plentiful energy storage. Currently we have battery systems or pumped hydro schemes for storing electrical energy, but not much else: see that Volta Foundation report in my Battery Reality post linked earlier.
Anyway, as an illustration, I’ve run the numbers in Figure 6 to see how much battery energy storage system (BESS) capacity TEX might require. Note this is solely to smooth Solar power from a recent day that included the peak Solar power indicated in the top left image in Figures 4.
Figure 6: BESS Needed to Smooth Power from recent Peak Solar Day:
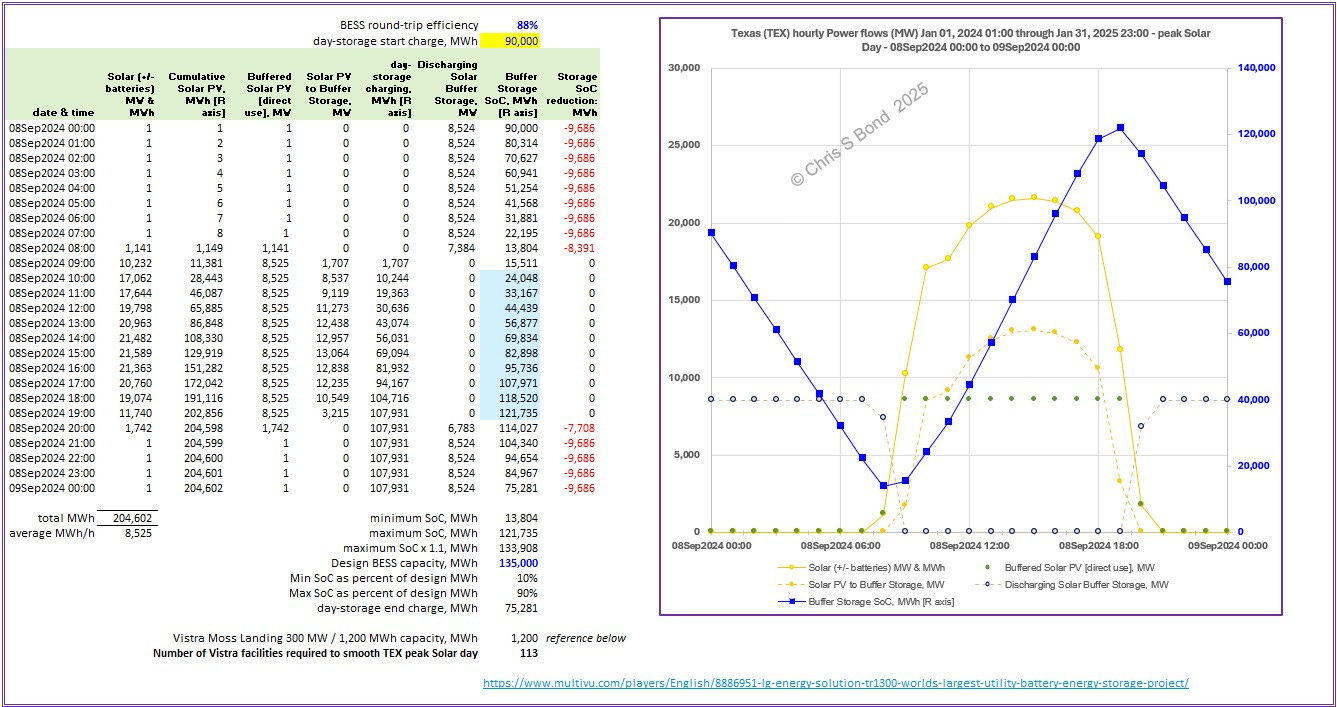
The maximum Solar power flow was 21,589 MWh/h, recorded in the hour 08 Sep 2024 15:00. I have plotted the chart of Solar on that day in Figure 6. You can see it’s slightly ‘notchy’ instead of being a smooth curve, but it’s sufficient for illustration.
The tabulation in the left part of Figure 6 shows my workings:
- the 1st column shows the date and time stamps from the EIA data-file;
- the 2nd column shows the hourly MWh as recorded in the EIA data-file;
at the bottom of the 2nd column is the total MWh and the average MWh/h;
- the 3rd column is a cross-check on the cumulative energy from Solar;
- the 4th column shows the Solar power available for ‘direct use’ i.e. not sent to / returned from the postulated BESS;
- the 5th column shows the surplus Solar power in excess of the day’s average that is instead diverted to the BESS;
- the 6th column shows some workings but is not directly used in the plots;
- the 7th column has logic operators to only show values of the discharging BESS when the direct Solar generation is lower than the day’s average;
- the 8th column shows the State of Charge (SoC) of the BESS which is plotted on the right axis; it has different logic operators depending on whether the BESS is discharging or charging. Of course, the BESS has to have an initial quantity of stored energy (assumed from the day before) otherwise for the first part of the day it would be a flat battery from which no energy could be received;
- the 9th column shows the reduction in BESS stored energy and includes the lost energy because of the round trip efficiency (RTE) of the BESS. I have used 88% for the RTE as this is the value implied by the EIA data (23 October onwards).
My adjustable variables are:
- the day storage start charge - which I set to 90,000 MWh to ensure the minimum SoC this day didn’t go below 10%; and
- the design BESS capacity - which I set to 135,000 MWh to ensure the maximum SoC this day didn’t go above 90%
Note that 135,000 MWh is 113 times the energy storage capacity of the recently-burned-down Vistra Moss Landing 300 MW / 1,200 MWh BESS.
WELL OVER ONE HUNDRED TIMES ONE OF THE WORLD’S LARGEST BATTERY SYSTEMS
Now, coming back to the granular hourly data and what it reveals.
Figure 7: Current Shortfalls of Fossil-Free Electricity in TEX:
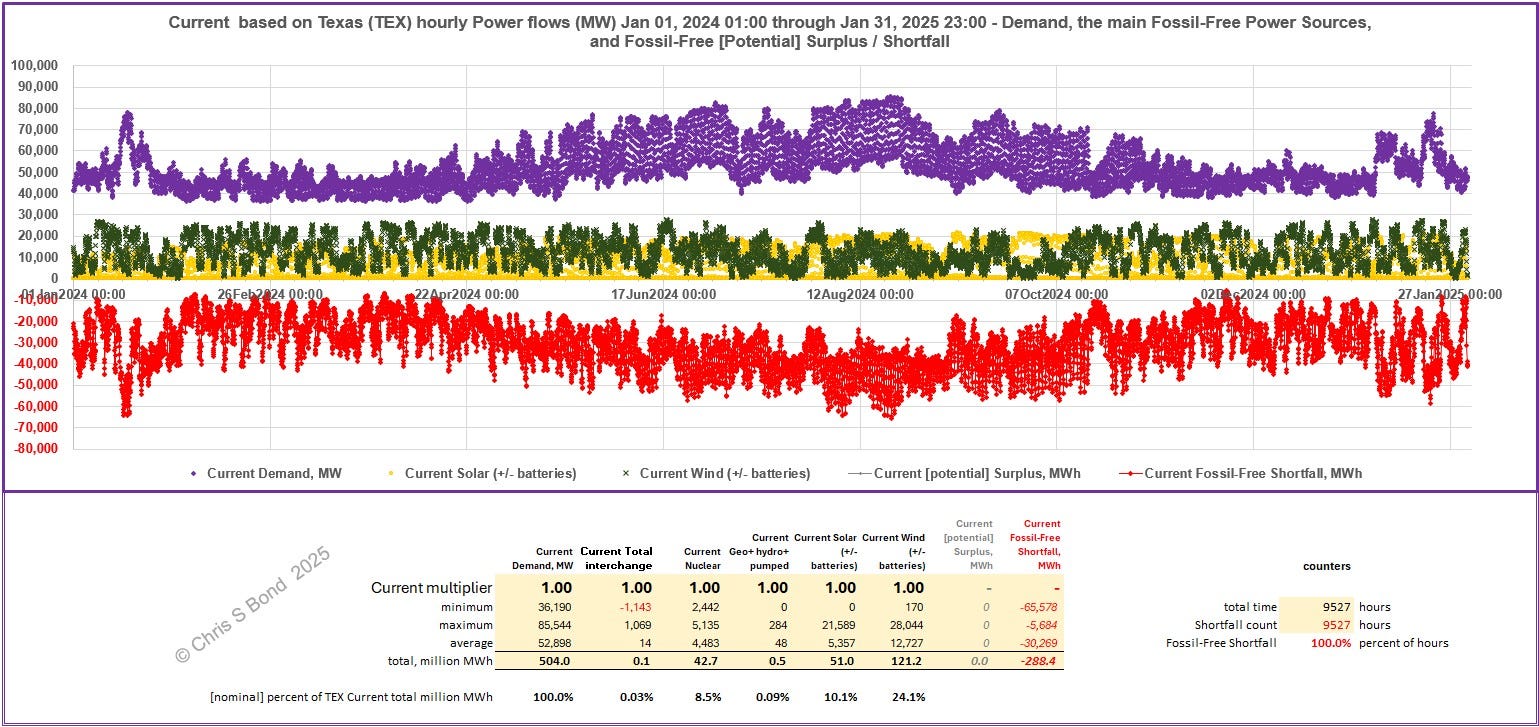
Plotting the hourly Shortfall of Fossil-Free power generation helps understanding, I hope you agree. Of course, on the EIA plots the large and very large power flows from Coal and Gas are very evident. We can intuit that ‘decarbonisation’ of the power system requires their replacement. But by combining the calculation into a single Shortfall result we can more readily see whether the grid stability requirement that Supply = Demand 60/24/365 can be satisfied. Figure 7 shows that’s not yet the case.
For my first extrapolation scenarios, I leave Demand, together with Nuclear and the minimal sources of TEX power, unchanged. What multiples of Wind and of Solar do you expect might drive the TEX power grid to a high % ‘decarbonised’ while requiring minimal ‘backup’ Fossil generation? I tested the multiples, see Figures 8.
Figures 8: Shortfalls in TEX Fossil-Free Power as Wind and Solar Vary:


Simply extrapolating from the real data from 01 Jan 2024 through 31 Jan 2025, we see with unchanged Demand (and also unchanged Nuclear, Interchange and minor contributors):
left image: TEX can achieve a Fossil-Free or ‘decarbonised’ power grid about 50% of the time with TWO TIMES current Solar *capacity*1 plus THREE TIMES current Wind *capacity*;
under this scenario around 90 Million MWh of [potential] surplus power would have to be curtailed to maintain grid stability; and around 85 Million MWh of dispatchable Fossil power would be required to keep the lights oncentre image: grid ‘decarbonisation’ around 80% of the time (i.e. Shortfall 20%) with THREE TIMES current Solar *capacity* plus FIVE TIMES current Wind *capacity*;
under this scenario nearly 330 Million MWh of [potential] surplus power would have to be curtailed to maintain grid stability; and around 30 Million MWh of dispatchable Fossil power would still be required to keep the lights onright image: the same data as in the centre image but showing only the [potential] surplus and Shortfall plots, for clarity
in the left and centre plots, Solar and Wind are labelled [nominal] as their peaks would need to be curtailed if there was insufficient Demand to satisfy in those time periods: Supply must near-exactly equal Demand at all times
What do we think future Demand will be in TEX? 25% higher? 50%? …? All those data-centres, remember. I’ll adjust the Wind and Solar multiplication factors so as to achieve 80% ‘decarbonisation’ (i.e. Shortfall 20%) for illustration.
Figures 9: Shortfalls in TEX Fossil-Free Power with Higher Demand:


In Figures 9:
left image: Demand multiplier 1.25; grid ‘decarbonisation’ around 80% of the time (i.e. Shortfall 20%) with FOUR TIMES current Solar *capacity* plus SIX point FIVE TIMES current Wind *capacity*;
under this scenario nearly 440 Million MWh of [potential] surplus power would have to be curtailed to maintain grid stability; and around 35 Million MWh of dispatchable Fossil power would still be required to keep the lights onright image: Demand multiplier 1.5; grid ‘decarbonisation’ around 80% of the time (i.e. Shortfall 20%) with FOUR point SIX TIMES current Solar *capacity* plus EIGHT TIMES current Wind *capacity*;
under this scenario about 535 Million MWh of [potential] surplus power would have to be curtailed to maintain grid stability; and around 43 Million MWh of dispatchable Fossil power would still be required to keep the lights on
And unlike in my previous TEX post, I’m not going to attempt to see how much battery storage capacity in MWh would be needed to capture a significant portion of that curtailed [potential] surplus power. Not while battery technology is so inadequate for the task / so expensive.
Good luck, Texas!
If you insist on carrying on ‘decarbonising’ your power grid, you’ll need all the luck you can get: just look at the granular data.
Also, batteries currently make only a trivial difference in your energy balance.
Copyright © 2025 Chris S Bond
Disclaimer: Opinions expressed are solely my own.
This material is not peer-reviewed.
I am against #GroupThink.
Your feedback via polite factual comments / reasoned arguments welcome.
I use the convention *capacity* when I refer to Wind and Solar to emphasise that whatever their nominal design peak generation capability, their output on a given day is in the gift of the weather gods, in addition to which Solar’s output on every given night is zero.
The current landscape of grid-scale energy storage presents a fascinating study in technological capabilities and limitations, particularly when examining the interplay between storage solutions and renewable energy sources. Examining operational battery projects in China and Australia reveals a consistent pattern of approximately two-hour storage capacity, though projections suggest this will expand to four to six hours by 2030, marking a significant evolution in storage capabilities.
This development holds particular promise for solar energy integration into power grids. Solar power's relatively predictable intermittency pattern allows for strategic deployment of storage assets, potentially transforming it into a more reliable baseload power source. The mathematical precision of solar cycles enables sophisticated planning and optimization of storage systems.
Wind energy, however, presents a more complex challenge. Its erratic nature is exemplified by the disproportionate relationship between wind speed and power output – a mere 2 mph increase from 10 to 12 mph can result in a dramatic 30 percent shift in energy production. This volatility demands more sophisticated storage solutions than current short-duration batteries can provide.
The solution to wind's intermittency likely lies in emerging long-duration storage technologies. Iron air batteries and thermal storage systems represent particularly promising avenues. The latter holds special significance given that approximately half of all energy demand manifests as heat. Thermal batteries could serve these markets directly, bypassing the inherent inefficiencies of heat-to-electricity conversion processes.
Nevertheless, it's crucial to acknowledge that thermal battery technology remains in its pilot phase. While the theoretical advantages are compelling, practical implementation at scale awaits further technological maturation and real-world validation.
At time of writing this email the UK wind is 10% of demand and we are importing the same percentage from France. It seems in the media that you can only say how much cheaper renewables are, (the dubious statement) that it will make us energy secure or if we have more wind turbines or solar cells then everything will be fine. (And of course that means lots of green jobs.) The information you provide on various posts and in particular the cost of batteries which shows the numbers we would need is never challenged or acknowledged anywhere. On a cold winter's evening, with an anticyclone over most of Europe where does our electrical energy come from?