Something’s been bugging me, and today I think I’ve solved it.
In my Eastern Australia Progress post I referenced David Osmond’s Renew Economy article. Although I’m apparently using the same NEM data as David, I get results that are significantly less supportive of his narrative.
I think he’s wrong.
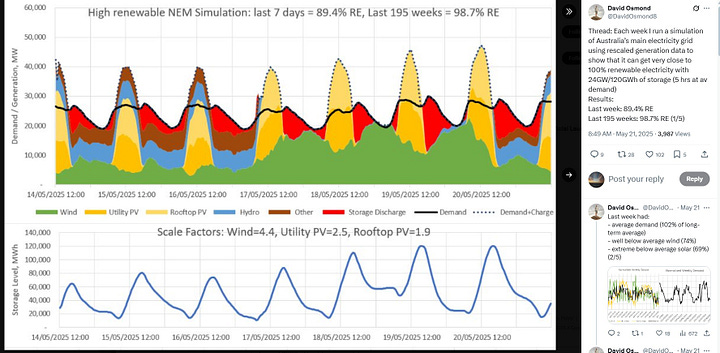
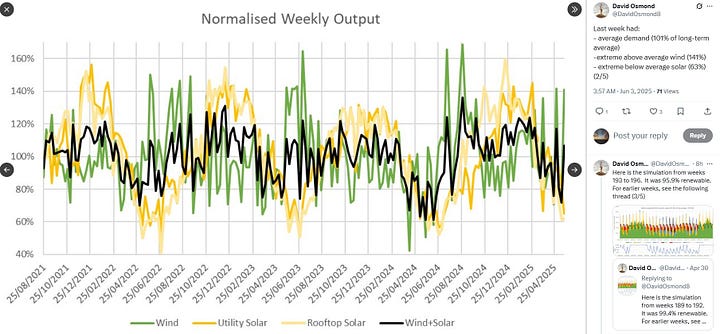
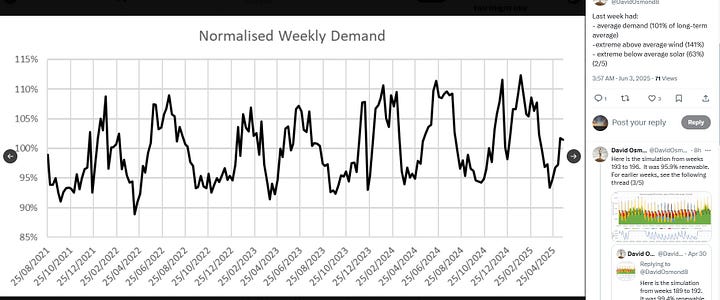
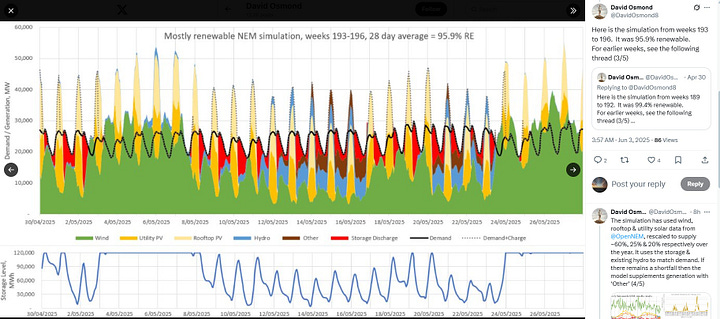
Today, while adding to my nearly-year of granular NEM data, I took a look at three of David’s recent X posts [week ending 21 May 2025], [week ending 28 May 2025] and [week ending 04 Jun 2025]. His posts make bold assertions as to how ‘easy’ it will be to run the NEM on mostly Wind plus Solar generation, together with collections of his charts. Figures 1A, 1B and 1C show screen-grabs I took from them.
Figures 1A: David O posts on X - NEM week ending 21 May 2025:
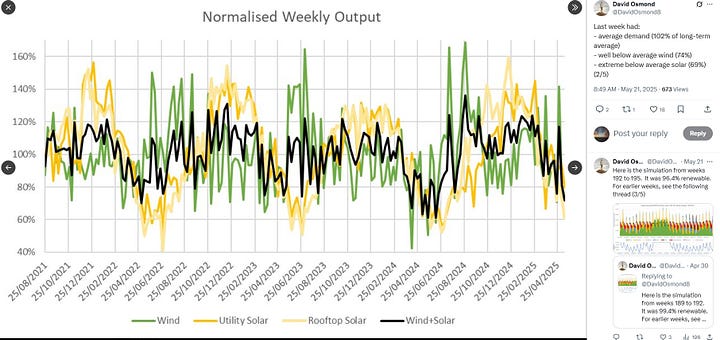

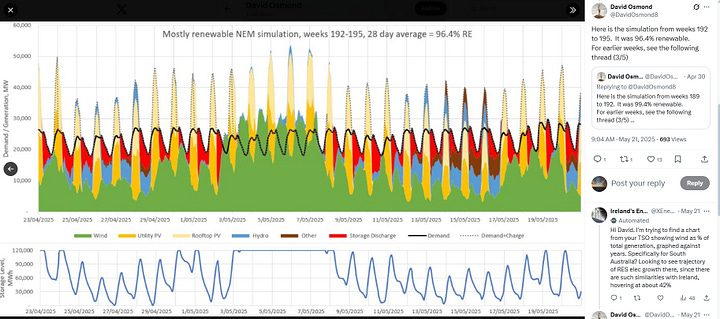
Figures 1B: David O posts on X - NEM week ending 28 May 2025:
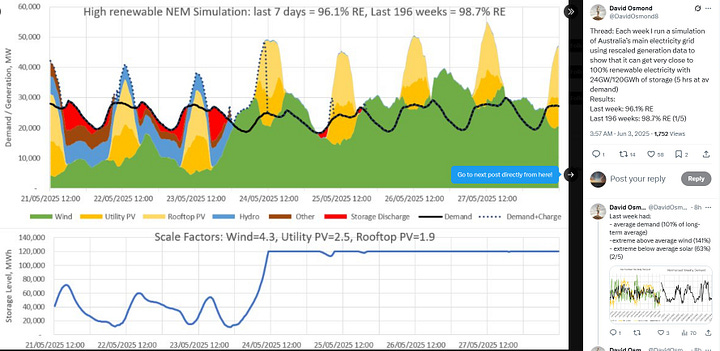
Figures 1B: David O posts on X - NEM week ending 04 June 2025:
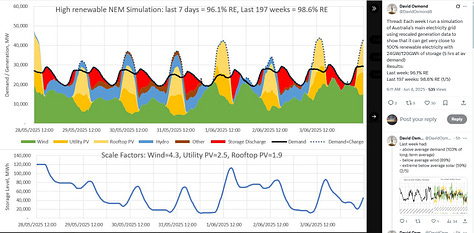

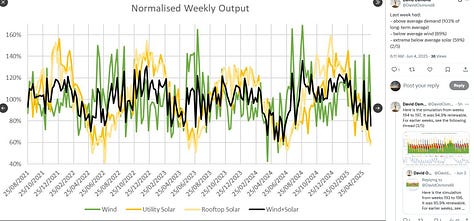
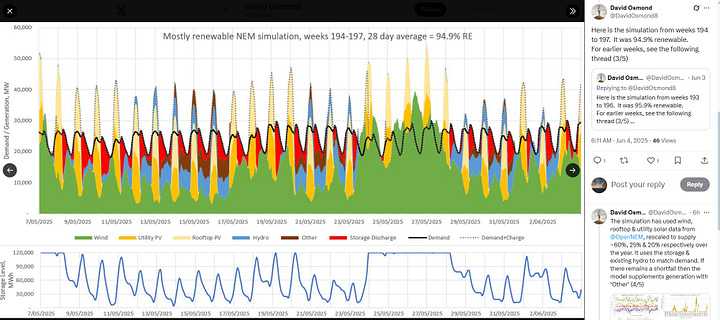
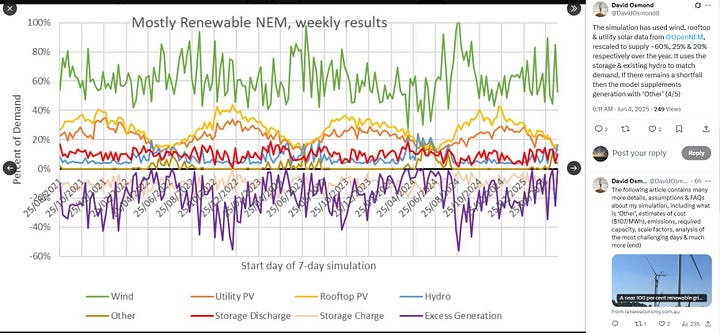
“RE” = renewable energy in his simulations comprise 89.4%, 96.1% and 96.1% of NEM energy requirement respectively in each of those weeks.
But how does he get there from the same NEM data I’m analysing?
Of what relevance are his “Normalised” weekly outputs and “Normalised” weekly Demands? Is he averaging and then drawing conclusions from averages??
Ah. In his Renew Economy article, Figure 4 “Normalised Weekly Output” caption text reads: “Normalised weekly output from wind and solar. Generation for each week has been normalised by the 3-year average, so that a value of 100% implies generation matched the 3-year average.”
And then his article Figure 7: “Worst relative performance over various timescales” with a minimum timescale of 1 day. Yes, he’s averaging.
Yes gods, David, an electrical grid has to be balanced, Supply = Demand, every minute of every day of every year! Or else you get a Spanish experience.
He also states in his X posts: “The simulation has used wind, rooftop & utility solar data from OpenNEM, rescaled to supply ~60%, 25% & 20% respectively over the year. It uses the storage & existing hydro to match demand. If there remains a shortfall then the model supplements generation with ‘Other’”
What if he’s wrong?
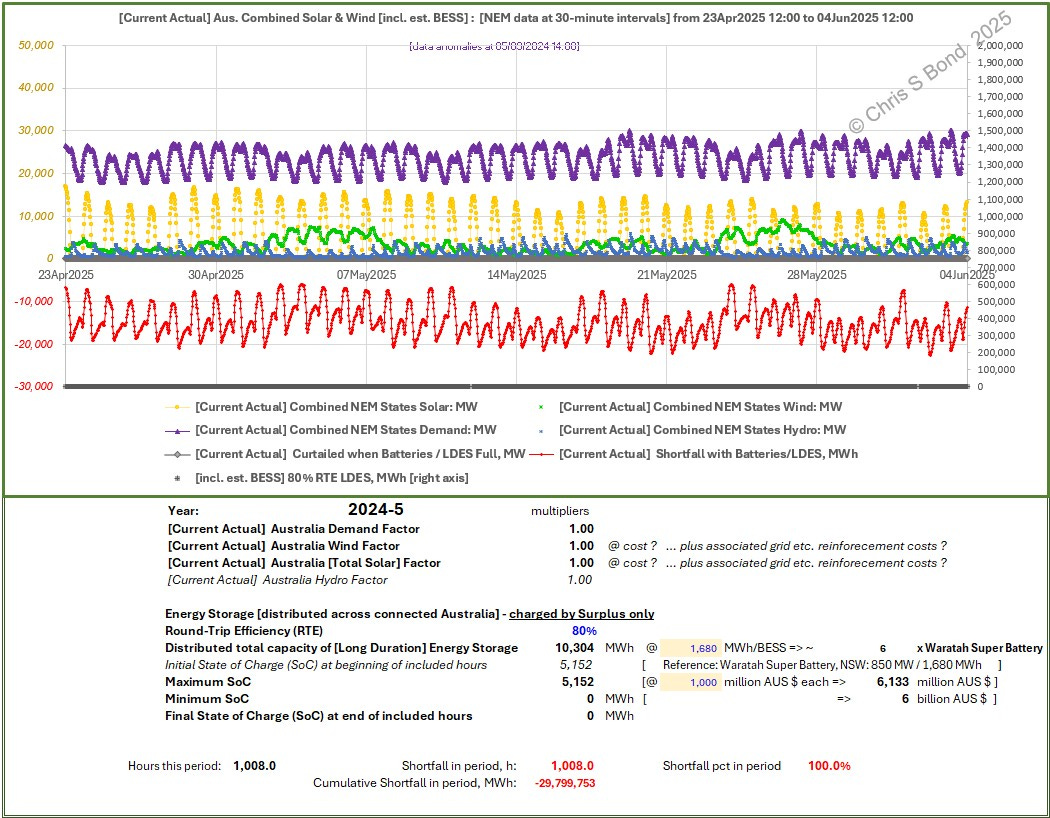
It so happens that I have downloaded NEM data at 30-minute intervals for the last nearly a year. This includes data at 30-minute intervals for that same period from 23Apr2025 12:00 to 04June2025 12:00.
In Figure 2A I plot:
- the calculated in-State Demand (purple) = the sum of generated powers;
- recorded Solar (Rooftop plus Utility) (orange/yellow);
- recorded Wind (green);
- recorded Hydro (blue); and
- the calculated [fossil-free] Shortfalls (red).
Figure 2A: the Current Situation on the NEM:
So far, so good. Excellent agreement between the Demand charts. The same timing of the Wind highs and lows. And of course the Solar surges are in phase. We’re working from the same basic data.
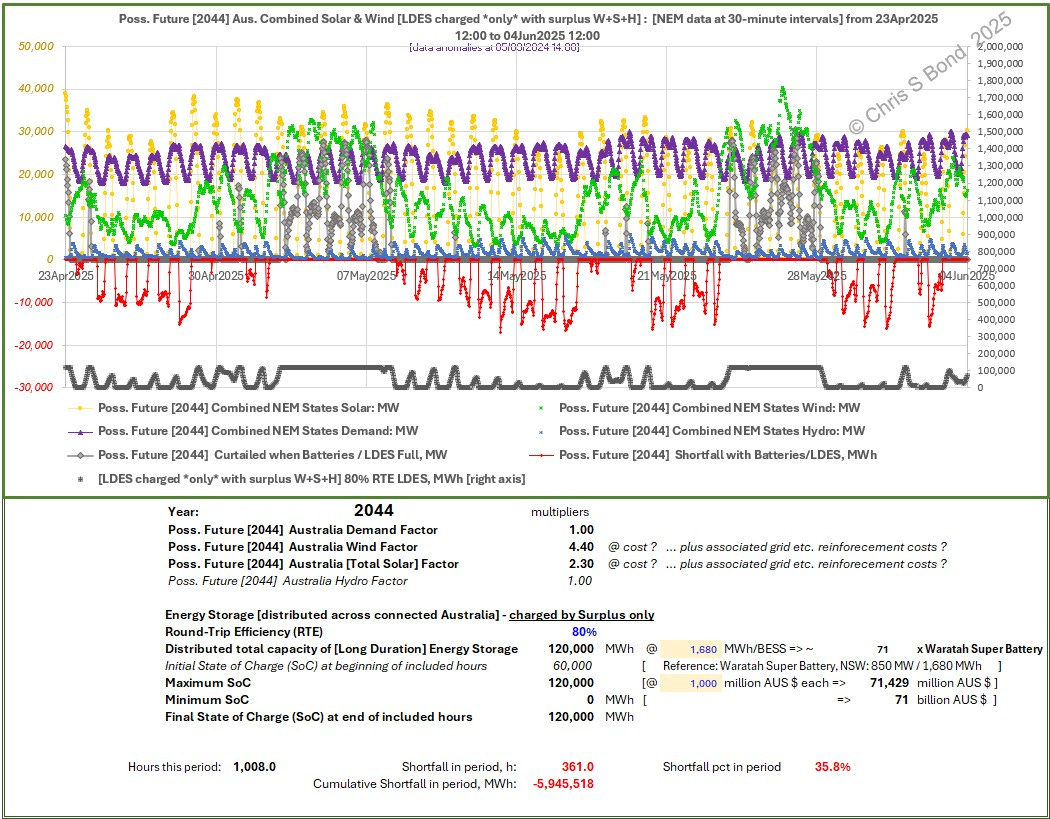
But what happens when I apply David’s published scale factors: 4.4 [4.3] on Wind, 2.3-ish on [total] Solar? All with his 120,000 MWh of electrical storage. See Figure 2B.
Figure 2B: a Possible Future NEM:
Across that same 6 weeks the lights would be flickering or out 35.8% = over one third of the time. Unless nearly 6 million MWh of reliable dispatchable [fossil] electricity was generated to fill in all the many, deep gaps.
And that’s without planning for a future increase in Demand as Aus electrifies *everything*.
What if I’m wrong?
That’s what I constantly ask myself, so I sense-check my results.
My Demand is 20,000 MW [round numbers] every night, same as David’s.
My Wind in Figure 2a drops sometimes and for quite long intervals to around [round numbers] 2,000 to 3,000 MW - same as David’s - while my Solar dops to zero every night - I assume same as David’s.
My Hydro, which I’m assured is unlikely to be significantly expanded in drought-prone Australia, whiffles along at between 0 and ~ 5,000 MW, up and down every day as regular as the sun. Difficult to tell from the way David presents his charts whether that’s the same for his simulation.
So, just eye-balling the data in Figure 2A:
Is 4.4 times 3,000 MW + zero + 0-5,000 going to be greater or less than 20,000 MW every night?
Yep, I think my Figure 2B looks about right.
We agree on the shape of the chart of state of charge of future LDES, but my extrapolation has it frequently going completely flat. Because on my half-hourly numbers there are far more frequent Shortfalls: for over one third of the time [35.8%] over this period.
That means RE = 64%

Renweable energy sources work great until you really need them. and then they are not there. Usiing averages gives falso answers. In my opinion you are not wrong!
Re hydro and demand profile:
At the moment hydro runs 24/7 however, as wind and solar increase, low hydro periods will increase. For example in the last week hydro has varied between 700 and 5,000 MW. With roughly 4 X wind and solar there would have been about 80 hours where hydro could have been near zero during the day even with no coal and gas. At night there were times where 4 X wind would have supplied 90% of demand. From the middle of August 2024 to the middle of March 2025 there was not one week where 4X wind and solar would not have supplied more energy than the NEM used
As there is currently 10.3 GW of hydro on the NEM with about 5GW of pumped hydro approved and potential for upgrading existing hydro by at least 1 GW and possibly up to 3 GW, it is not unlikely that on low wind nights, hydro could peak at 10-12 GW without using any more water over the year.
Then there is demand profile.
About 20% of nighttime demand is from "offpeak" rates designed to keep coal plants going, often at below cost rates. Much of that demand will switch to "solar soaker" or dynamic rates designed to soak up excess wind and solar. That would mean the 20 GW nightime demand will probably fall despite increasing electrification.
Finally, electrification of everything will require much less electricity than people imagine. France is a highly electrified economy by Western standards and has a lot of wasteful electric resistance heating and yet uses 6.2 MWh/ person. Australia uses about 9.2 MWh/person down from a peak of about 11 MWh