

Eastern Australia Progress
Fascinating, watching from afar as this ½-continent-wide experiment unfolds

Fundamental Principle of Electricity Grids
Generation = Demand *every* minute of *every* hour of *every* day
That’s it.
Generation is Supply; Demand is Consumption; they must instantaneously balance.
If a grid does not stick to this Fundamental Principle its frequency goes higher or lower, either of which is *very* bad for that grid.
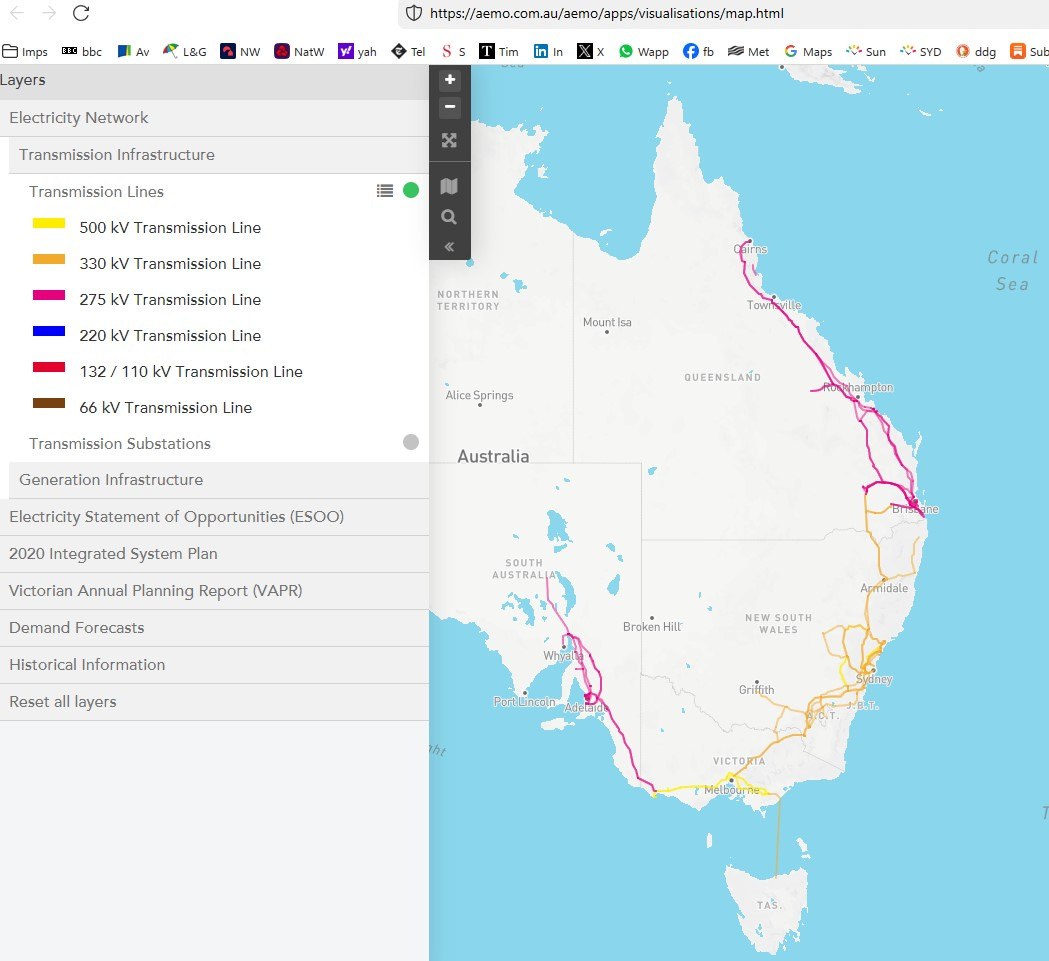
Australia’s National Energy Market (NEM)
The National Energy Market (NEM) operates in New South Wales, Queensland, South Australia, Victoria and Tasmania, plus the Australian Capital Territory (ACT). The Australian Energy Market Operator (AEMO) is the operator of the NEM, whose role is to manage the electricity and gas systems and markets across [eastern] Australia.
Western Australia and the Northern Territory are not connected to the NEM, primarily due to the distance between networks. The Wholesale Electricity Market (WEM) supplies electricity to the south-west of Western Australia via the South West Interconnected System (SWIS).
Figure 0: The AEMO = NEM Grid:
Introduction
I was somewhat dissatisfied with my Rest-of-Australia Reality and Rest-of-Australia - Future posts because of the gaps in their data. Since then I’ve been pointed to the Victoria Energy Policy Centre (V-NEM) website1, which (once one has registered) has good-resolution (5-minute and 30-minute) data going back to 1 January 2012. Excellent!
Except… the interconnector power flows in V-NEM are separate from the State power flows, and use a convention for Import versus Export power that can be the same or opposite to the convention used by Open Electricity. Plus there are a few other differences. All of which requires great care when stitching together data from the two sources.
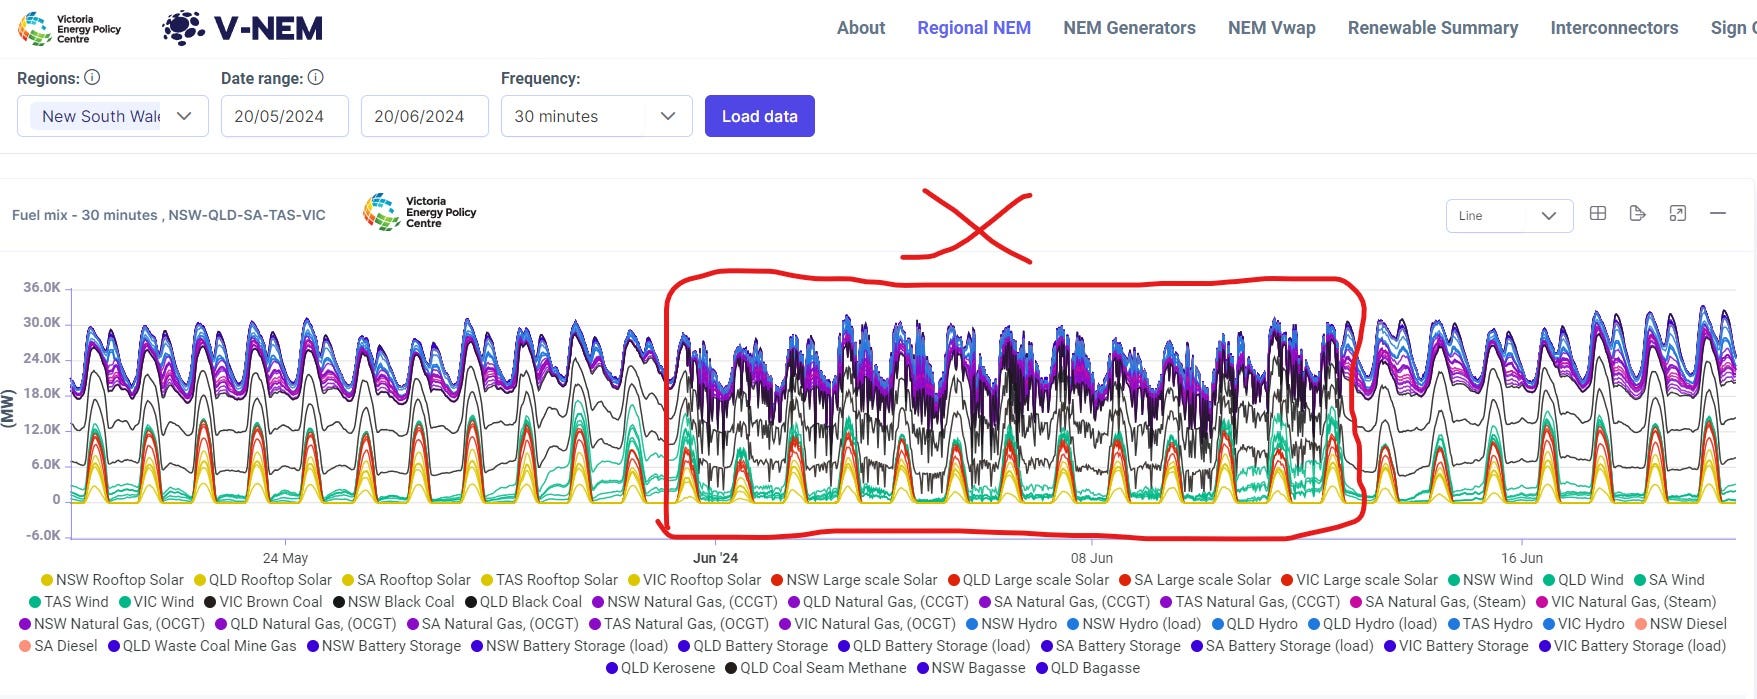
On top of all that, the V-NEM data suffered a severe case of the jitters between the end of May and around 00.00 on 13 June 2024, see Figure 1.
Figure 1: V-NEM All States Data Jitters:
Thus for this post I reconstructed 30-minute-interval data for the five grid-connected States back to 13 June 2024 00:00, but no earlier. I also filled in the gaps in the Open Electricity data visible in the earlier two posts. This means I include here just over 4,600 continuous hours (just over half a year) of grid-connected Australia power flow data. The data series begins in the depths (such as they are) of an Aussie winter, and goes through to the beginnings of some hot weather in mid-late December.
The developing pictures can be seen in Figures 2.
Figures 2: Half a Year in the NEM Region:


New South Wales (NSW) continues to set the range of the power MW scale of the charts, changed in this post to ±16,000 MW. This is necessary to accommodate the developing higher peaks in NSW as hotter weather arrives. I deliberately set the power MW scale of the other grid-connected States to be the same, so a reader can immediately sense the relative importance of the States’ Generation and Demands.
A feature of the NEM data is that Demand is not stated. Remembering Supply must equal Demand every second of every minute of every day in order to keep the grid stable and to keep the connected grids balanced, each in-State Demand is inherently equal to the sum of all sources of generation plus imports minus exports, across every ½-hour interval. The scale of ‘decarbonisation’ of a grid is made much clearer when Demand (in purple) is explicitly plotted against the generation sources you hope will replace dirty dirty fossils. I also simplified the NEM data by adding together each interval’s Utility and Rooftop Solar to derive a single [total Solar] value.
These parameters, together with the recorded Wind MW, are plotted in Figures 2. As can be seen in the three major States, there are currently large Shortfalls in ‘renewable’ generation versus Demand. There is only the briefest of intervals in NSW when ‘renewables’ satisfied Demand… at 12:30 and 13:00 on 08 November. There were none in Victoria or Queensland.
We can see that South Australia enjoys many intervals of Surplus ‘renewables’ generation while maintaining control of its grid by exporting to NSW and Victoria, or importing from either or both when it itself is in Shortfall - pretty much *every night*. Similarly for the Tasmania sector of the NEM grid, except with its fleet of hydro generation it is not so day/night dependent. But we can also see how relatively small South Australia’s and Tasmania’s power flows are.
In Australia, the time of me writing this is probably the ideal time of the year for Solar fans: 21st December is the longest day down under. The problem is this: on an ideally sunny day, to maintain grid stability, whatever extra Solar generation might potentially be produced cannot be allowed to show up on the grid. Instead it has to be Constrained / Curtailed - see Figure 3 for recent evidence of this happening.
Figure 3: Utility Solar Stomped On - Example, NSW, 12 Dec 2024:
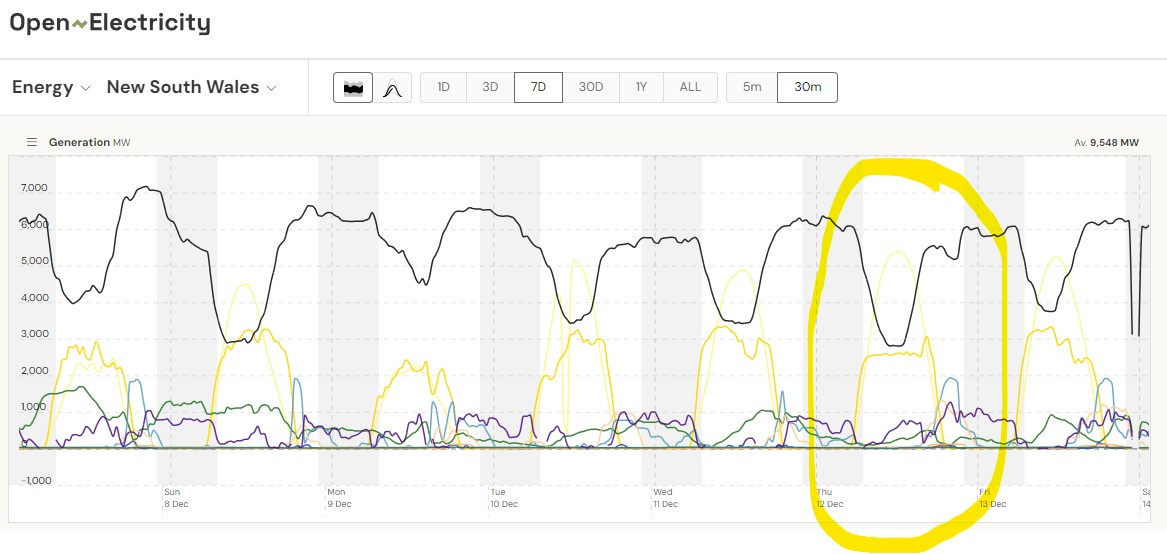
Open Electricity’s choice of pale yellow for Rooftop Solar makes it less visible than the darker yellow of Utility Solar. But zoom in and you should see Rooftop Solar soars in a smooth arc to a peak of over 5,000 MW, while the Utility Solar chart was constrained to a plateau of around 2,800 MW.
Now if only there was a reliable dispatchable additional Demand which could capture all that constrained power… I know, batteries!
Figure 4: Peak Combined Solar (to date) in the Grid-Connected States:
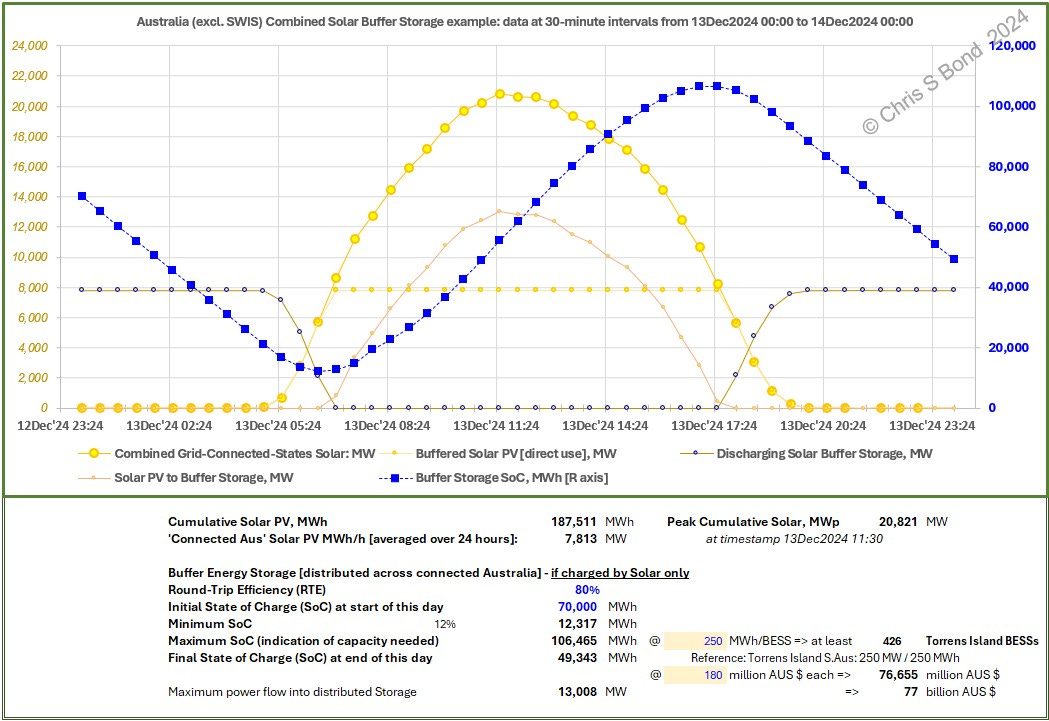
Peak combined (i.e. Rooftop + Utility) Solar power production to date was nearly 21,000 MW at 11:30 on 13 December. Potentially it was higher, but because Rooftop Solar is given priority whereas Utility Solar gets stomped on when there’s too much sunshine… Anyway, as I illustrate in Figure 4, if grid-connected Australia wished to smooth out that Solar surge to instead benefit from a constant ~7,800 MW power flow derived from its Solar facilities… it would need battery storage capacity of at least
106,000 MWh, or equal to around 426 Torrens Island BESSs of 250 MWh each.
Something like AUS$ 77 Billion at Torrens Island Project pricing.
Oooh, that’s a bit much… how about pumped hydro schemes instead?
Well, Snowy 2.0’s machinery will have a total power rating of 2,200 MW. It’s the same whether it’s pumping water up the hill to store energy, or allowing water to flow down the hill to generate energy, because the same massive machinery is used for both rôles. That maximum Solar power flow into storage of 13,000 MW (bottom line of Figure 3)? That would require about 6 times Snowy 2.0 at AUS$ 12 billion each. That comes to a very similar AUS$ 72 Billion. Plus likely greater distances / costs of grid reinforcement to convey the power to & from those specific pumped hydro sites which can only be built where there are suitable geographical features.
There’s no simple answer leaping out at me just to moderate the Solar surge.
Future Australia based on ½-year Real Data
In order to ‘decarbonise’ Australia’s power production, all fossil sources of electricity need to be replaced by ‘renewable’ sources.
I use simple multiplier factors for increasing the power sources broadly as suggested in David Osmond’s Renew Economy article. I do this State by State (because the good-resolution real data from Open Electricity is only available State by State). I then add up the Demands and the Sources across the combined grid-connected NEM States assuming there would have to be commensurate very large interconnecting grid reinforcements to facilitate the arithmetic results (large and very large MW power flows from wherever there is a Surplus to wherever there is a Shortfall.)
I allow for Australia’s power Demand to rise over the next two decades to avoid the kind of energy-starvation de-industrialisation we have experienced in the UK. In addition, I have applied some super-multipliers to run alternative scenarios, see later charts.
Figure 5: 2044: 2xD; 9.4xW; 5.6xS; 3xH; 242,468 MWh LDES:
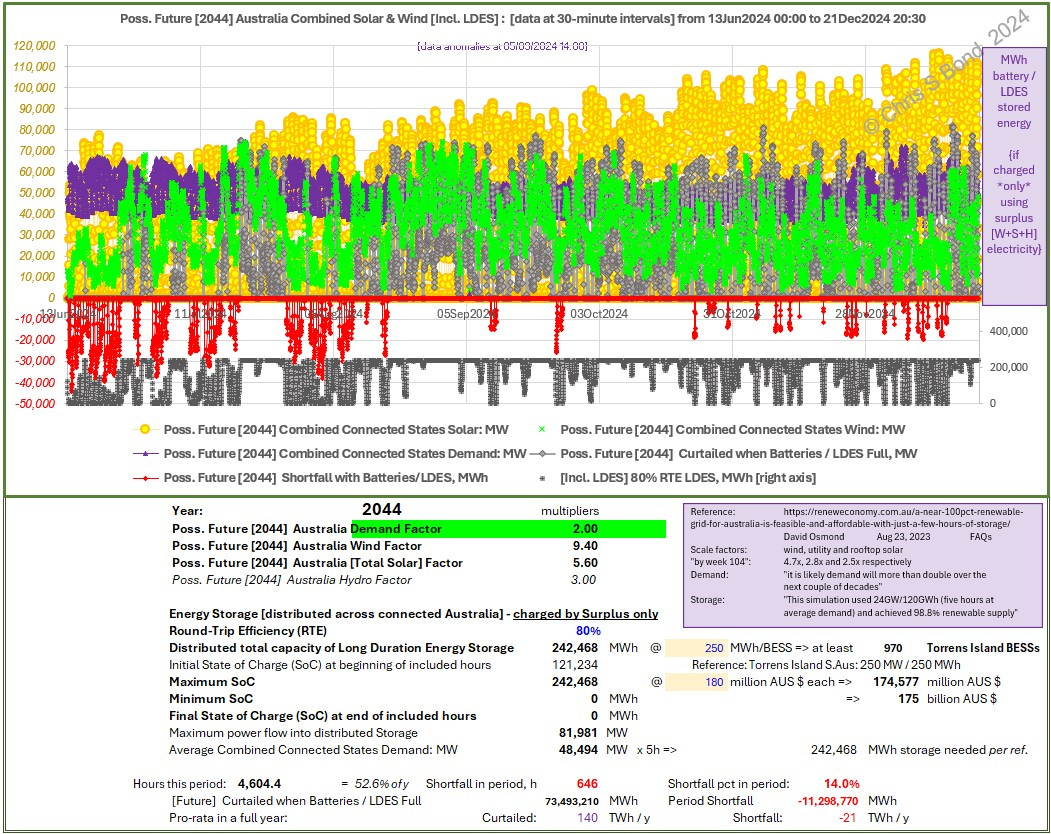
Allowing for 2 times the current Demand (2xD) to allow for everything to be electrified while (hopefully) not de-industrialising Australia, there are Shortfalls of ‘renewable’ power production for 14.0% of the 4,604 hours included.
This with the design - by 2044, only 20 years away - for:
- nearly TEN TIMES current Wind *capacity* (9.4xW);
- over FIVE TIMES current [total Solar] *capacity* (5.6xS);
- THREE TIMES current Hydro *capacity* (3.0xH);
- plus 5 hours of energy storage at the average of the connected States Demand
= 5h x 48,494 MW = 242,468 MWh
at a maximum power flow into energy storage of nearly 82,000 MW
[~40 times Snowy 2.0 power capacity]
i.e. nearly 1,000 Torrens Island BESSs, AUS$ 175 Billion.
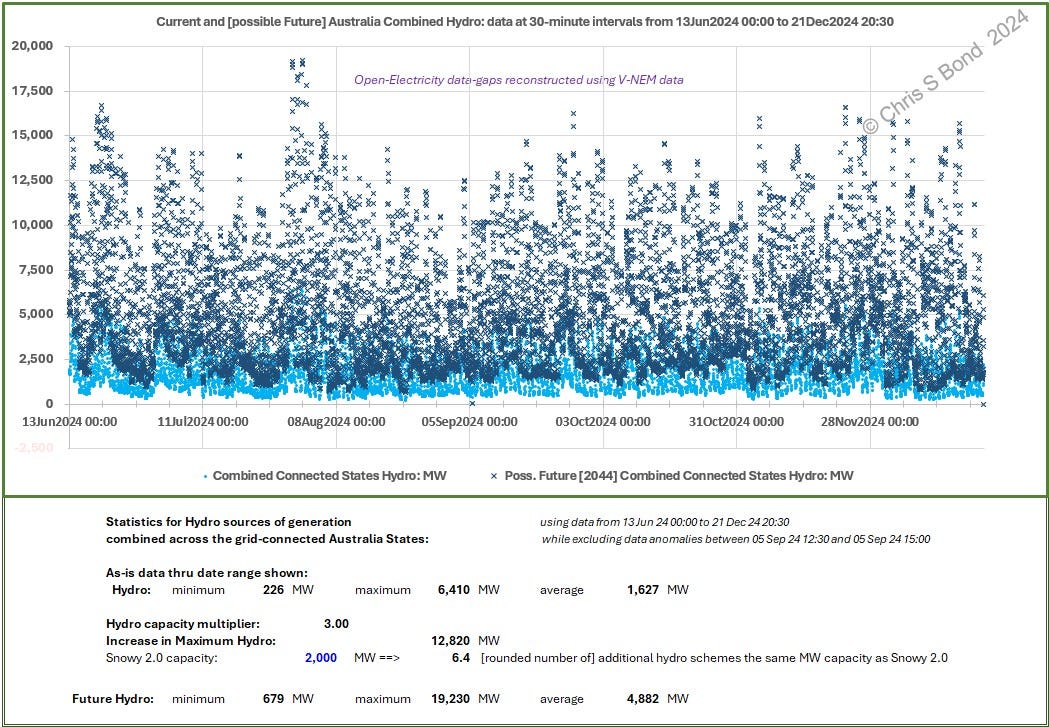
Included: Hydro generation increased by a factor of 3: see Figure 6. How practicable this is? I don’t know and don’t care, it’s up to Aussies to figure out.
Figure 6: 2044: 3xH:
What if Australia remains less ambitious, lives with no increase in Supply = Demand over the next two decades, doesn’t plan to electrify everything, doesn’t plan to displace fossil energy from non-power uses? See Figure 7.
Figure 7: 2044: 1xD; 4.7xW; 2.8xS; 3xH; 127,263 MWh LDES:
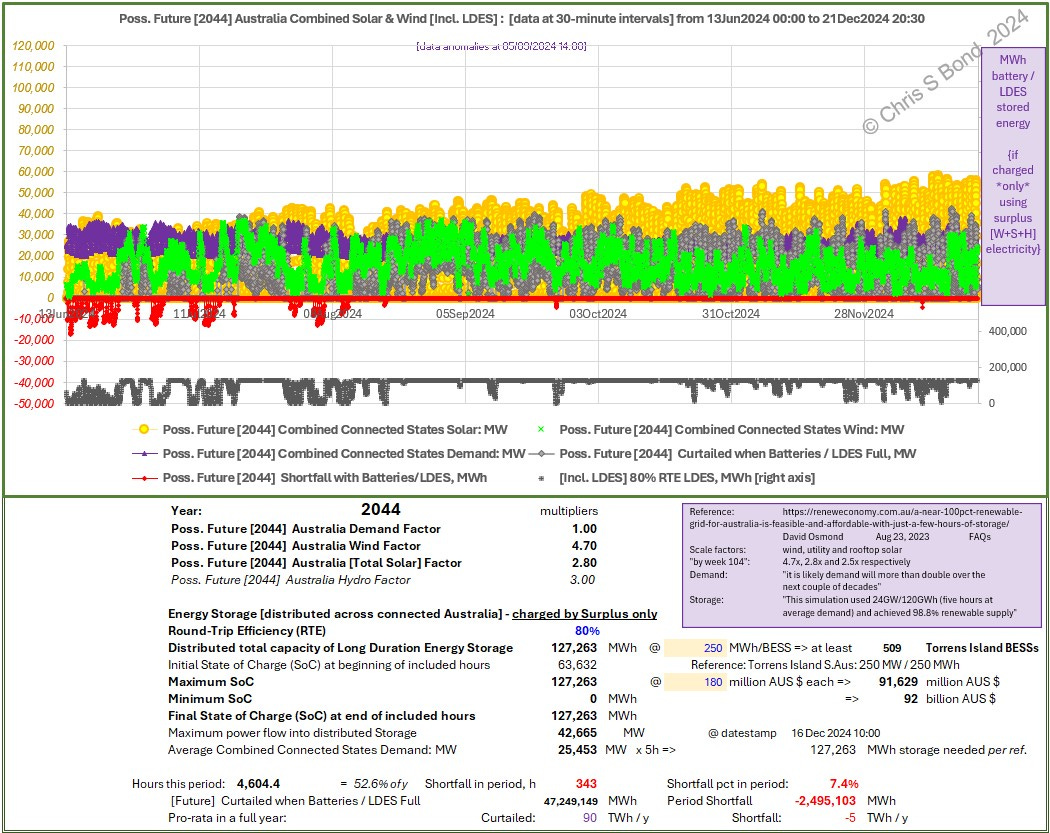
Running a scenario with unchanged Demand each interval but with the increased Wind and Solar *capacities*, one gets Shortfalls of ‘renewable’ power production for 7.4% of the 4,604 hours included.
This again with the design - by 2044, only 20 years away - for:
- nearly FIVE TIMES current Wind *capacity* (4.7xW);
- nearly THREE TIMES current [total Solar] *capacity* (2.8xS);
- THREE TIMES current Hydro *capacity* (3.0xH);
- plus 5 hours of energy storage at the average of the connected States Demand
= 5h x 25,453 MW = 127,263 MWh
at a maximum power flow into energy storage of ~42,660 MW
[~20 times Snowy 2.0 power capacity]
i.e. just over 500 Torrens Island BESSs, AUS$ 92 Billion.
Do-able? DKDC. It’s just what the numbers tell me.
What if the NEM didn’t bother capturing large amounts of excess ‘renewable’ generation? After all, there’s been no huge breakthrough in long duration energy storage (LDES) over the last two decades despite the need being obvious. Let’s look at the scenario where the NEM plans for Demand to double, but only installs one tenth of the energy storage advocated by Mr. Osmond. See Figure 8
Figure 8: 2044: 2xD; 9.4xW; 5.6xS; 3xH; 24,247 MWh LDES:
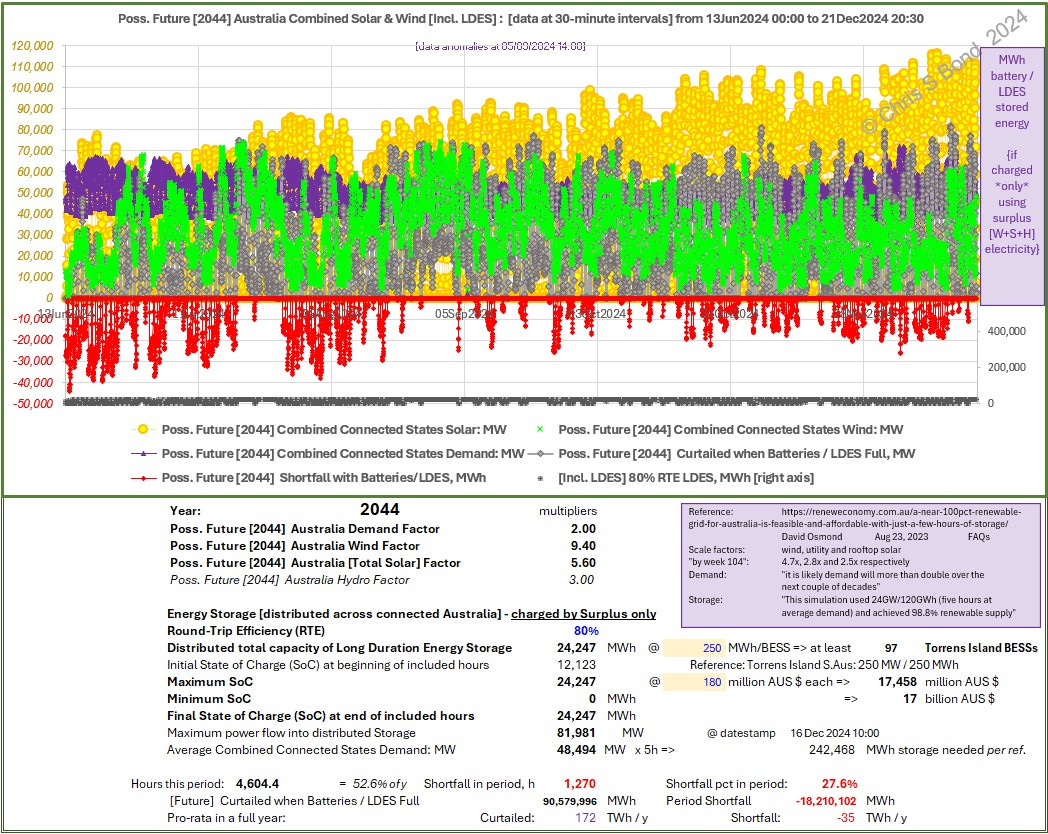
All the multipliers are as included beneath Figure 5, except I used 0.1 super-multiplier on LDES capacity. Unsurprisingly the Shortfall gets a lot worse, 27.6% of the time equivalent to 35 TWh per year of ‘backup’ dispatchable power generation is needed. All the while 172 TWh of curtailment has to take place to maintain NEM grid frequency stability, regardless of how much grid inter-connectivity has been installed in the meantime.
But there, over AUS$ 150 Billion shaved off the cost of batteries… you can thank me later, Australia.
But, what about HYDROGEN? Instead of batteries or pumped hydro, couldn’t Australia build lots and lots of electrolysers and become a ‘green energy superpower’ on the back of all that curtailment?
I’ve written about a couple of real ‘green’ hydrogen production facilities. [Oh look, almost exactly a year ago.] The Kuqa Facility in China has continued to struggle to produce much hydrogen as reported by Hydrogen Insight [paywalled] on 2 September 2024: “World’s largest green hydrogen project in China only produced about 35% of expected output in first year of operation” … “Sinopec’s 260MW Kuqa facility in the Xinjiang region only produced 'more than 7,000 tonnes' in its first 12 months, compared to the 20,000 tonnes it is aiming for” …
I don’t have a subscription so I don’t know whether solely ‘green’ energy has been used to produce that 7kt, or whether some abundant Chinese coal power found its way into the plant. I suspect the latter, because the Sinopec Refinery appears to have put itself into the vulnerable position of shutting its reformer down before the ‘green’ hydrogen supply was proven. Silly thing to do, shut down a reliable fossil plant before the ‘green’ alternative is proven… There’s a lesson there, maybe, for anyone willing to learn.
Anyhow, what if Australia’s NEM region built electrolyser plants to produce hydrogen instead of battery storage facilities? Yes, hydrogen has global warming potential, but yes, it appears Aus has geology conducive to salt dome H2 storage development… albeit in the northwest of Western Australia, i.e. about as far from the NEM as it’s possible to be… details, details.
Then, using Kuqa as the reference project, with maximum power flow into distributed storage in 2044 = 81,981 MW, we need 81,981 MW / 250 MW
= 328 times Kuqa facilities based on 250 MW power capacity each.
That’s not going to be cheap, either.
Figures 9: Individual 2044 Charts:


Figures 9 show the same data as in Figure 5, just plotted individually so you can see the magnitudes of the power flows that would have to be enabled (by massive grid reinforcements throughout the NEM [at what cost?]).
Remembering, this is with the design - by 2044, only 20 years away - for:
- nearly TEN TIMES current Wind *capacity* (9.4xW) [at what cost?];
- over FIVE TIMES current [total Solar] *capacity* (5.6xS) [at what cost?];
- THREE TIMES current Hydro *capacity* (3.0xH) [at what cost?];
- plus 5 hours of energy storage at the average of the connected States Demand
= 5h x 48,494 MW = 242,468 MWh
at a maximum power flow into energy storage of nearly 82,000 MW
[~40 times Snowy 2.0 power capacity]
i.e. nearly 1,000 Torrens Island BESSs, AUS$ 175 Billion [based on that recent project cost].
Conclusions
My perspective is that of a UK-based Chemical Engineer who can crunch numbers. I have no skin in the Australia power game, but I have watched with some despair as low-numeracy decision-makers in the UK have driven industry from our shores. UK power generation policy reliant on intermittent Wind and zero-every-24-hours Solar is, purely on the data, doomed to fail.
UK energy policy appears to have been developed in the near-religious belief that the technology necessary to make it work (cheap energy storage at massive scale) will soon be developed. But physics and the Laws of Thermodynamics have got in the way. Not that that has stopped HMGov from dynamiting fossil-fuelled power plants as soon as they are shut down; the recent wide-area lull across Northern Europe notwithstanding.
From afar, I see something similar developing in Australia. Simply extrapolating from the recent real numbers, I don’t get the sense that the plan is going to come together as is being claimed.
Energy policy is hugely consequential for a society, therefore I believe it needs to be ‘Red Teamed’ to ensure that all aspects are considered and the best overall solution is arrived at.
Australia: don’t be like Germany.
Merry Christmas!
Copyright © 2024 Chris S Bond
Disclaimer: Opinions expressed are solely my own.
This material is not peer-reviewed.
I am against #GroupThink.
Your feedback via polite factual comments / reasoned arguments welcome.
Suggested citation is:
Victoria Energy Policy Centre, [2024]. Data sourced from the Australian Energy Market Operator, processed and accessed through the Victoria Energy Policy Centre V-NEM data dashboard. www.vepc.org.au. Accessed [multiple Dates in late 2024]
You need to add moving hot water heating from nighttime to day time, then municipal water transfer, (Melbourne Water is the tenth biggest energy user in Victoria). then irrigation and ice making. then smart EV charging, Smart appliances will do washing, clean pools, preheat/precool buildings, when power is available.
Many years ago, it was said that if automatic telephone exchanges had not been invented, we would need all the girls in the world to be telephonists to handle 1970's telephony volumes. Usage patterns change to suit the technology. Train travel declined as most people could afford cars. Factories moved away from city centres when workers had cars etc etc etc.
Then the generation technology is changing. Wind turbines were originally focused on achieving peak power from available blade technology, then they started to increase tower height to access better winds and then increase rotor area more than power so the turbine could spend more hours near rated power maximising Annual Energy Production (AEP). This trend is accelerating focusing on annual revenue so output at low wind speeds can be double or more than that of a twelve-year-old turbine. When wind speeds are low prices are higher so even if the turbine turns off at high wind speeds but gets good yield at 6m/s (light breeze) it will make more money and need less storage. The latest turbines ordered in Australia will have annual output over 20 GWh. McArthur then the biggest wind farm south of the equator, with the latest technology turbines installed only 12 years ago generates 6 GWh/y per turbine
It is highly unlikely that Australia's power demand would double in twenty years. We currently use roughly 50% more electricity per person than Europe and electrifying 85% of all land transport within the NEM represents only 20% of current electricity demand, water and space heating about 20%. I did a rough calculation that if we replaced all electric immersion and gas water heaters with heat pumps there would be no net increase in demand
If we used electricity as efficiently as Italy, we could electrify all commercial, domestic and institutional gas use as well as land transport with no increase in demand.
Moreover, some of the tasks aren't as hard as you think. There are half a dozen batteries being built now that are 10-20 times as big as the Torrens Island BESS. The latest batteries are 7MWh. The original 109 MWh Hornsdale Battery needed 436 battery cabinets wired and connected. The same capacity today needs 16 battery cabinets
We can easily add 4GW/16 GWh of batteries every year and half that again behind the meter. This year we will add sufficient renewable capacity to produce 15 TWh/y and pushing that up to 20 TWh/y is not difficult as the technology improves so that would take us to almost 500 TWh/y by 2044
Tripling hydro will not happen. The Snowy Mountains scheme took 25 years to build from 1949 to 1974. Community opposition to more dams in Tasmania means there will be no more hydro there. The only concevable possibilities are the tropical North of Queensland or WA, but they are a huge distance from population. Not only will a tripling not happen, water levels at the Snowy Dams were down below 10% in the last major drought 2007-2009. Hotter temperatures due to climate change will increase evaporation rates, so there is a real danger the Snowy will generate and store no energy for months or years at a time when we are next in a major drought. So rather than tripling hydro, hydro could be constrained to close to zero. After spending $14 billion on Snowy Hydro 2, this could also be its fate.
This from the Melbourne Age Newspaper at the time. It is behind a pay wall but highlights the dam levels at that time.
https://www.theage.com.au/national/drought-could-close-down-snowy-20070422-ge4pv4.html