

Rest-of-Australia - Future
Extrapolating some data from Australia gives hints as to how the 'energy transition' down under might go

If you’re reading this in email form: for the full experience, click the graphic at the top to transfer to Substack, where you’ll be able to zoom images by clicking on them.
Power flow data is in MW and is recorded every 30 minutes. Where needed, powers can be converted to quantities of energy in MWh by multiplying each power by 30/60 hours.
dd/mm/yyyy date format is used throughout this post.
Summary
Following on from my Rest-of-Australia Reality post, I look into the future of the ‘transition’ of grid-connected rest-of-Australia. I do this by simply extrapolating from recent real recorded data from “Open Electricity” [which is what the NEM site has been rebranded as].
I continue to plot each State’s power flows on the same scale so you can readily see their relative sizes. I selected the continuous data from 29Aug2024 21:00 to 06Oct2024 18:30 (909.5 hours = 10.4% of a year) to illustrate the magnitudes of future power generation energy flows and the magnitude of energy storage (of whatever form) needed to have much influence.
For the rest, please read, look at the charts, and come to your own conclusions.
First, I think it’s worth reminding ourselves of this:
Fundamental Principle of Electricity Grids
Generation = Demand *every* minute of *every* hour of *every* day
That’s it.
Generation is Supply; Demand is Consumption; they must instantaneously balance.
If a grid does not stick to this Fundamental Principle its frequency goes higher or lower, either of which is very bad.
The grid system operator is responsible for sticking to Fundamental Principle 1. while Demand varies as society lives, works and sleeps, every 24 hours.
A couple of examples of grid operators explicitly stating this:
A. the System Operator of Northern Ireland (SONI), part of the Eirgrid plc and dealing with up to 1,777 MW of system Demand, provides this Overview. Notice how prominent the Grid Frequency indication is because it is *that critical*. SONI’s Control Centre “… carries out the intricate task of matching electricity production to consumer demand.”
B. the UK’s new National Energy System Operator (NESO) hides its primary function deep within a welter of ‘decarbonisation’ ambition, but search hard enough and you’ll find it: GB’s NESO - What We Do: Figure 1:

C. Australia’s “Open Electricity”? No, in this paragon of transparency I cannot find a statement of this fundamental. Maybe someone can point me to it.
All grids achieve this balance by scheduling generation resources to meet forecast Demand. Controllable ‘fossil’ generators can increase or decrease their power outputs within limits. ‘Renewable’ generators are not controllable, at least not in the ‘increase power’ direction. ‘Renewable’ generators *can* reduce or stop producing power (but this can lead to very significant curtailment / constraint payments).
Currently the main constraints on grids appear to be caused by local power-line capacity or transformer or other equipment limits.
However, in the ultimate and even with a hugely-expanded, unlimited-capacity grid, if Supply is greater than Demand, surplus Supply *MUST* be curtailed.
To reduce future curtailment, additional reliable schedulable Demand (for example, energy storage, hydrogen production) *could* be added to the grid to absorb ‘surplus’ generation. I look at that in more detail below.
Introduction
How might the power ‘transition’ of the rest of Australia develop? The answer from proponents of ever more ‘renewable’ energy is, of course, ever more ‘renewable’ energy.
Following on from my Rest-of-Australia Reality post, I look into the future of the ‘transition’ of grid-connected rest-of-Australia. I do this by simply extrapolating from recent real recorded data. I continue to plot each State’s power flows on the same scale so you can see their relative sizes.
Detailed power flow data (every 5 minutes or every 30 minutes) only for the last 7 days is presented by Australia’s “Open Electricity” (which was OpenNEM until April 2024). “Open Electricity” makes a bunch of grand claims regarding its transparency and mission. It still, however, presents the same p*ss-poor data-sets as I previously complained about: for example, these structural problems with its August 2024 data.
I clicked on a link to “Open Electricity” “analysis” on “spillage” aka constraint / curtailment. It is astonishing to me that an official ‘transparent’ website’s ‘analysis’ of curtailment fails to mention the ultimate cause(s) of curtailment. That is, to stop the grid from failing through imbalance of Supply versus Demand.
Mini-rant over.
From the “Open Electricity” site I downloaded a succession of files of data recorded at 30-minute intervals for a succession of 7-day intervals for the power flows of the five connected States. By simply adding / subtracting the numbers according to what *I* want to see I was able to produce the plots shown in Figures 2.
Figures 2: Recorded Power Flows in the ‘Connected’ Aus States:


For every 30-minute interval I calculated In-State Demand = sum of all recorded sources of generation, minus exports plus imports, minus battery charging plus battery discharging) for each State. Also for every 30-minute interval, I calculated the ‘renewable’ sources of power comprising Wind + Solar + Hydro.
Subtracting In-State Demand from this gives you that 30-minute interval’s In-State Shortfall. Conversely, if Wind + Solar + Hydro > In-State Demand then there is a Surplus of ‘renewable’ power. [This does not contravene Fundamental Principle 1. because in these early years of Australia’s power ‘transition’, if the interconnectors between States have sufficient capacity, Surplus ‘renewable’ power can be exported to neighbouring States and Shortfalls imported.]
In order to estimate future conditions, I performed extrapolations on each 30-minute interval’s recorded power as follows:
- recorded Wind multiplied by the Wind multiplier = [future Wind];
- recorded [total Solar] multiplied by the Solar multiplier = [future Solar];
- derived In-State Demand multiplied by the Demand multiplier =
[future In-State Demand];
- I leave Hydro unchanged, i.e. multiplier 1.00
I then compared each future [Wind + Solar + Hydro] with future [In-State Demand]
I’ve used David Osmond’s article as ‘inspiration’ for the multiplication factors I’ve used, as shown in Tables 1:
Tables 1: Future Australia ‘Renewable’ Energy Needs:

2024 is ‘now’. In the Q&A of David’s article we find his estimates of the overall multipliers necessary to achieve his “feasible and affordable” “near 100pct renewable grid for Australia”. He also states in his FAQs “it is likely demand will more than double over the next couple of decades” which would take us to 2044. Doubling Demand also allows future Australia to avoid de-industrialisation through lack of power, so I have included the rising Demand factor accordingly.
I have spaced the factor increments ~evenly across the 20 years so I can select four ‘snapshots’ of future connected Australia’s power flows: 2024; 2030; 2037; and 2044.
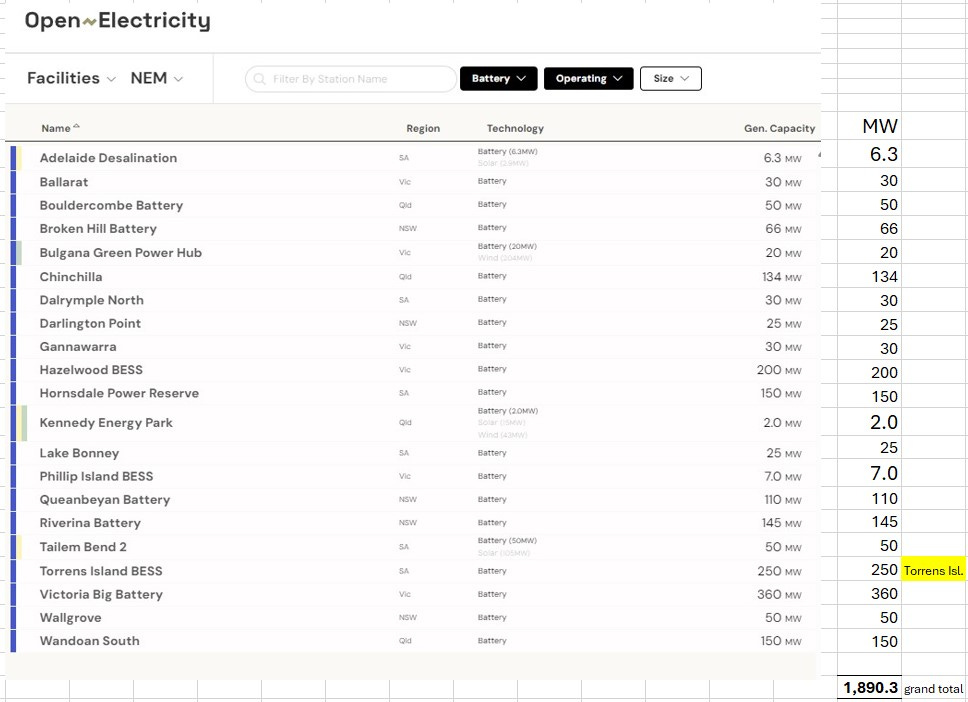
Despite my criticisms of the “Open Electricity” website I *did* find one area of it slightly useful: Facilities, Operating, Batteries. See Figure 3. The fact that the quantity of energy that could be stored (MWh) is not defined, rather undermines their claim of transparency. I will assume it’s all good for 2 hours [probably optimistic] and hence the operating storage capacity is perhaps 3,780 MWh. You’ll see how little this estimate moves the dial later in this post.
Figure 3: All Australia Battery Energy Storage Systems (Operating):
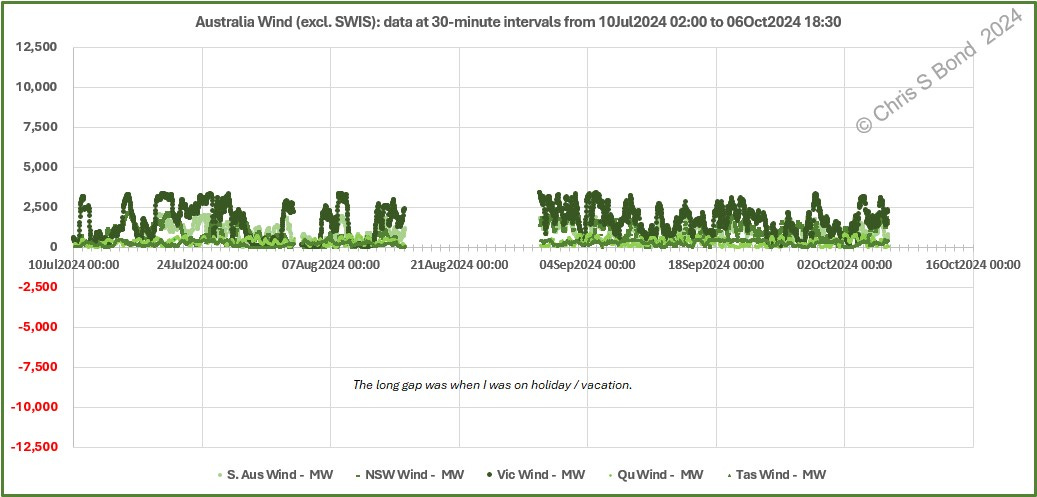
From the sets of data for the connected States we can sum the total aggregate Wind power for each 30-minute interval. This is plotted in Figure 4.
Figure 4: Combined Wind Powers, 10Jul2024 02:00 to 06Oct2024 18:30:
Also from the sets of data for the connected States we can sum the total aggregate Solar power and add this to the aggregate Wind power for each time interval. This is plotted in Figure 5.
Figure 5: Wind, Combined Wind & Combined Solar, and Visible Lulls, 10Jul2024 02:00 to 06Oct2024 18:30:
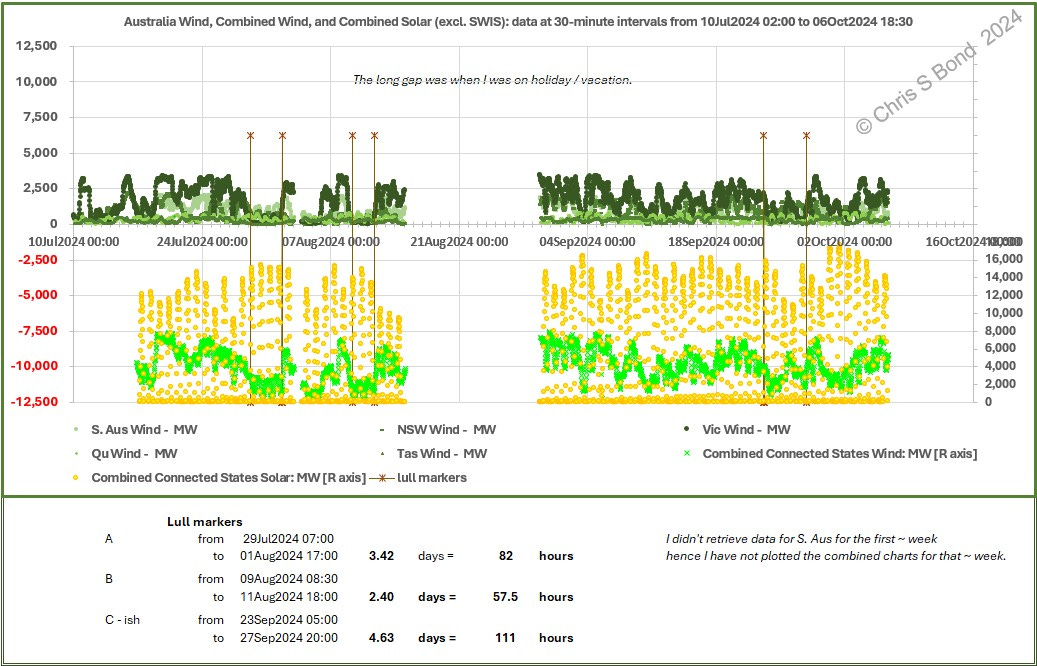
In the relatively short interval covered (10 July to 06 October but with a gap 15-30 August), I have signposted three significant Wind lulls lasting 82 hours, 57½ hours and 111 hours respectively. In the longest of those lulls there are 4 nights of zero Solar generation.
Is there another lull after 27 September? It doesn’t matter, the effects of lulls are cumulative which you’ll see if you have very large amounts of electrical energy storage on the grid. Lulls just flatten your batteries, see below in Figures 7.
‘But I’ve heard electrical energy storage battery cells are getting really really cheap…’
Perhaps true, but all the other electrical equipment, the basic infrastructure and the engineering skills needed to make a functioning grid-connected battery energy storage system (BESS) are subject to the general inflationary pressures we see all around us. The example project I’ve referenced in the cost estimate below is the Torrens Island BESS. It has power capacity 250 MW, storage capacity 250 MWh, and was originally reported to be a AUS $180 million project.
Anyway, current power flows i.e. actual Australia Combined Solar & Wind [data at 30-minute intervals] from 29Aug2024 21:00 to 06Oct2024 18:30 are plotted on the left of Figures 6. From above, the current operating energy storage capacity is perhaps 3,780 MWh, which (if it was constrained to only store surplus ‘renewable’ power, which it isn’t) wouldn’t change the 100% Shortfalls of ‘renewables’ more than 2½ iotas.
Figures 6: Actual 29Aug-06Oct 2024; with Current Energy Storage:


But the future is a brighter, ‘cleaner’ world…
Using the multiplication factors shown in Tables 1, I produced the future snapshot plots shown in Figures 7.
Figures 7: Future Australia: Including Increasing Energy Storage


Note the diminishing returns for each increment of Wind & Solar *capacity* and for the increments of LDES storage capacity. See also the results summary Figure 9.
Figures 8: Future Australia 2044: ∆ with 10% of Energy Storage:


My selected data is continuous from 29Aug2024 21:00 to 06Oct2024 18:30, that is 909.5 hours from the recent spring in Australia. I’m not claiming this is ‘typical’: it’s simply the data I have that is recorded at sufficiently-granular time intervals (every 30 minutes) as to be useful in this context. The annualised results shown across the bottom of Figure 9 are thus indicative ONLY.
Figure 9: Future ‘Renewable’ Australia Results Summary:
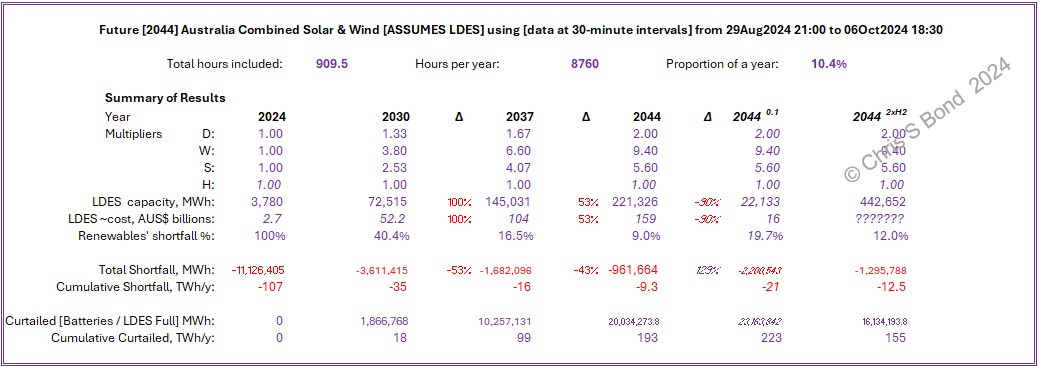
I don’t live in Australia, and I don’t pay taxes or energy bills in Australia. If I did, I would be wondering whether the huge investments in ‘renewable’ generation *capacity* and grid capacity and long duration energy capacity needed to achieve ‘decarbonisation’ just of the power sector across grid-connected Australia was worth the savings. The law of diminishing returns is evident in these results.
To go from 2024 to 2030 requires:
380% of 2024 Wind *capacity*; 250% of Total 2024 Solar *capacity*; around AUS$ 50 billion of additional LDES1; and commensurate grid and infrastructure reinforcements; all to reduce fossil energy from 107 to 35 i.e. by 72 TWh.
Then to go from 2030 to 2037 requires:
660% of 2024 Wind *capacity*; 400% of Total 2024 Solar *capacity*; around AUS$ 100 billion more LDES than currently exists; and even greater grid and infrastructure reinforcements; all to reduce fossil energy from 35 to 16 i.e. by 19 TWh.
And to go further, from 2037 to 2044 requires:
940% of 2024 Wind *capacity*; 560% of Total 2024 Solar *capacity*; around AUS$ 155 billion more LDES than currently exists; and further, greater grid and infrastructure reinforcements; all to reduce fossil energy from 16 to 9 i.e. by another 7 TWh.
As I indicate in the 2044 0.1 column, a 90% reduction in future target LDES ‘investment’ results in a fossil energy requirement of about 21 TWh. That looks to me like a very good financial justification for converting some existing (fully paid-for) Aussie coal plants to two-shift operation. If they only operate ~10% of the time, they’ll only emit ~10% of the CO2. But for some folk who require perfect rather than good solutions, that may still be too much.
And lastly, just for the hydrogen proponents, I’ve included the 2044 2xH2 column in the summary table. Goodness knows what the cost of that capacity of [electrolysers plus electrical equipment plus water ultra-purification plus H2/O2 separation plus H2 compression plus H2 storage plus H2 gas turbine power generation plus high-integrity H2 detection and safety shutdown systems for every step of the chain] would be. And after spending all that AUS$ ??????? those grid-connected States would still need over 10 TWh of controllable dispatchable fossil energy to make up the remaining Shortfalls, while having to curtail over 150 TWh of surplus [W+S+H] power to avoid crashing the grids.
Because as more and more ‘renewable’ generation gets added across grid-connected-Australia the States will collectively and increasing run out of Demand at times of Surplus generation. When Wind surges across multiple States (Figures 4 and 5) after the sun has come up, in order to comply with Principle 1 it will increasingly have to be curtailed. Utility Solar and Wind will be stomped on heavily, leaving their economics crushed into the dirt.
I have no easy solution to all this.
I don’t see ever-increasing energy subsidies as being the answer.
Not in competitive world.
Copyright © 2024 Chris S Bond
Disclaimer: Opinions expressed are solely my own.
This material is not peer-reviewed.
I am against #GroupThink.
Your feedback via polite factual comments / reasoned arguments welcome.
I fully realise that there are long duration energy storage (LDES) technologies other than batteries or pumped hydro. Examples include liquid air energy storage (LAES), compressed air energy storage (CAES), gravimetric energy storage, and others. All are yet to be fully commercialised at sufficiently low costs as to be attractive. However, currently Australia seems to be all-in for battery energy storage so that’s the comparator I’ve used again here.
Great work. I am curious: can you can find evidence of any decommissioned coal plants in Australia that were completely replaced by electricity generated solely by solar + wind + batteries?
A few months ago I threat out this challenge, and so far no one has been able to find one example:
https://frompovertytoprogress.substack.com/p/prove-that-solarwind-replaces-fossil
I also recently wrote another article debunking some cases reported in the media:
https://frompovertytoprogress.substack.com/p/more-evidence-that-solar-wind-cannot
You seem to specialise in Straw man arguments.
It would be really good if you had half an idea what is happening in Australia before going off on frolics like this.
a) Australia already uses twice as much electricity per person as France/Italy/Spain even though it is less industrialised. The only reason electricity demand in Australia will double is that it is displacing fossil fuels in transport and heating. With the current mix that would mean that if renewable output remains the same we would need 360 TWh/y from fossil fuels/nuclear, where is that in your calculations
b) Australia isn't all in on batteries. As wind and solar increases, hydro increasingly becomes a gap filler, so even in a drought year, existing hydro will be able to supply 7-8 GW/2,000 GWh in a bad wind+solar week. In addition there is 2.2 GW/360 GWh of pumped hydro under construction and 10 GW/200 GWh undergoing feasibility as well as about 1-2 GW of potential capacity enhancement at existing hydro such as Shoalhaven, Tarraleah, Hume, Dartmouth etc. Australia will probably have 20-25 GW/60-100 GWh of battery storage by 2035, trivial compared to hydro/pumped hydro, let alone thermal storage, biofuels etc.
c) How is curtailment an issue. Every grid in the world curtails coal, gas and even nuclear. Way back in 2008 Australia's gas plants ran at less than 10% capacity. Peak utilisation of Germany's coal plants was 62%. France has 61 GW of nuclear of which about 55 GW is operational. Output has been as low as 21 GW this year. The US has 720 GW of thermal plants that average 40% CF
Curtailment is a far less important issue for wind and solar than for coal and gas.
i) The non fuel costs per day/MW of coal capacity are about double those of wind, gas almost double those of solar so the opportunity cost of operating below capacity is higher for thermal plants than wind and solar.
ii) If someone has an application for power that is only economical at $10-20/MWh, wind and solar can make a contribution to overheads at that price, coal and gas can't so they earn no revenue. If the opportunity is only there for 20-30 minutes even at A$60 wind and solar can jump in coal and gas can't
iii) in short periods of low demand nuclear, coal and to a lesser extent, gas plants have to pay customers to take their power, wind and solar plants just shut down, because they can ramp back up in seconds and they don't suffer from thermal fatigue
c) Wind and solar plants can actually earn FCAS revenue when there is excess generation even if they are stopped or running below their available output, because they can inject power almost instantly or their inverters can inject VARs even if the plant is not supplying power. Coal and gas plants have to burn fuel to earn that revenue.
In summary, not a pass mark I am afraid