

California Battery Reality
The Golden State is the poster-child for sun-power, so here's how the battery side of CA's 'energy transition' is going

For the detailed analysis featured later in this post, I downloaded sets of data from the California Independent System Operator (CAISO). These appear designed to foil any attempt to gain a longer-term view (i.e. of more than one day): six different downloads (batteries; demand; hybrids; imports; renewables; supply) are required for each day.1
But first, to get an idea of how CAISO thinks it’s doing, I took a look at the January 2025 key statistics [pdf]. Those in Figures 1 struck me particularly.
Figures 1: CAISO January 2025 Key Statistics:


Two of the steepest 3-hour average ramp rates ever experienced occurred in January 2025, which I think is an inevitable consequence of installing ever higher Solar *capacity*2 (see centre image). High ramp rates can cause problems because these are the rates of change of power being produced by dispatchable (fossil) generation: higher rates of change = higher stresses and can mean greater probability of breakdown of equipment and/or it’s more likely that operational mistakes are made.
The installed battery power capacity of 11,454 MW seems impressive - but we have to guess how many MWh of electrical energy storage capacity this comprises. Whatever that number of MWh, it is clearly insufficient to avoid very large amounts of power curtailment, over 130,000 MWh in January alone: an average of over 4,200 MWh per day just in this month. But that’s peanuts in comparison with some of the monthly curtailment levels recorded through 2024 [pdf], see Figures 2.
Figures 2: CAISO Wind & Solar Curtailments, 2024:


All that ‘free’ energy going to waste / not earning any return on all the capital expended on the Solar panels / inverters / cables / engineering / etc.
For these reasons CA has been increasing its battery storage in tandem with at least some of the increase in Solar *capacity*: this is its ‘hybrid Solar’. In the data for 15 January 2025, for example, the maximum ‘hybrid Solar’ power was 1,453 MW while its average across those 24 hours was 440 MW. These were around 10% of the corresponding (non-hybrid) Solar numbers on that day.
But how much farther must CA go with battery capacity to make a significant difference to its Solar ‘duck curve’?
In the limit, we can calculate the energy storage required to smooth the Solar surge across all 24 hours of a day.
To do this for different days of the week and for a sample of days through the year, I chose to download complete sets of data for each 15th of the month - from January 2024 through February 2025.
Figures 3: January 2024:


The table beneath the left-hand image gives that day’s totals. Of the 546 thousand MWh of Demand, 58% was satisfied by burning gas, which mostly accounts for the 57% Shortfall in fossil-free generation. On this day Wind provided 6% and Solar (including hybrid Solar) 13%. For Solar to completely replace the gas generation on this day CA would need (73.4+319.3)/73.4 = 5.35 times current Solar *capacity*.
The energy storage simulation takes just the Solar energy total of 73,410 MWh and smooths it out to provide 3,059 MWh/h across all 24 hours of the day using *really BIG* batteries. You can only draw power from those batteries between midnight until after dawn if at midnight they start charged (from the day before, or from Wind, or from good ol’ fossils). After the sun comes up, Solar in excess of that day’s average 3,059 MWh/h can be used to recharge the batteries while 3,059 MWh/h can flow directly to the CAISO grid. After Solar output drops the batteries can continue to provide 3,059 MWh/h. The state of charge (SoC) of the batteries is shown by the heavy blue line [plotted against the right hand axis].
I adjusted the initial SoC for this day so that the minimum SoC was 10%. I assume the maximum SoC should not exceed 90%, hence the total capacity of the batteries is approximately 1.1 times maximum SoC = 57,466 MWh. (Note: that is 20 times - round numbers - the 3,000 MWh capacity of the pre-fire Moss Landing battery energy storage system, BESS.) Also worth noting that none of my numbers attempt to adjust for curtailment.
Of course, energy is lost when going through a battery system according to the round-trip efficiency (RTE). You’ll see later in this post that some days CAISO recorded data indicating RTE of 80%, which also corresponds to some Australia BESS data. So, inevitably, the end-of-day SoC is lower than the initial SoC.
I’ve separated CAISO’s ‘Total batteries’ data into ‘Total batteries (-ve)’ (charging) and ‘Total batteries (+ve)’ (discharging to the CA grid) in the right-hand image in Figures 3. The apparent RTE from that day’s data is greater than 100% and hence is not possible. Of course, CA batteries are not constrained to only charge from Solar or Wind. I assume they charge when power is relatively cheap and discharge when it’s relatively expensive: good for battery-owners, maybe not so good for bill-payers.
In case the numbers aren’t scarily large already, remember that CA would actually need 5.35 times current Solar *capacity* to displace fossil generation on this day. (Assuming that inter-seasonal electrical energy storage remains, as now, a pipe-dream.) So the 20 times Moss Landing BESS number also need to be increased by this same factor, i.e. to over 100 times. And that doesn’t allow for extra power needed to ‘electrify everything’…
15th January 2024 had little imported electricity, but in other months CA relied heavily on imported power. How ‘green’ is that? See Figure 4.
Figure 4: How Fossil-Free are CA Power Imports:
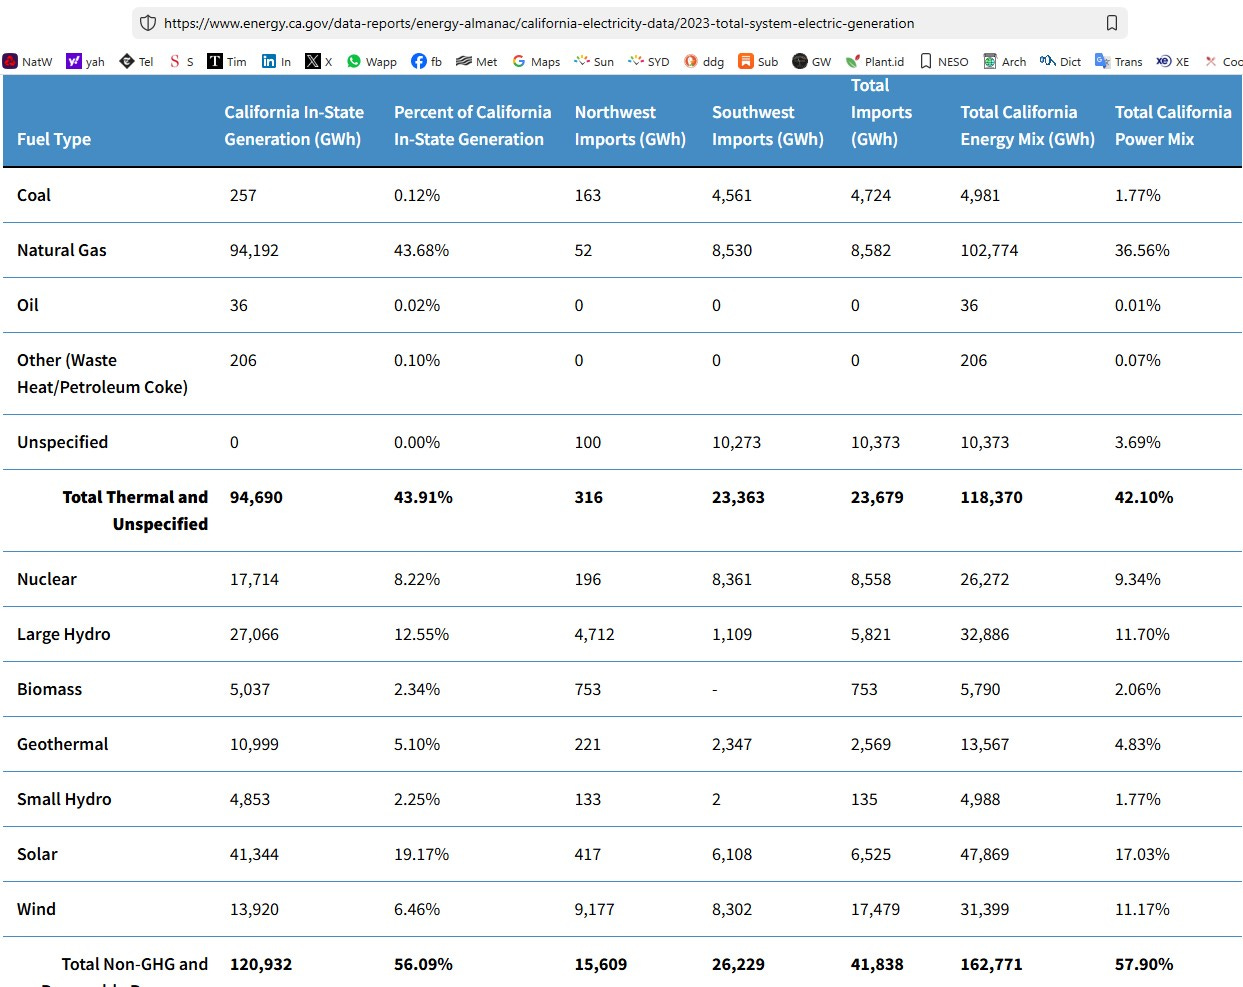
Figure 4 shows the data as reported for 2023. The Total Imports column shows 23,679 GWh was from fossil and unspecified sources, while non-GHG sources were 41,838 GWh. That’s a total of 65,517 GWh: so imports are around 36% fossil / 64% non-fossil averaged over a year.
As the year advances, we see the quantity of Solar power generation (including hybrid) increases quite dramatically but somewhat randomly - as it’s subject to the actual weather / cloud etc. conditions on the day - on subsequent 15ths of each month.
Figures 5: 15th of February, March, and April 2024:


On 15th February 2024, Solar provided 114,854 MWh, which could be averaged at 3,949 MWh/h for that day, requiring an initial SoC of 44,000 MWh in BESS with capacity nearly 83 thousand MWh or ~28 times Moss Landing.
For Solar to completely replace the gas generation on this day CA would need (114.9+199.8)/114.9 = 2.74 times current Solar *capacity*. That means a BESS requirement of 2.74 x 28 = 77 times Moss Landing. Ignoring replacement of the ~one third of imported power that is fossil-derived, plus requirements for more power to electrify everything, etc.On 15th March 2024, Solar provided 94,778 MWh, which could be averaged at 4,786 MWh/h for that day, requiring an initial SoC of 50,000 MWh in BESS with capacity just over 65 thousand MWh or ~22 times Moss Landing.
For Solar to completely replace the gas generation on this day CA would need (94.8+142.8)/94.8 = 2.51 times current Solar *capacity*. That means a BESS requirement of 2.51 x 22 = 55 times Moss Landing. Ignoring imports replacement, etc.On 15th April 2024, Solar provided 158,546 MWh, which could be averaged at 6,606 MWh/h for that day, requiring an initial SoC of 67,000 MWh in BESS with capacity just over 99 thousand MWh or ~34 times Moss Landing.
For Solar to completely replace the gas generation on this day CA would need (76.5+158.5)/158.5 = 1.51 times current Solar *capacity*. That means a BESS requirement of 1.51 x 22 = 33 times Moss Landing. Ignoring imports replacement, etc.
The recorded battery charging & discharging that day were -5% / +5% of Demand, implying an RTE of 86%. The curtailment through April 2024 was over 800,000 MWh per Figures 2 but I do not know how much was curtailed this 15th.
Continuing the snapshots from later in the year:
Figures 6: 15th of May, June, July and August 2024:


On 15th May 2024, Solar provided 190,683 MWh, which could be averaged at 7,945 MWh/h for that day, requiring an initial SoC of 77,000 MWh in BESS with capacity nearly 113 thousand MWh or ~38 times Moss Landing.
For Solar to completely replace the gas generation on this day CA would need (190.7+81.5)/190.7 = 1.43 times current Solar *capacity*. That means a BESS requirement of 1.43 x 38 = 54 times Moss Landing. Ignoring imports replacement, etc.On 15th June 2024, Solar provided 211,407 MWh, which could be averaged at 8,809 MWh/h for that day, requiring an initial SoC of 84,000 MWh in BESS with capacity just over 123 thousand MWh or ~42 times Moss Landing.
For Solar to completely replace the gas generation on this day CA would need (211.4+65.1)/211.4 = 1.31 times current Solar *capacity*. That means a BESS requirement of 1.31 x 42 = 55 times Moss Landing. Ignoring imports replacement, etc.On 15th July 2024, Solar provided 184,567 MWh, which could be averaged at 7,690 MWh/h for that day, requiring an initial SoC of 76,000 MWh in BESS with capacity just over 110 thousand MWh or ~37 times Moss Landing.
For Solar to completely replace the gas generation on this day CA would need (184.6+250.3)/184.6 = 2.36 times current Solar *capacity*. That means a BESS requirement of 2.36 x 37 = 87 times Moss Landing. Ignoring imports replacement, etc.On 15th August 2024, Solar provided 214,158 MWh, which could be averaged at 8,923 MWh/h for that day, requiring an initial SoC of 90,000 MWh in BESS with capacity just over 132 thousand MWh or ~45 times Moss Landing.
For Solar to completely replace the gas generation on this day CA would need (214.2+192.9)/214.2 = 1.90 times current Solar *capacity*. That means a BESS requirement of 1.90 x 45 = 86 times Moss Landing. Ignoring imports replacement, etc.
The recorded battery charging & discharging that day were -4% / +3% of Demand, implying an RTE of 79%. The curtailment through that month was minimal per Figures 2.
15th July and 15th August 2024 look to be the BESS-determining days out of the days I analysed (disregarding 15th January 2024 as its results seem anomalous). These are its requirements, should CAISO choose to invest in more and more Solar *capacity* plus sufficient BESS capacity to reduce curtailments very substantially:
Around 1.9 to 2.4 times current Solar *capacity*;
Around 86-87 times the MWh energy storage capacity of Moss Landing;
At 80% RTE the energy lost through the BESS system would be around 1.9 x (90 - 64) = 50 MWh on a day like 15th August;
The duration of energy storage would need to be from about 18:30 (when Solar generation drops below the day’s average) through to around 07:30 the next day (when Solar generation rises once more above the day’s average). At least 13 hours. Just to smooth out the daily surges of Solar power.
All plus appropriate design margins to account for worse-case days
Plus whatever additional factors are required to provide power for greater levels of electrification plus AI data-centres plus… etc.
Could that be done? Technically I think the answer is Yes.
Is that the best way to ‘decarbonise’ the CAISO grid? You decide.
P.S. for completeness:
Figures 7 show the 15ths from the rest of 2024, and
Figures 8 the 15ths from the first two months of 2025.
Figures 7: 15th of Sep, Oct, Nov and Dec 2024:


Figures 8: 15th of January and February 2025:


I leave it to readers to ‘do the math’ to calculate the multiples of Solar *capacity* plus BESS capacities needed to be fossil-free on these days.
Copyright © 2025 Chris S Bond
Disclaimer: Opinions expressed are solely my own.
This material is not peer-reviewed.
I am against #GroupThink.
Your feedback via polite factual comments / reasoned arguments welcome.
All the CAISO comma-separated variable (.csv) files have the data arranged in rows not columns. That’s 288 columns for each day with 5-minute data intervals. The column limit in Excel is 16384, i.e. 56.88 times 288 ≈ 8 weeks if you ‘stitched’ 56 sets of daily data together going across.
Whereas the row limit in Excel is 1048578. That’s 3640.896 times 288, i.e. 10 years’ worth.
I use the convention *capacity* when I refer to Wind and Solar to emphasise that whatever their nominal design peak generation capability, their output on a given day is in the gift of the weather gods. In addition to which, Solar’s output every night is zero.
Great Analysis. You have captured some significant factors regarding the nameplate capacity of Wind, Solar and Storage needed to displace hydrocarbons.
One thing you might want to consider, is the effect of diminishing returns on adding Wind & Solar Capacity. Contrary to popular opinion. storage does not soak up all the curtailed energy. Curtailment remains a major issue regardless of how much storage you install.
https://wrjohn1.substack.com/p/wind-solar-and-the-effect-of-diminishing
I don’t think it’s possible to power CAISO with only solar and BESS.
It would cost several trillion dollars to install and then trillions have to be spent every year to replace a portion of the system as it ages.
It’s economic insanity.
And this ignores the technical challenges of synchronous grid inertia and grid stability without large rotating machines to ride out a fault.