More Over-Abundant Wind
GB power generation for the month spanning Storm Floris, 04-05 August 2025

In early August, the north of the UK experienced ‘Storm Floris’, as shown in the screen-grab from an ‘X’ post from the Met Office at 1.57pm on Fri 01 Aug 2025 below:

The storm-force winds covered the area of the UK which is already over-endowed with Wind *capacity*1 but under-endowed with transmission to the south [and also under-endowed with major Demands - a situation due to get worse if INEOS abandons Grangemouth because of hostile energy policy and costs]. As a consequence, lots of generation was Constrained / Curtailed, at a cost said to be over £30 million just in that one day.
I’ve seen it argued that the solution to high Constraint payments to Scottish Wind farms in such circumstances is to increase the capacity of the grid connecting Scotland to the south. That’s probably true in the short term, but it doesn’t solve the ultimate constraint in all electricity systems:
Supply MUST equal Demand every minute of every hour of every day
‘Surplus’ electricity must be constrained near-instantaneously, as must ‘Shortfalls’ be supplied. Otherwise the grid frequency varies outside its tightly-controlled limits and, if not corrected in real time, the grid or parts of it can ultimately fail.
So, further to my Over-Abundant Wind post from late 2024, and using the methodology I explained in my my Great Britain Reality post from January this year, I’ve looked into what the GB fleet of Wind plus Solar PV2 was doing over a period of a month spanning the days of Storm Floris.
Figures 1: The Gridwatch Dashboard as of 11.30 on 17th August:


The whole dashboard is shown on the left; I zoomed in on the week and month views of Demand, plus Gas, Wind and Nuclear in the middle; and on the right are zoomed views of that week and month of Hydro, Pumped, Biomass and Solar.
Note we are being propped up massively and near-continuously by mainly French and Belgian Nuclear plus Norwegian Hydro [see the charts on the far right of the whole dashboard view] via interconnectors [long may they remain undisturbed by dragging anchors].
I propose two handy rules of thumb when looking at the Gridwatch dashboard and wondering whether HMGov’s ‘net zero’ plan will keep the lights on without dispatchable power generation:
In summer when Demand is ~20 to 35 GW (as shown in Figures 1), all the time Wind is less than about 5 GW the lights would be dimming or out every night;
In winter when Demand is ~40 to 50 GW, all the time Wind is less than about
10 GW the lights would be dimming or out every long dark cold night.
But surely energy storage would keep the lights on…
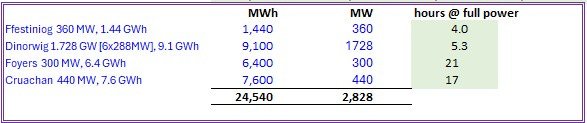
The four pumped hydro schemes in the UK have combined power capacity of
2,828 MW and have different durations of full-power discharge capacities ranging from 4 to 21 hours:
Then there’s GB’s huge fleet of operating batteries…
HMGov keep a ‘database’ of renewable energy projects [csv] “RE PD-q1-Apr-2025.xlsx” last updated 5 June 2025. Filtering for ‘Batteries’ under ‘Technology Type’ and ‘Operational’ under ‘Development Status’ we find 124 records, of which 103 have Installed Capacity (MWelec) values which sum to 2,631.8 MW - see the bottom right corner of Figure 2.
Figure 2: GB Operating Energy Storage - Batteries:
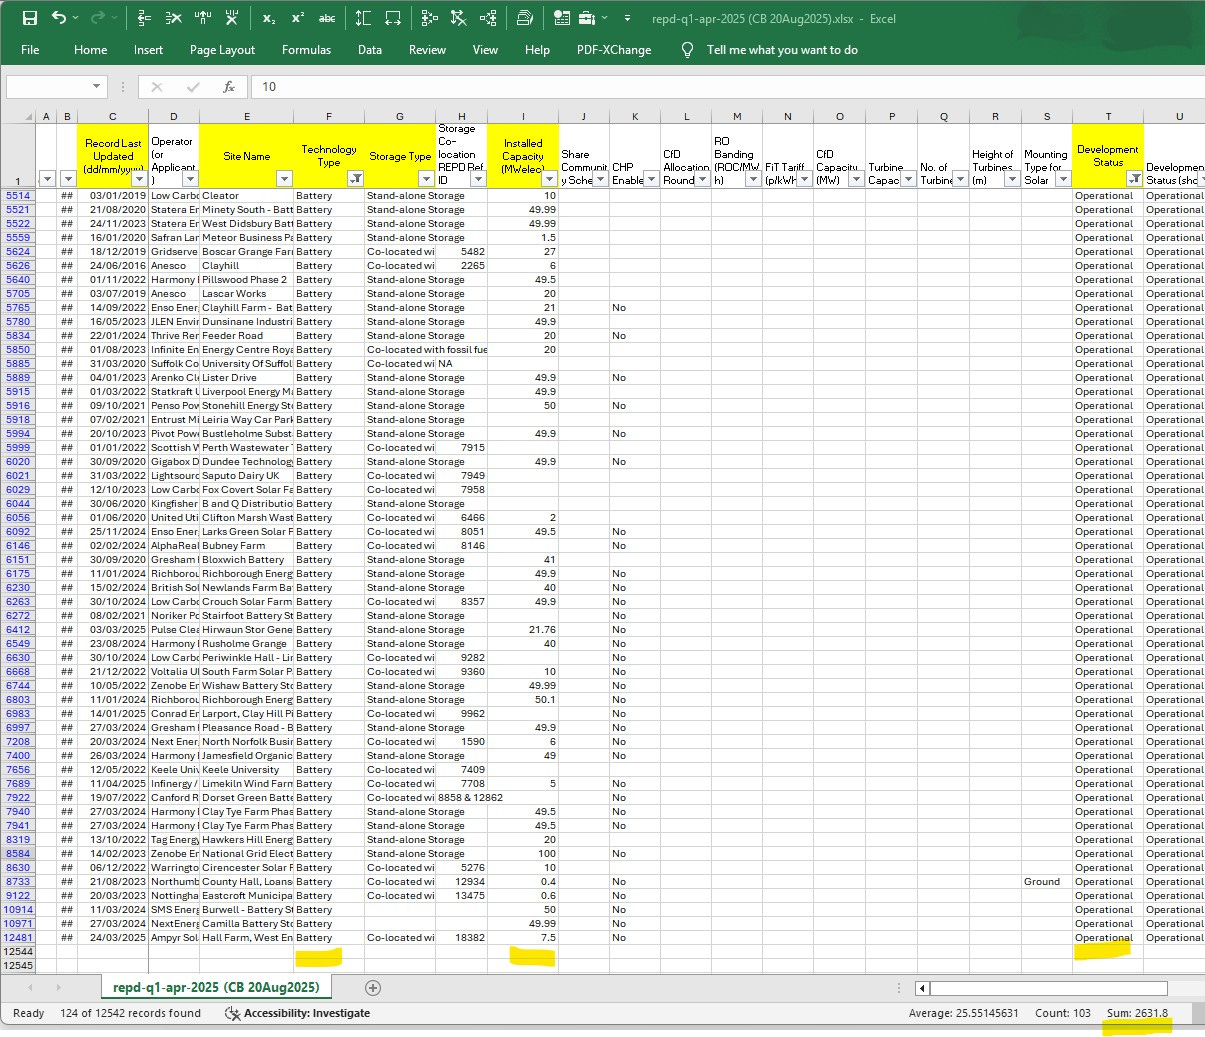
HMGov don’t actually record the potential duration of this storage3, but I’ll be generous and assume 1½ hours average usable duration, from which I derive current operating energy storage capacity of batteries ≈ 3,948 MWh.
Adding the pumped hydro storage capacity gives 28,488 MWh total. I’ll be extra-generous and allow this all to act as long-duration energy storage (LDES) when I include it in my analysis of the subject month. First, the plot of Gridwatch Demand, with Wind and Solar generation profiles. [I explain my use of adjustment factors in my GB Reality post.]
Figure 3: GB Demand, Wind and Solar PV; 17 July - 17 August 2025:
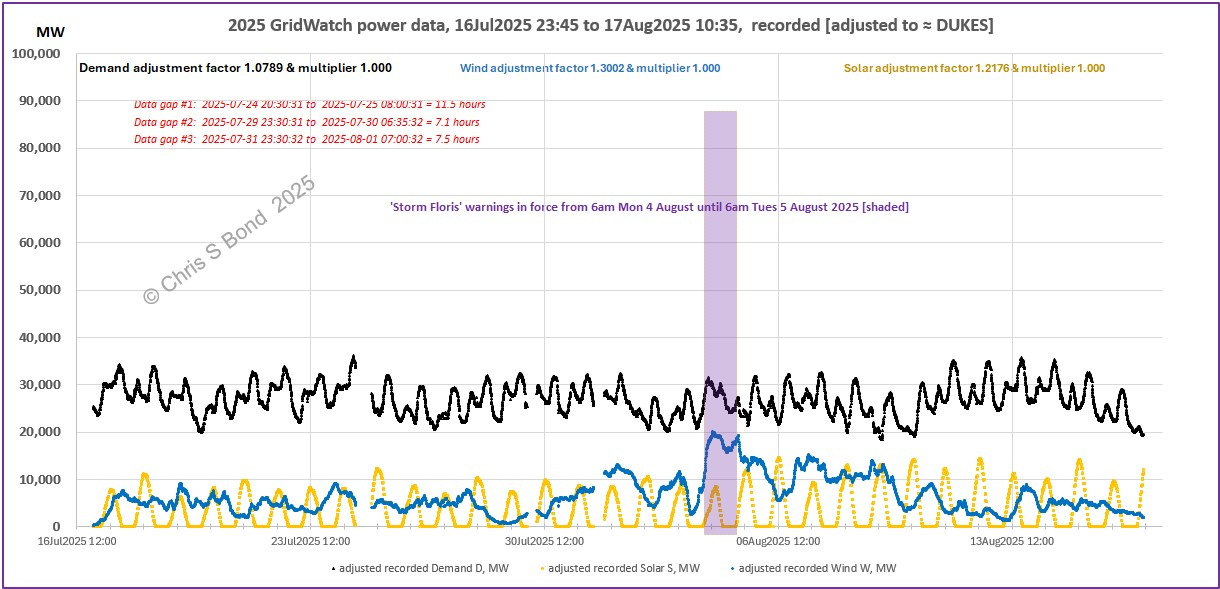
Applying rule of thumb 1. from above, you can already see there’s multiple times just in this month where Wind dropped and so HMGov future energy policy is likely to fail. It looks like a substantial proportion of the Wind fleet was able to keep generating through Storm Floris [shaded].
Figure 4: GB Imports / Exports; and Shortfalls; 17 July - 17 August 2025:
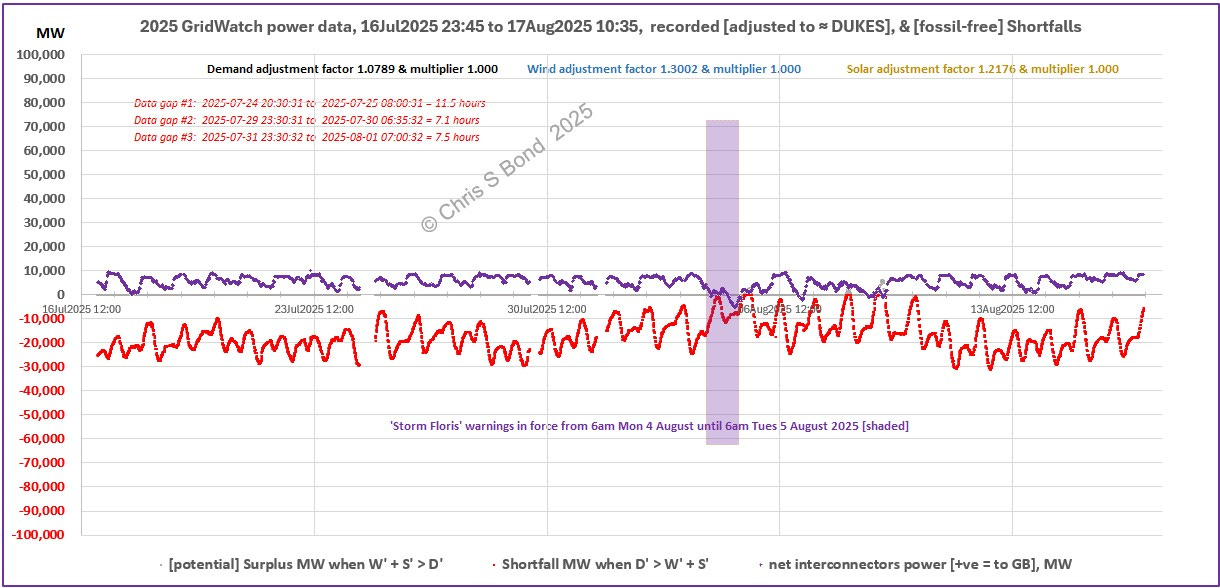
Through ‘Storm Floris’ our grid operator NESO [National Energy System Operator, formerly known as National Grid ESO] managed to get Imports switched to Exports [purple plot] and there was no ultimate constraint Curtailment imposed during the storm. However, Wind generation remained high for several days after the storm and immediately the sun came out fully on 5th August and again on 8th and 9th August, there were [potential] surpluses of ‘renewables’ requiring GB-level ultimate constraint actions. You’ll see this better in the zoomed version, Figure 4A, where I’ve highlighted the positions of the [grey plot] ultimate constraint peaks in yellow.
Figure 4A: GB Imports / Exports; Shortfalls; and Curtailments; 17 July - 17 August 2025:
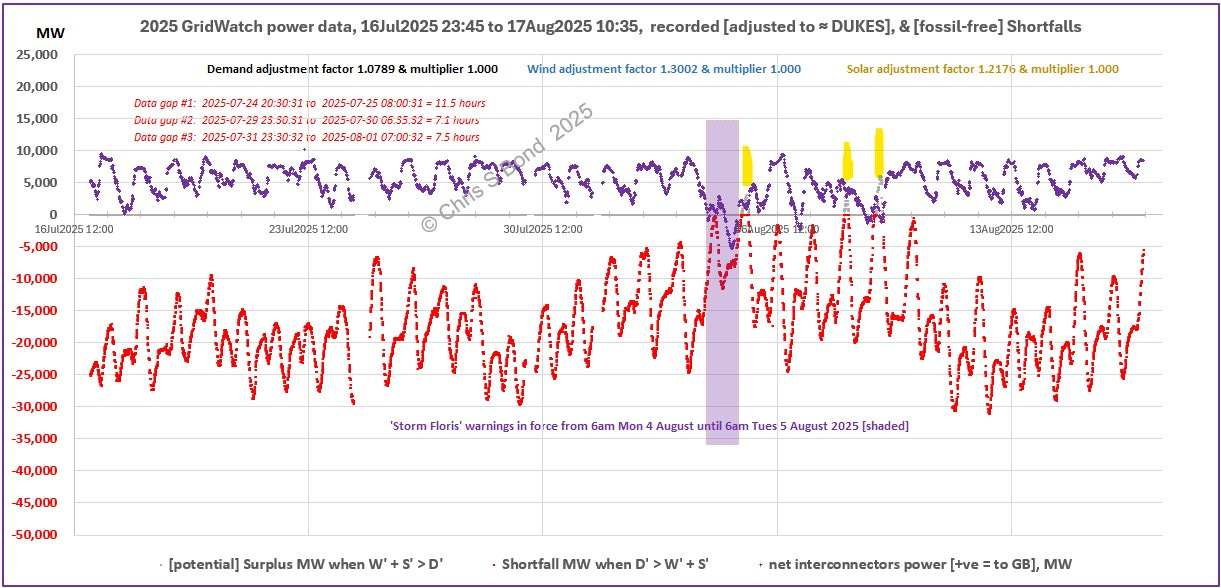
It appears that NESO didn’t achieve sufficient switching of Imports to Exports during those intervals… the peak [potential] surplus was about 6,150 MW, i.e. within the combined capacity of the interconnectors had they all been exporting at those times.
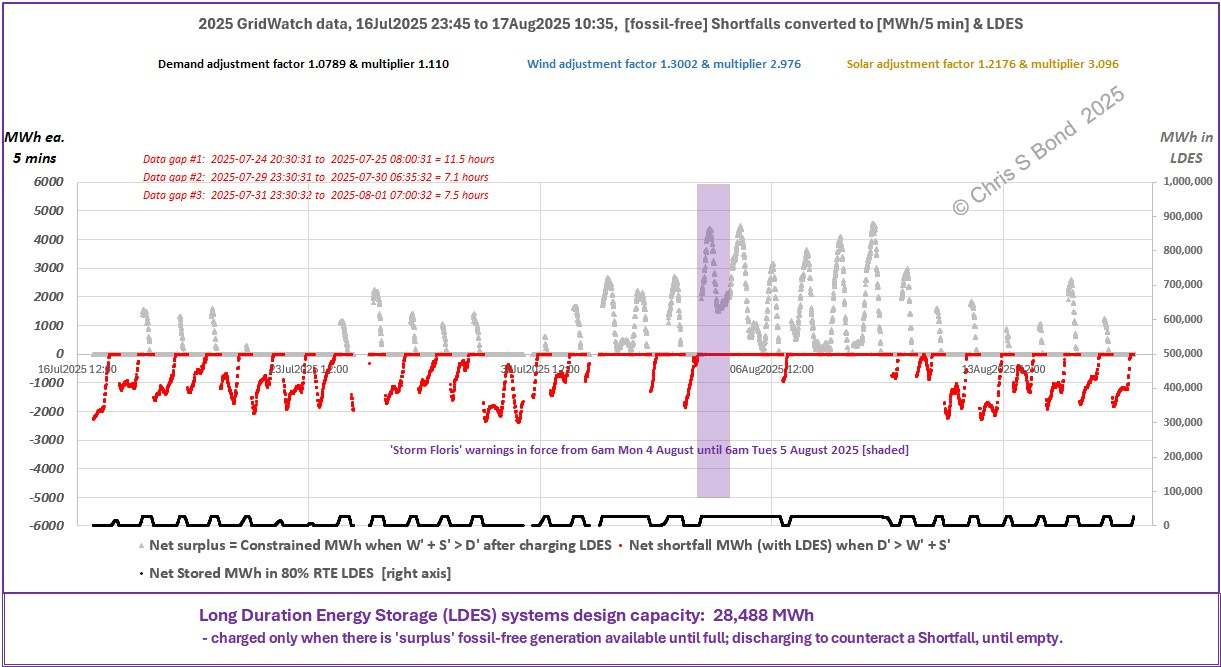
Figure 5: GB Shortfalls; and LDES; 17 July - 17 August 2025:
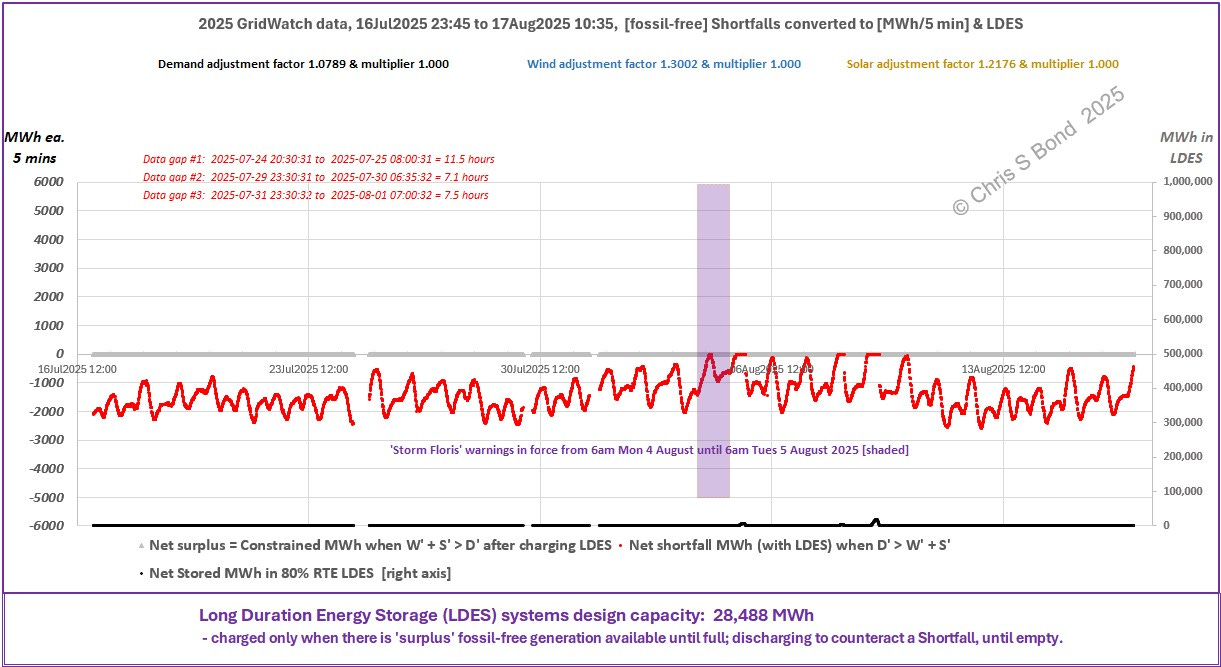
As stated in the footer of Figure 5, my LDES algorithm allows charging only when there is 'surplus' fossil-free generation available; and discharging to counteract a Shortfall only if the LDES has energy stored. Because the period before the storm was continuously in Shortfall the LDES would be continuously flat. It is only in those short intervals of non-Shortfall that any energy goes into the LDES, but it is quickly run flat again.
The peak of stored LDES energy on 9th August is 18,822 MWh at 15:45. This is less than total LDES capacity, and so on this very simple basis increasing LDES capacity would appear not to be a benefit. However, peak power being stored in LDES was 6,086 MW at 14:00 that day: this is over double the power rating of the pumped hydro schemes. Ooops!
Extrapolating to HMGov’s planned future *capacities* of Wind and Solar based on this short interval of data we can illustrate some likely problems.
Figure 6: Future GB Demand, Wind and Solar PV:
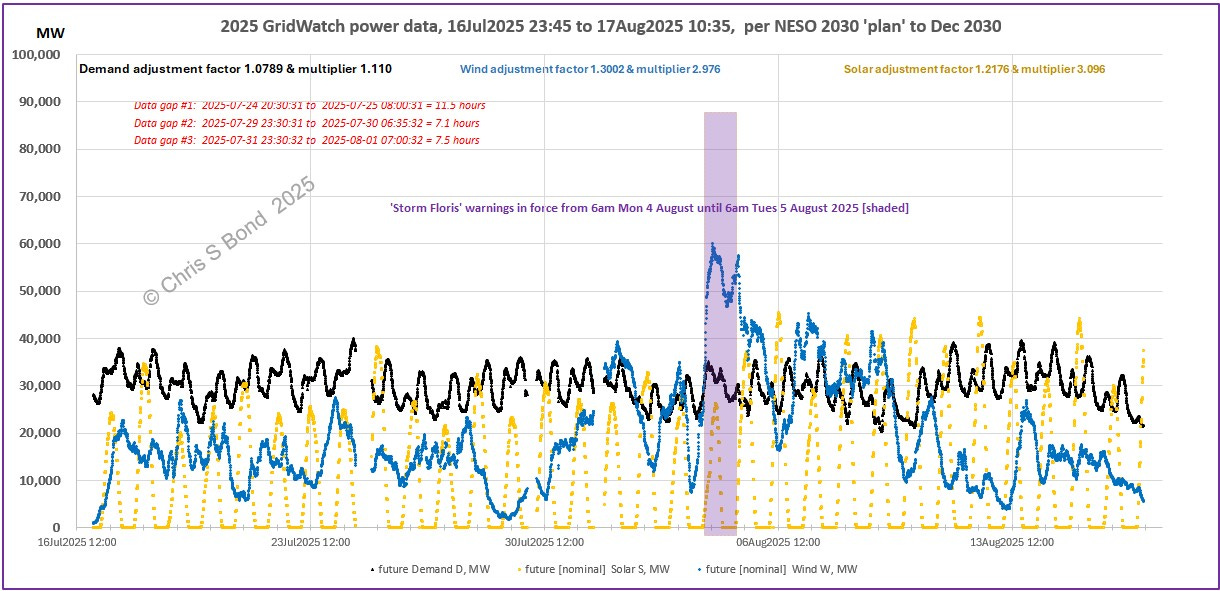
Solar peaks routinely burst up above the Demand plot [ultimate constraint triggered];
but there are extended intervals where Wind is less than or much less that Demand, so when the sun goes down the lights would go out [please don’t call these intervals ‘dunkelflaute’ in July-August: there’s nothing ‘dark’ about this season and these Wind lulls are far from uncommon in GB summers].
Figure 7: Future GB Imports / Exports; and Shortfalls:
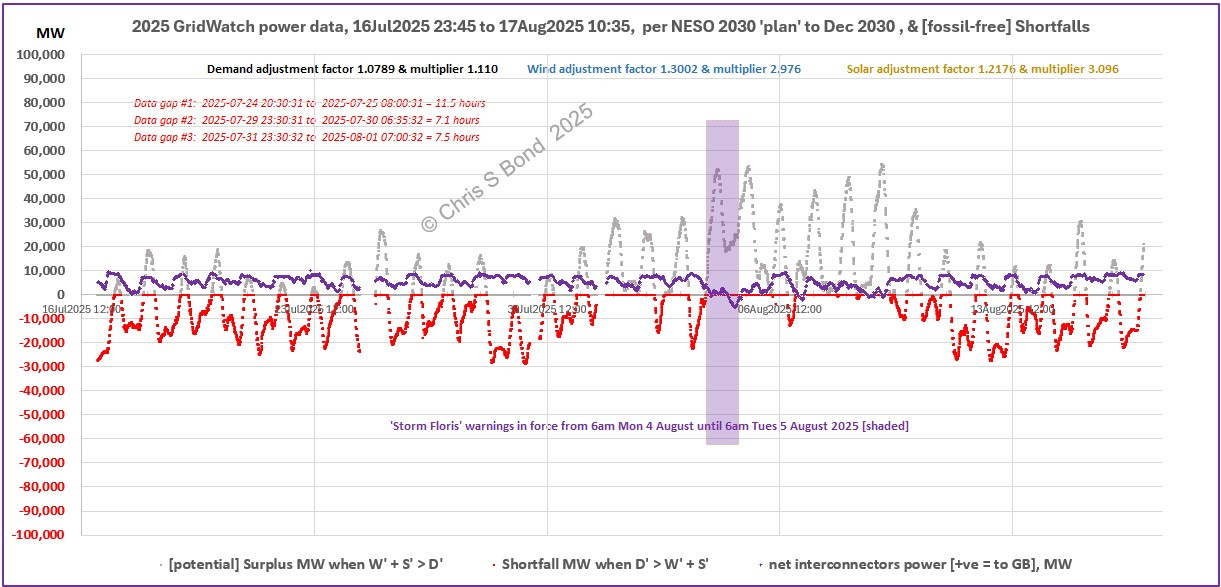
Unsurprisingly, for quite a lot of this period in July-August, GB would be struggling to keep the lights on unless we retained around 30,000 MW of fossil-fuelled generation capacity. Maybe an extra 5,000 MW of interconnector capacity could be built by the end of 2030 given more massive incentives by DNZ, but I really doubt our close neighbours are going to be able or willing to keep propping us up to anything like the extent needed to make Ed Milliband’s envisaged future numbers add up.
Figure 8: Future GB Shortfalls; and LDES:
Even if the existing energy storage fleet could cope with the MW energy flows [it couldn’t, as mentioned above] it doesn’t help much. Most nights it would go flat, but then at windy times it would fill up and stay full.
What if we doubled LDES capacity, i.e. added another 28,488 MWh of battery energy storage systems (BESS)? Then we’d get Figure 8A.
Figure 8A: Future GB Shortfalls; and 2 x LDES:
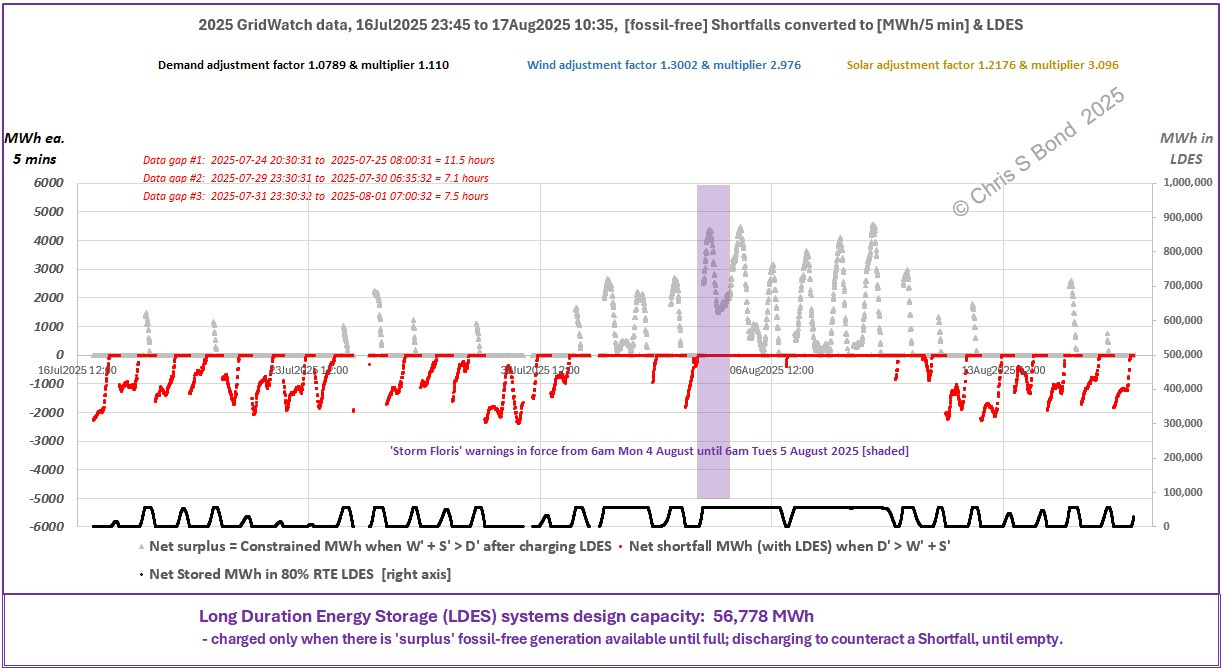
Not a huge difference from Figure 8, is it?
What would that mean financially, using as our basis the very current Statkraft Thornton project mentioned in the notes?
Our extra 28,488 MWh of additional storage energy capacity would be 28,488/400 times that project’s 400MWh, i.e. 71 times. Hence roughly 71 times its £150 million for additional battery energy storage.
Over £10 billion.
While all the time having to retain much of the fossil-fuelled generation capacity for those times when the Wind drops almost completely all across our interconnected region.
More evidence, I suggest, pointing to UK energy prices continuing to rise, regardless of politicians’ promises.
Copyright © 2025 Chris S Bond
Disclaimer: Opinions expressed are solely my own.
This material is not peer-reviewed.
I am against #GroupThink.
Your feedback via polite factual comments / reasoned arguments welcome.
I use the convention *capacity* to flag up that the nominal peak power rating bears little resemblance to the actual power generated by these facilities in the UK.
Load factor is defined by National Statistics publication Digest of UK Energy Statistics (DUKES) produced by the Department for Energy Security & Net Zero (DESNZ), see DUKES 6.3 [xlsx]: ‘Percentage of how much was generated compared to maximum possible generation - based on the average of capacity at the start of the year and capacity at the end of the year.’
Onshore Wind load factor [2024] 25.0%;
Offshore Wind load factor [2024] 36.3%;
Solar load factor [2024] 9.5% [note 1A]
1A - The pathetic low Solar capacity factor is why I don’t believe Solar in the UK is worthwhile. In the winter it hardly helps; in sunnier times it can force curtailment of Wind.
Reminder how much Wind and Solar *capacity* GB currently has. According to the Digest of UK Energy Statistics (DUKES 6.2) [xlsx] [Capacity of, generation from renewable sources and shares of total generation] as of the end of 2024 we have:
32,082 MW Wind, comprising;
16,166 MW Onshore and
15,836 MW Offshore
plus
18,280 MW of Solar PV
[plus tiny morsels of wave and tidal stream, which according to DUKES 6.2 provided 8 GWh of energy in 2024, or 13 GWh if you include electricity from the EMEC test facility, whatever that might be].
The data is available: for example, Statkraft’s ‘Thornton Greener Grid Park’ near Thornton in East Yorkshire has rated power 200MW and storage capacity 400MWh (i.e. maximum 200MW power for up to ~2 hours). Expected to be operational in Autumn 2025, at an investment cost of £150 million [i.e. project cost 0.75 million per MW / £0.375 million per MWh].
Interesting analysis, but why so much talk of the lights going out and government's plan failing without dispatchable generation, when government's plan (Clean Power 2030) is very clear about maintaining our fleet of dispatchable generation to ensure security of supply?
There is c8.5GWh of battery storage now connected to the grid from an installed capacity of 5.6GW. This will increase further during current qtr with some significant additions now in commission.
Despite reduced installation costs the economics of it are still finely balanced and it only comes into own when the system price is supressed by high renewable output which is highly variable as this article demonstrates.