

Northern Europe Reality
The wide-area Wind lull of early November 2024 casts doubt on the wisdom of ever more interconnectors

Notes:
Click the graphic at the top of the email to transfer to the Substack post. There, you can zoom any of the charts that are in ‘gallery view’ simply by clicking on them.
For a change, this post has more charts and less text.
Summary
Many commenters remarked the long-lasting Wind lull of early November 2024. The existing fleets of Wind farms across Northern Europe constitute an extremely large real-scale reality test for plans for ever-increasing interconnection to provide energy security.
From this real-world data, if all you have is Wind and Solar and interconnectors, there will be times when you and your neighbour countries will watch your lights go out in unison.
Introduction
I used recent GridWatch data for GB power production to produce Figure 1. Many people observed and commented on the fact that power generated by Wind (the green chart) dropped below about 5 GW from mid-01 Nov and stayed low or very low almost continuously until mid-10 Nov. Meanwhile, Solar PV (the yellow chart) peaked at around 1-2 GW each of those days - and was, of course, zero each and every night - because this country was blanketed in cloud.
This whole period was called a ‘Dunkelflaute’ by many, but I regard these Wind lulls as being too common to deserve a special name.
Figure 1: GB Power Generation, 01-15 November 2024:
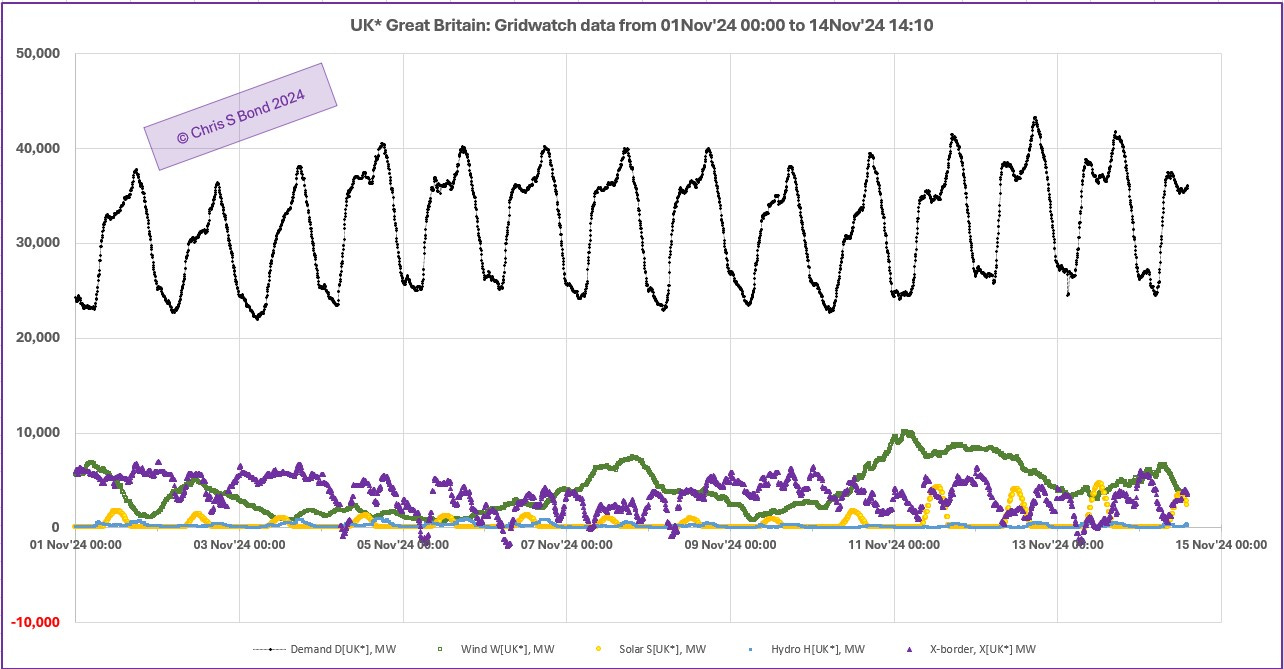
The purple chart shows the net cross-border power flow: this was high and positive (denoting net import of power) for much of the period, keeping our lights on. This seems perilously anti-energy-security, especially in light of the mystery ‘failure’ of two undersea fibre-optic communications cables in the Baltic Sea on 18 November.
Northern Europe Data
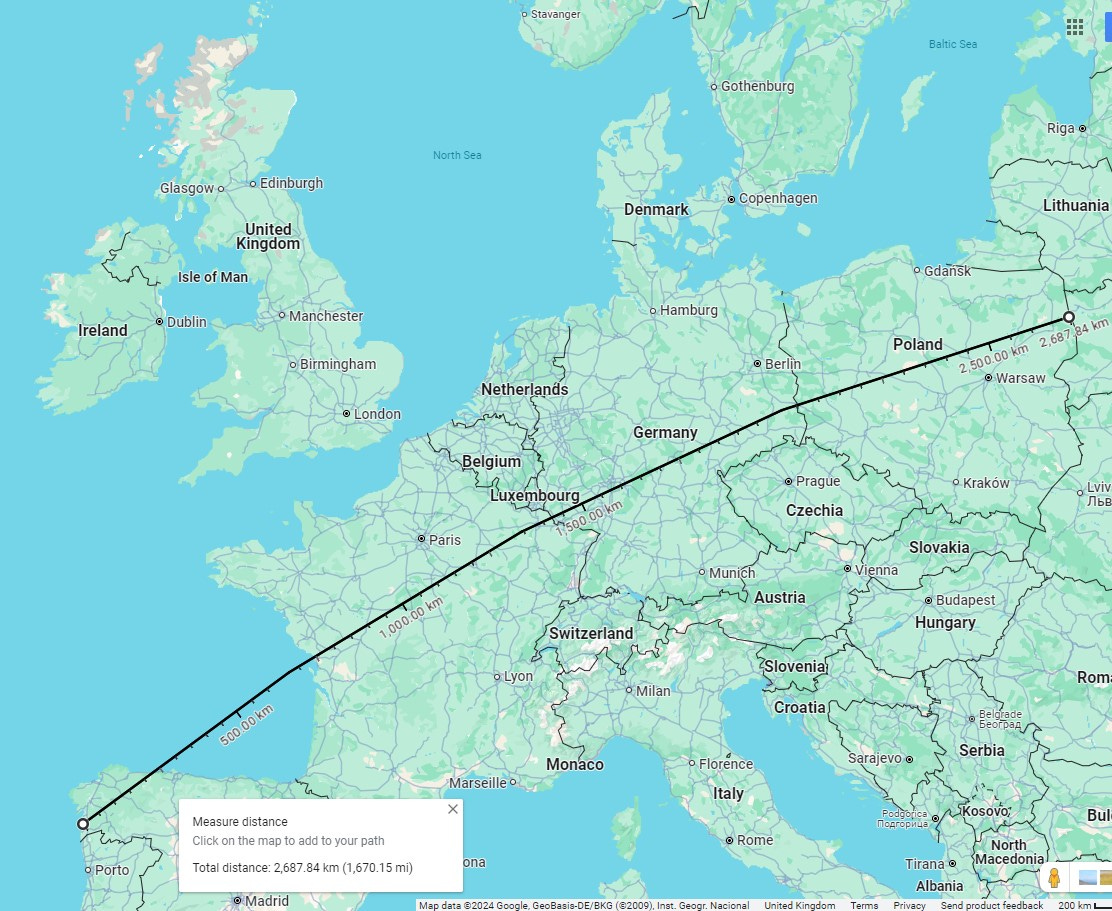
This made me wonder what the data from across Northern Europe could tell us. Rather than EU27, I decided to focus on the countries mostly shown in Figure 2, but allowing for possible weather-blocking effects of the major mountain ranges - the Pyrenees and the Alps - as well as sheer distance from the UK.
Figure 2: The Countries of Northern Europe:
This gave me the following list of countries, for which I grabbed Energy Charts plots all for the first half of November. For these plots I selected Load (Demand); Hydro (excluding pumped storage1); Wind; Solar; and Cross-border power flows.
AT Austria
BE Belgium
CH Switzerland
CZ Czech Republic
DE Germany
DK Denmark
FR France
NL Netherlands
NO Norway
PL Poland
SE Sweden
as well as UK* Great Britain.
I excluded LU (Luxembourg) as it is tiny, with little Wind or Solar, and relies heavily on power imports. Ireland was in the same lull as GB.
Figures 3: AT (Austria) thru DK (Denmark):


Figures 4: FR (France) thru SE (Sweden):


Summarising from all the charts in Figures 3 and 4:
Austria: low Wind from around 03Nov through 14Nov;
Belgium: very low Wind the whole period except 12Nov;
Switzerland; Czech Republic: have little Wind generation capacity;
Germany: low to very low total Wind the majority of the period;
Denmark: low to very low Wind from around 05Nov through 13Nov;
France: low Wind except on 12Nov but didn’t care because it’s got its nuclear fleet and was strongly exporting to neighbours to keep their lights on;
Netherlands: low to very low Wind except on 11-12Nov;
Norway: low Wind from around 04Nov through 12Nov but didn’t care because it’s got its hydro fleet and was exporting to neighbours to keep their lights on;
Poland: low Wind from around 04Nov through 14Nov;
Sweden: Wind mostly kept generating, but when it didn’t around 10-12Nov, Hydro stepped up; all the while Sweden was a net exporter.
And from Figure 1:
UK*: Wind below about 5 GW from mid-01 Nov, low to very low until mid-10 Nov.
*****************************
Testing my theory regarding the effects of mountain ranges, I also looked at the data for Spain, Portugal and Italy, see Figures 5.
Figures 5: ES (Spain), PT (Portugal) and IT (Italy):


Summarising as before:
Spain: low-ish Wind from 01Nov through 09Nov, then Wind picks up significantly;
Portugal: highly variable Wind throughout the period;
Italy: mostly low Wind from 01Nov until ~14Nov.
So it seems my theory re: mountain ranges is incorrect. Spain and Italy had very similar patterns of Wind lulls: only Portugal was the exception.
Conclusions
The data for the first half of November 2024 clearly demonstrates that the Wind lull many of us experienced can cover wide areas of Northern Europe for ~1 to 2 weeks.
I have recorded multiple intervals of Wind lulls over the last four years of GB data with simultaneous lulls some in European countries, but this is the first time I have captured this data in detail. I don’t believe there was anything special about this period.
Hence relying solely on Wind + Solar + interconnectors would inevitably lead to periods of time when the lights would go out across Europe… unless dispatchable generation capacity ~ equal to full Demand / Load is retained in perpetuity, with all the costs that entails.
Continuing to install ever more Wind + Solar capacity and perhaps a few more interconnectors, as appears to be HM Gov’s ambition, makes the UK more reliant on the kindness of neighbouring countries. However, it seems increasingly possible those other countries will decide to keep the benefits of their investments in dispatchable power generation for their own citizens. This, quite apart from the risk of damage by unfriendly states to under-sea infrastructure.
Energy security? I don’t think so.
Copyright © 2024 Chris S Bond
Disclaimer: Opinions expressed are solely my own.
This material is not peer-reviewed.
I am against #GroupThink.
Your feedback via polite factual comments / reasoned arguments welcome.
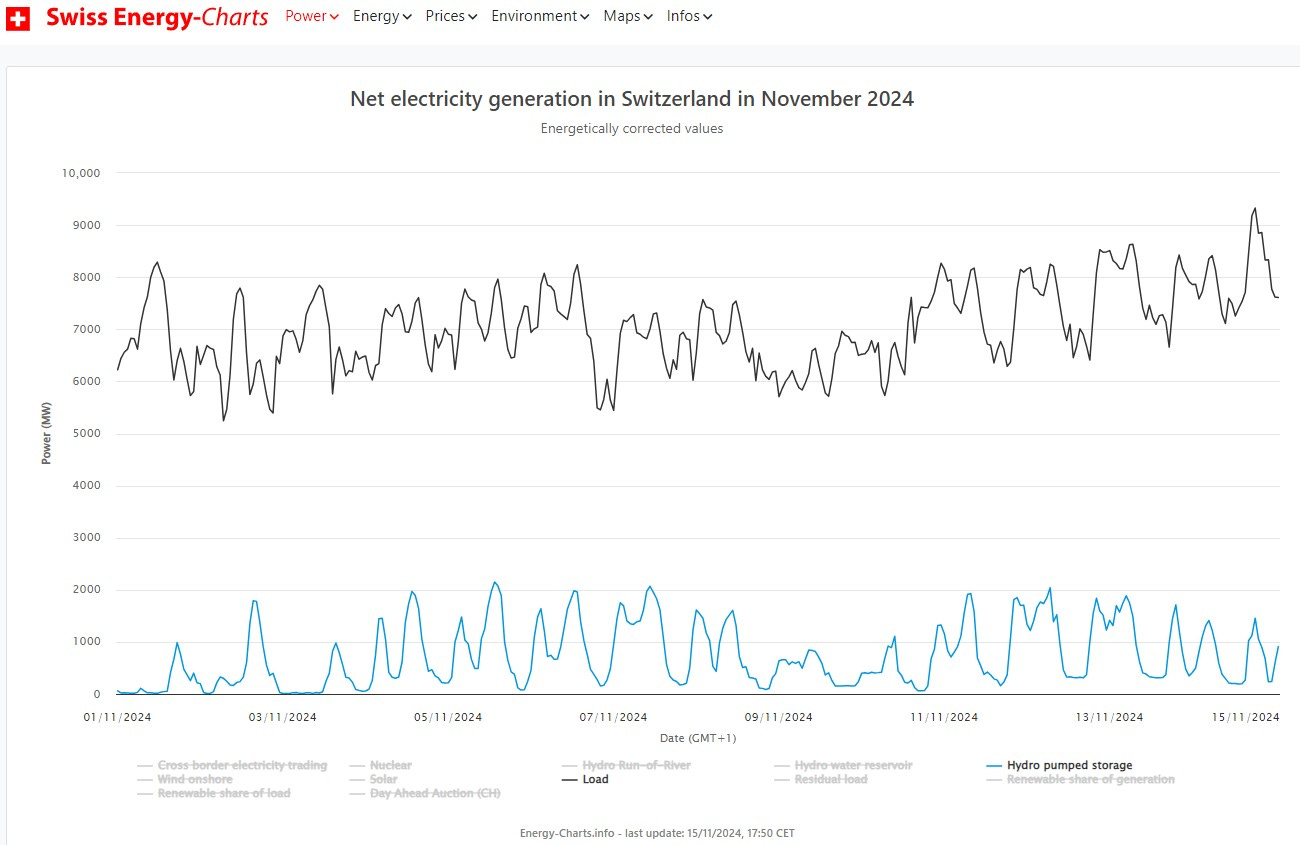
Pumped Hydro is excluded because it is a net sink for electrical power… except in Switzerland where it shows up continuously as a positive source.
Perhaps this is why Switzerland is so rich? Because, according to the Energy-Charts data, it employs perpetual motion machines across its fleet of pumped hydro storage schemes:
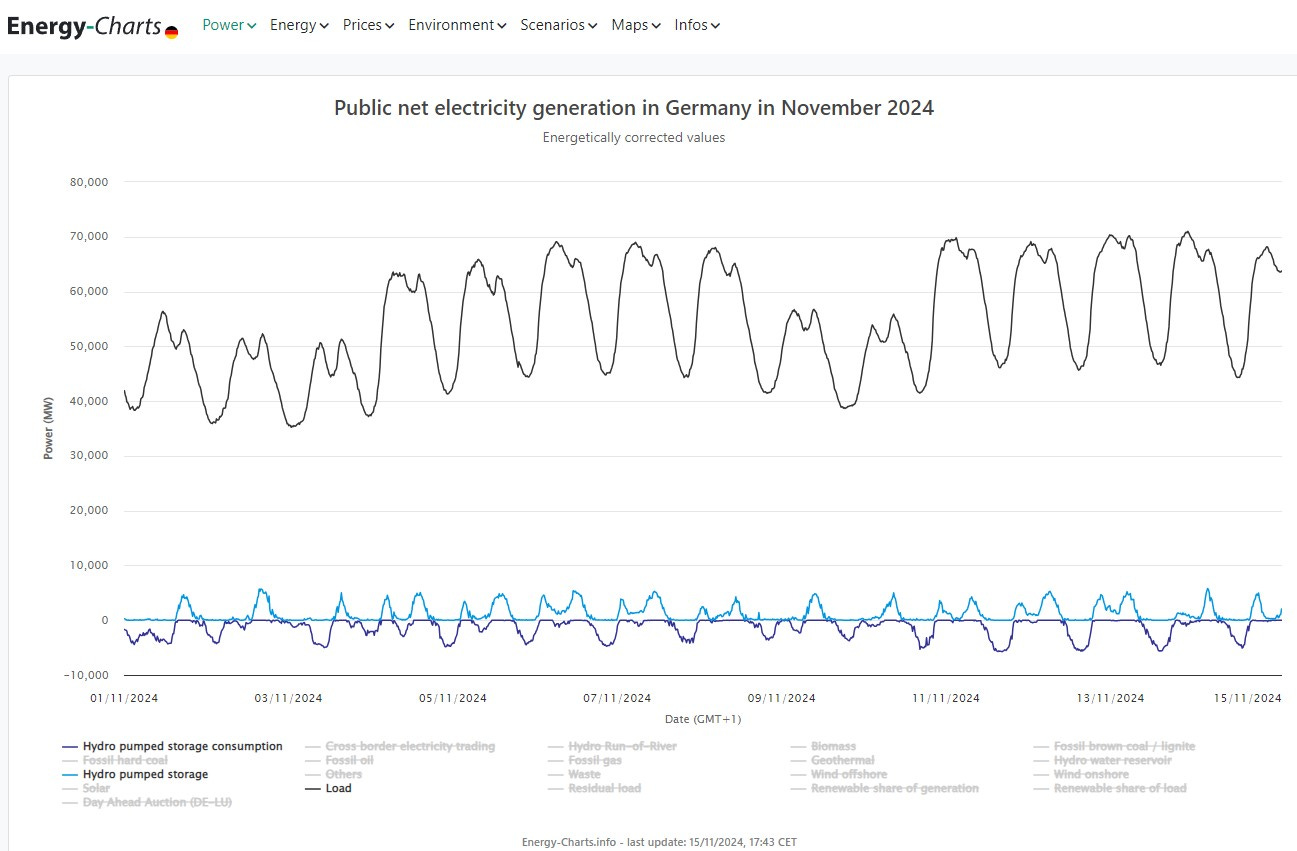
By contrast, Germany (and all other countries I’ve looked at via Energy-Charts that have pumped hydro) account for the energy required to pump the water back up the hill(s):
Undersea interconnectors can’t be quickly repaired or replaced if damaged: In 2021 one of the cables between France and the UK was damaged, and at that time repairs were expected to take 2 years to complete (I don’t know if that turned out to be accurate).
https://news.sky.com/story/fire-damaged-power-link-will-not-be-fully-restored-for-two-years-says-national-grid-12434131
Also, we know there is multi year variability in wind patterns, therefore even if everything were fine today there’s no guarantee there won’t be blackouts in 5, 10 or 20 years.
https://www.manhattancontrarian.com/blog/2023-9-28-a-semi-competent-report-on-energy-storage-from-britains-royal-society
The spectre of power failure is haunting Europe because the meteorologists never warned us about wind droughts called Dunkelkfautes in Europe that sailors at sea and millers on land must have known about for centuries.
https://www.flickerpower.com/images/The_endless_wind_drought_crippling_renewables___The_Spectator_Australia.pdf
A warning from The Energy Realists of Australia
Around the Western world subsidised and mandated wind and solar power is displacing conventional power in the electricity supply. Consequently most of the grids in the west are moving towards a tipping point where the lights will flicker at nights when the wind is low.
The root of the problem is the failure of the meteorologists to give warning of wind droughts and the failure of energy planners to check the wind supply.
Consider the ABC of intermittent energy generated by wind and sun.
A. Input to the grid must continuously match the demand.
B. The continuity of RE is broken on nights with little or no wind.
C. There is no feasible or affordable large-scale storage to bridge the gaps.
So the green transition is impossible with current storage technology.
The rate of progress towards the tipping point will be accelerated by the surge of demand due to AI.
In Australia the transition to unreliable wind and solar power has hit the wall because we have reached the point where we can’t afford to lose any more coal capacity or the lights will flicker every night when the wind is low!
https://newcatallaxy.blog/2023/07/11/approaching-the-tipping-point/
Britain, Germany and South Australia have passed the tipping point and entered a red zone, keeping the lights on precariously with imports and deindustrialization to reduce demand.
The meteorologists and energy policy planners in Europe missed the Dunkelflautes that must have been known to mariners and millers for centuries!
https://www.flickerpower.com/images/The_endless_wind_drought_crippling_renewables___The_Spectator_Australia.pdf
https://quadrant.org.au/news-opinions/climate-change/no-gusts-no-glory/
Demand urgent high-level inquiries to find out why the meteorologists failed in their professional duties and how energy planners managed to get away with out checking the wind supply. Imagine embarking on a major irrigation project without forensic investigation of the water supply including historical rainfall figures.
Briefing notes from The Energy Realists of Australia
https://www.flickerpower.com/index.php/search/categories/general/list-of-briefing-notes