Over-Abundant Wind
GB power generation during Storm Darragh, 07 December 2024

A quick snapshot, but illustrating some useful points.
Currently parts of the UK are under varicoloured high Wind warnings from the Met Office while ‘Storm Darragh’ batters our islands.


The weather system is moving from west to east and so will eventually affect the whole of GB’s large-scale weather-dependent power generation system. But as of now (11:30am GMT 07Dec2024) it is mainly hitting the west as shown in the Met Office’s map.
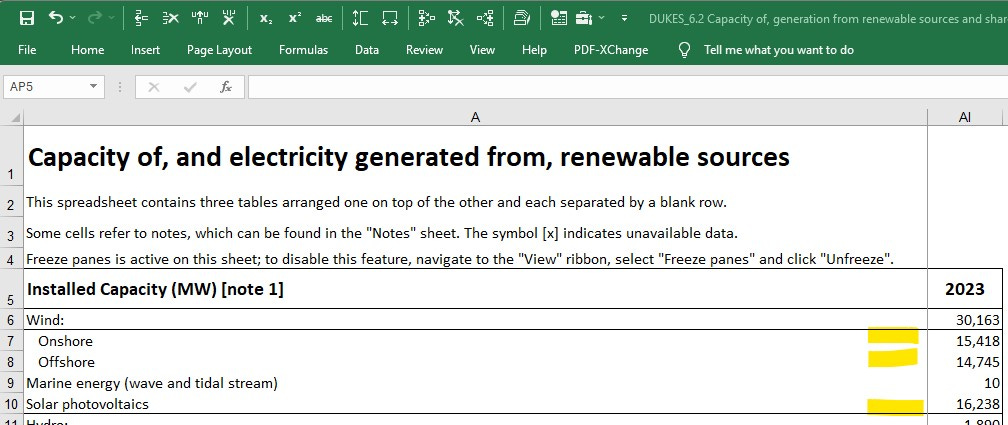
How much Wind and Solar *capacity* does GB have currently? According to the latest release of the Digest of UK Energy Statistics (DUKES) 6.2 [Capacity of, generation from renewable sources and shares of total generation] we have a total of:
30,163 MW Wind, comprising;
15,418 MW Onshore and
14,745 MW Offshore
plus
16,238 MW of Solar
and a tiny morsel of wave and tidal stream, which according to DUKES 6.2 provided 12 GWh of energy in 2023, at a load factor1 of 13.7%
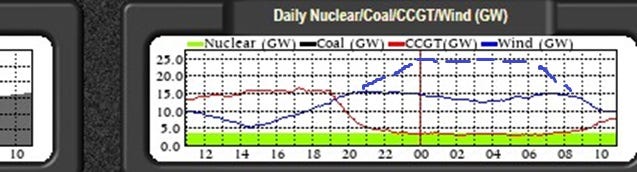
And what power generation are we getting from that installed fleet? Per Gridwatch at 10.55 today:

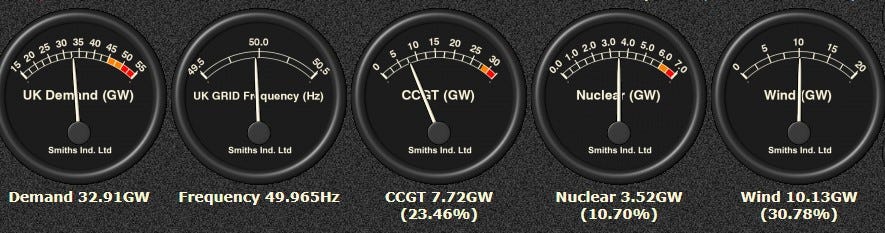
approximately 10GW i.e. 10,000 MW i.e. ~33% of Wind capacity is being productive;
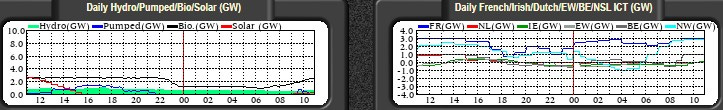
and we are getting half of sweet b*gger-all from Solar [red line, left chart - if you can spot it];
but we are being propped up massively by mainly French and Belgian Nuclear plus Norwegian Hydro [right charts] via interconnectors [long may they remain undisturbed by dragging anchors].
Wind has been throttled right down [the blue line on the right chart, mostly level since about 20:00 yesterday at about 15GW, then reduced to about 10GW at 09:00 today, presumably to protect many Wind turbines from spinning themselves to destruction]:
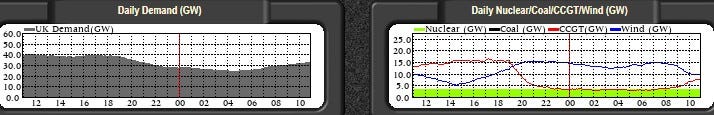
That 12-hour interval where Wind was held at 15GW gives an indication of what’s to come as HMGov spends increasing amounts of our money pursuing its energy ‘Mission’ [or is it now an ‘ambition’ / ‘target’ / ‘aspirational goal’ / whatever flexi-word is being used this week?]
Because by 2030 [don’t laugh] per HMGov’s ‘Mission’ when GB will have 4 times the Offshore Wind *capacity*, 2 times the Onshore Wind *capacity* and 3 times the Solar *capacity*, there will just be many more intervals when ‘renewable’ sources of power would have to be curtailed like this [at great expense to us] to preserve grid stability.
But what about electricity storage?
Let us assume electrical energy storage was available today [it doesn’t yet exist at sufficient scale at low enough price]. What could have happened between 20:00 yesterday and 08:00 today if extra schedulable Demand from battery storage facilities was available?
Let us further assume that Windmills only had to be constrained to protect them from spinning themselves to destruction when the Wind speed got *really* high, maybe by around 05:00 today.
Then maybe that Wind chart would have kept climbing to ~25GW as sketched with the dashed line here:
The area under that dashed line indicates the quantity of energy storage needed to capture that Wind energy: roughly 7 hours at roughly 10GW i.e. ~70,000 MWh.
The four pumped hydro schemes in the UK have combined power capacity of just under 2.8 GW and have sufficient storage capacity to keep storing energy for that 7-hour period of time - if they all started the interval sufficiently empty.
But what about the other 7GW = 7,000 MW also for ~7 hours?
Batteries?
There’s the ‘Lakeside facility’ at Drax, 100MW/200MWh (i.e. maximum 100MW power for up to ~2 hours);
Statkraft’s ‘Thornton Greener Grid Park’ near Thornton in East Yorkshire, 200MW/400MWh (i.e. maximum 200MW power also for up to ~2 hours).
Expected to be operational in Autumn 2025, at an investment cost of £150 million (that’s a project cost of 0.75 million per MW / £0.375 million per MWh);
and various others.
On the basis of that Statkraft project:
Our required 7,000 MW additional storage power capacity would be around 35 times the Thornton project’s 200MW power capacity.
That would give up to 2 hours storing electricity before it became full.
So 35 times the power, and 7h/2h i.e. 3½ times to get the storage MWh needed.
That’s 35 x 3.5 ~ at least 122½ Thorntons [it would be more because battery systems cannot be fully charged / discharged without wrecking cell life].
So GB would have to add at least 122½ x £150 million for additional battery energy storage schemes - over £18 billion - to enhance the power capacity and energy storage capacity of the four pumped hydro schemes. All to be able to capture just that short surge of Wind energy. Of which around 80% could be released back to the grid again once accounting for round-trip efficiency losses.
Alternatively, we will keep paying more and more for curtailment.
While all the time having to retain much of the fossil-fuelled generation capacity for those times when the Wind drops almost completely all across our interconnected region.
Either way, it all points to UK energy prices continuing to rise, regardless of politicians’ promises.
Wrap up warm and stay safe, people!
Copyright © 2024 Chris S Bond
Disclaimer: Opinions expressed are solely my own.
This material is not peer-reviewed.
I am against #GroupThink.
Your feedback via polite factual comments / reasoned arguments welcome.
Load factor is defined by DUKES as: ‘Percentage of how much was generated compared to maximum possible generation - based on the average of capacity at the start of the year and capacity at the end of the year.’
Wave and tidal stream load factor [2023] 13.7% [note 1B]
For comparison, and on the same basis:
Onshore Wind load factor [2023] 24.6%;
Offshore Wind load factor [2023] 39.5%;
Solar load factor [2023] 10.2% [note 1A]
1A - The pathetic low Solar capacity factor is why I don’t believe Solar in the UK is worthwhile. In the winter it hardly helps; in the sunnier times it often forces curtailment of Wind.
1B - Wave and Tidal Stream has been ‘the next greatest thing’ in the UK for at least the last five decades, ever since Salter’s Duck. It keeps being resurrected. Millions of pounds of ‘start-up’ funding, often from public bodies spending tax-payers’ money, have been poured into schemes which after the money is spent seem to disappear back beneath the waves. To me, the evidence is clear: 10MW installed *capacity* in 2023 averaging under 1½ MW.
On energy storage, Britain's electricity grid has approx 29GWh capacity comprising 27GWh of pumped hydro + ~2GWh of batteries.
We've approx 47,000GWh of natural gas storage comprising >34,000GWh of underground (gaseous) storage + 13,000GWh of LNG storage.
https://www.ofgem.gov.uk/sites/default/files/2024-01/GB%20Gas%20Storage%20Data%20January%202024.pdf
Often overlooked is the fact that electricity transmission cables store zero, whilst our natural gas transmission pipework stores >4,000GWh.
Only one windmill has reported on REMIT that it output would be restricted due to ambient conditions but doesn't mean a stash of them didn't manage it by setting FPNs to zero before gate closure. Also the centre of the depression tracked across Hornsea earlier reducing that to c10% of rated output this morning but as its tracked further East Hornsea has picked up again. The main issue as usual is transmission constraints from Scotland to England. Its pretty surprising no one has really majored on what an utter fiasco this is and how OFGEM thwarted NGs plans for years to increase transmission capacity. They've now flipped the other way and are authorising the Great Grid Upgrade wholesale without waiting to ensure whether anymore windmills are actually going to be built thus adding even more cost to consumer bills.
Anyhow thanks for producing the post.