

Tesla's “Master Plan Part 3”
Comments & Perspective

Summary
On April 5th, 2023 the Tesla Team released the Master Plan Part 3. It is not a plan, it is a feasibility study. It contains lots of numbers, but does not give any sense of the scale of change envisaged. Hence in this post I add some of that missing context.
The basis of the Plan is 4 years of real data – good
This data is from only the USA but the Plan extrapolates to draw global conclusions – bad
The Plan ideologically rules out new nuclear power generation – hard to believe
The end-point of the Plan appears technically achievable but at truly enormous cost. That cost is contrasted with the continuing cost of fossil energy as if it is a choice of switching off one and switching on the other, which is false.
The immense changes proposed by the Plan throughout the global Energy sphere do not represent a quick fix. The plan also does not touch upon the political challenges of getting nearly 200 sovereign states to go along with it, nor upon the enormous changes in occupations and infrastructures required to implement it.
“Plan” or “Feasibility Study”?
A dictionary definition of a plan is:
"a set of decisions about how to do something in the future"
A dictionary definition of a feasibility study is:
"an examination of a situation to decide if a suggested method, plan, or piece of work is possible or reasonable"
The “Master Plan Part 3” examines whether the world could operate mostly on renewable energy resources and concludes: yes it could. It says nothing about the decisions about how to get there. Therefore, it is a feasibility study not a plan. But I will continue to refer to it in this post as a Plan for clarity.
Master Plan Part 3 Energy Basis
The Master Plan Part 3 uses energy units that are probably unfamiliar to the general reader. For example, the current global energy flows are given in units of ‘PWh/year’ in Figure 3, reproduced below.
Tesla Master Plan Part 3 - Figure 3: Global Energy Flow by Sector
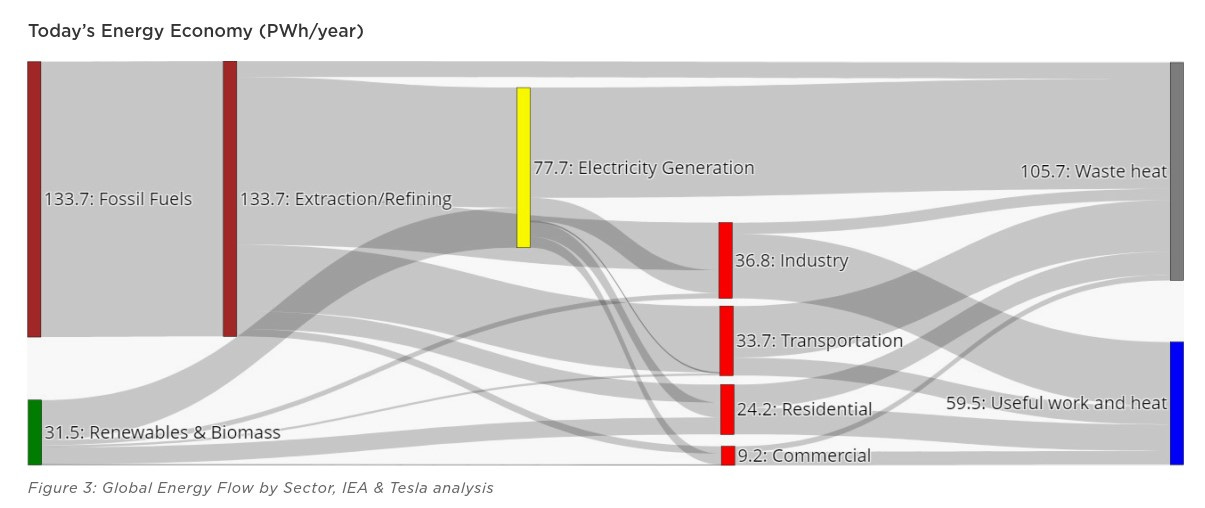
It states that 59.5 PWh/year of useful work is derived from 165.2 PWh/year of energy inputs, an overall conversion rate of only 36%. This is entirely credible, thermodynamics of combustion processes being what they are. The Plan states that converting many of the thermal processes we currently rely upon in our daily lives to electrical replacements, will bring overall efficiency much higher: this is also entirely credible. Ergo, the Plan concludes we will be able to do more with less. Credible, but “how” and “eventually” are unstated.
Figure 2 of the Plan - reproduced below - summarises this future sustainable state using energy units of TWh and TW.
Tesla Master Plan Part 3 - Figure 2: Estimated Resources and Investments Required
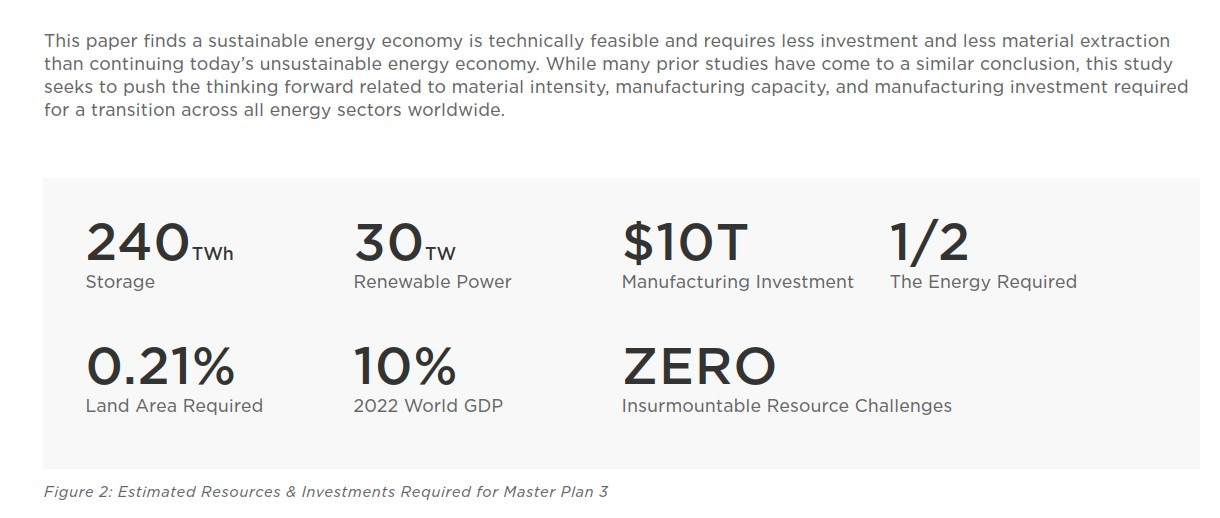
The Plan estimates the total cost to get there at $10T (10 trillion; ten million million; 10,000,000,000,000) US Dollars. I have no way to fact-check that number so I’ll go with it. $1 trillion in $100 dollar bills would be a stack 631 miles [around 1,000 km] high.
10 times that is a LOT, even in post-Covid times.
The plan states in Figure 16: Investment Comparison that “20 years of investment in fossil fuels at 2022 rate” totals USD 14 trillion, contrasted with “20 years investment in Sustainable energy economy” totalling USD 10 trillion. This is not an either/or decision, however. As various countries and even US states are finding, increasing renewable generation *capacity* without maintaining sufficient fossil-fuelled (or nuclear) reserve generation reduces energy security. Hence a substantial proportion of that USD 14 trillion will have to continue to be spent as any transition to all-renewables costing the additional USD 10 trillion happens. Or the lights will go out, people will die as they did in Texas in February 2021, and rebellions will likely start.
We can all understand ½ the energy, and that makes sense because of the higher efficiency of electrical instead of thermal processes. 0.21% of land area, 10% of world GDP, ok, I’ll take Tesla’s word for those numbers. Similarly for “ZERO insurmountable resource challenges”.
But what do those energy numbers mean?
In my substack posts I have tried to keep things human-scale by using energy units that the person on the street can hopefully visualise. These are: megawatts (MW) for power flows and megawatt hours (MWh) for amounts of energy. For example, a modern vehicle service station might have twenty electric vehicles (EVs) each charging at 50 kW, totalling 1 MW of power demand. If they all charged for one hour, they would have stored 20 x 50 kWh = 1 MWh collectively in their batteries (and would all be fully-ish1 charged).
So, what is a Petawatt hour (PWh) of energy? It is 1,000,000,000 megawatt hours (MWh). Staying with the example of EVs for a moment, 1 PWh of energy could charge 20 x 1,000,000,000 = 20 billion EVs. There are currently ~1.1 billion passenger cars in the world. If every one of them was an EV, 1 PWh would fully-ish charge every one of them about 18 times over.
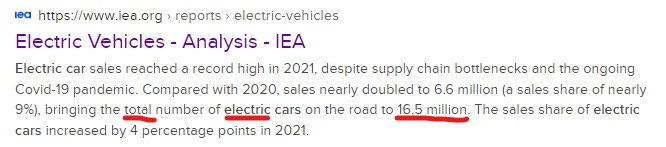
In fact the number of fully electric vehicles on the roads as of 2021 is 16.5 million, according to the IEA:
Instead of energy stored in billions of virtual EVs, let’s compare 1 PWh to the output of the largest US nuclear power plant, the 4,000 MWe capacity Palo Verde generating station pictured below.
The Palo Verde Generating Station
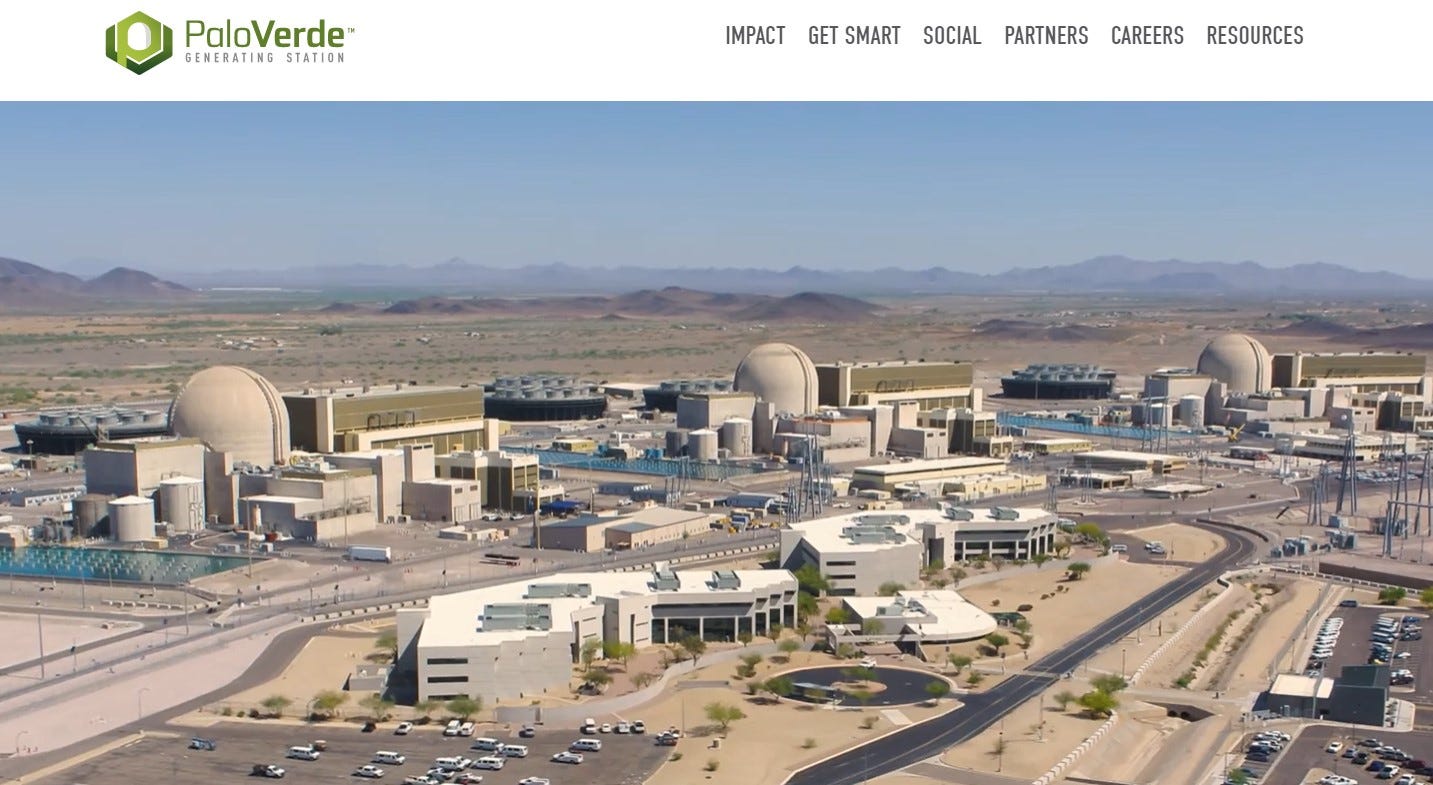
That produces about 32 million megawatt-hours annually.2 About 31 Palo Verdes would provide 1 PWh in one year. The Tesla Plan’s 59.5 PWh of ‘useful work and heat’ would require 1,859 Palo Verdes.
A visual representation of that? A grid 43x43 would have about the right number of images - 1,849 - each quite tiny.
Alternatively, every country recognised as a country by the UN – all 193 of them, including some that are less than stable – would each need around 10 Palo Verdes to satisfy the demand for 59.5 PWh of ‘useful work and heat’. Here they are, scaled to fit across this page.
Each UN Country’s Allocation of 10 Palo Verdes:

…
Ah, but wait: the Tesla Master Plan Part 3 explicitly rules out new nuclear in Table 5 Generation Technologies Evaluated. Exactly WHY is not explained in the document.
Energy Requirements in the Plan
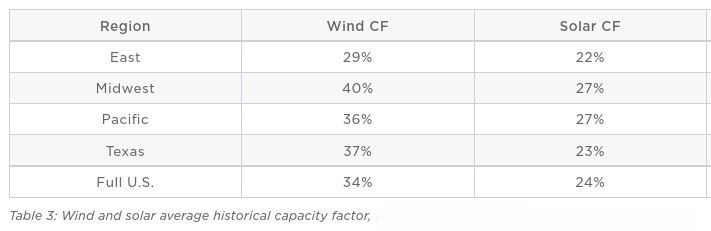
Figure 2 of the Plan shows the requirement for 30 TW of ‘renewable power’, that is 30,000,000 (thirty million) megawatts (MW). The Plan makes clear that this is a mix of Wind and Solar PV, optimised within the Tesla model to minimise overall cost. The Tesla report includes Table 3 showing the average capacity factors as measured in four regions of the USA.
Tesla Master Plan Part 3 - Table 3: Wind and Solar Average Historical Capacity Factors
Comparing these numbers with the UK’s fleet of Wind (Off- and On-shore) and Solar PV capacities according to HM Gov’s Digest of UK Energy Statistics (DUKES) 6.2:
Installed Capacity as at the end of December 2021:
Total Wind: 25,748 MW (Onshore 14,492 MW, Offshore 11,255 MW)
Solar PV: 13,965 MW
i.e. Total UK Wind + Solar PV = 39,713 MW
That means the Plan’s 30,000,000 MW is ~750 times the UK’s entire fleet.
The UK’s development of Wind only really got going in 2008, when “The EU sets the UK government a target to increase the contribution of renewables to UK electricity to 20% by 2020 ...”. Also note, “The United Kingdom is the best location for wind power in Europe and one of the best in the world. By 2023, the UK had … the sixth largest capacity of any country.”
With all the UK’s Wind riches it’s taken 15 years to get to where we are now: ‘enjoying’ some of the highest electricity prices in Europe while £ hundreds of millions each year are paid to suppliers to constrain their output when the grid system has insufficient demand and/or transmission capacity.
Euro Area Electricity Prices Feb’23
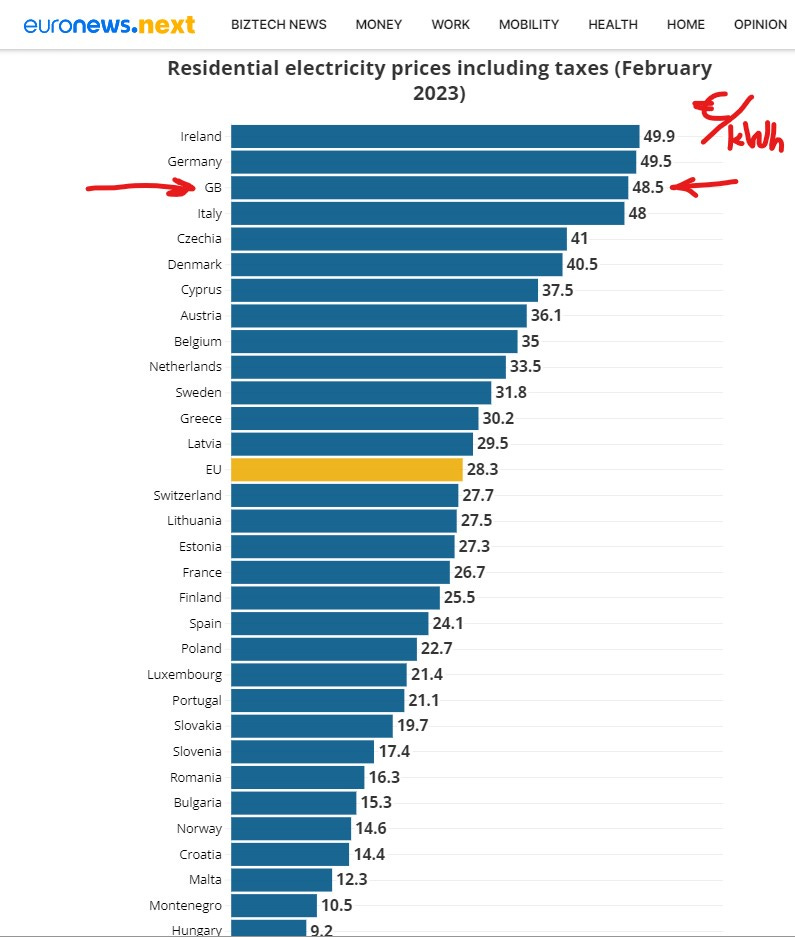
Over the last whole year (2021, when the weather gods were not particularly kind) for which DUKES has published information, Wind supplied 21.0% and Solar PV supplied 3.9% shares of total GB electricity generation. Even in 2020 when the weather gods smiled on Great Britain, the shares were only 24.2% and 4.1% respectively.
Of course, some parts of the world are blessed with far more sunshine than the UK. I used to assume that somewhere like California – the “Golden State” – would be an ideal location for Solar PV. Then I looked at the detailed data from CAISO. That shows that even California is dreaming if it thinks that renewables alone will keep the lights on and the air-con humming.
Anyway, if we distribute the Plan’s 750 times the UK’s total fleet of renewables across the UN’s 193 countries, they each need 750/193 = nearly 4 times the UK total (Wind + Solar PV) *capacity*.
They would need to adjust for their specific capacity factors, of course, because local actual capacity factors make a lot of difference: compare the UK averages below to the USA’s.
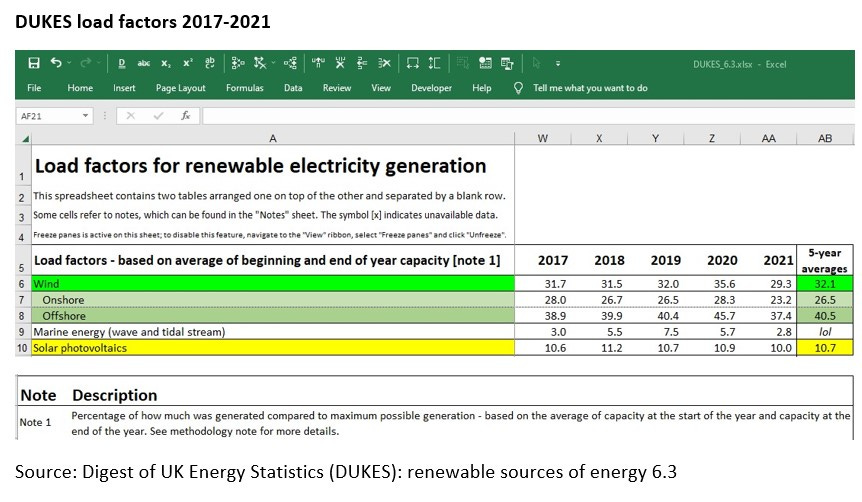
UK 5-year average historical capacity factors are shown below:
Wind Onshore 26.5%
Wind Offshore 40.5%
Solar PV 10.7% [Note this is around four tenths the Plan’s average of US Solar PV]
Historic Load Factors for GB Wind and Solar, 2017-2021
Energy Storage Requirements in the Plan
Figure 2 of the Plan shows the requirement for 240 TWh of energy storage. From Table 6 it appears this is extrapolated from the USA analysis and is split between hydrogen (the great majority), plus thermal and electrical storage.
Tesla Master Plan Part 3 - Table 6: Model results for US only
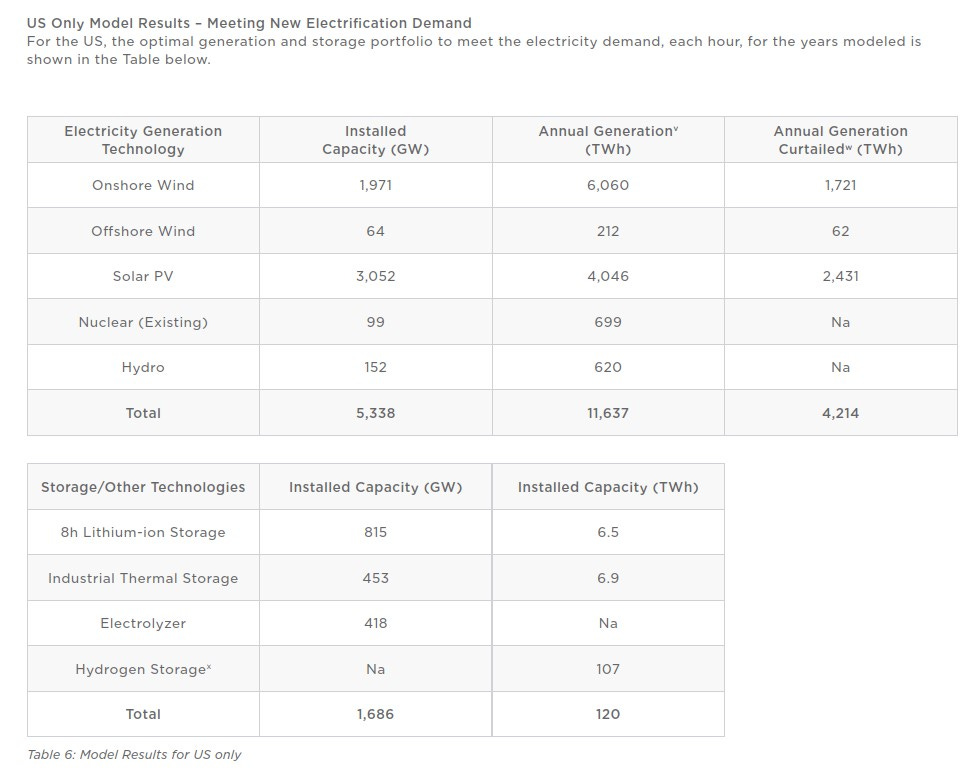
The total from the lower right ‘Installed Capacity (TWh)’ column of that table is doubled to give the global requirement of 240 TWh cited in Figure 3 of the Plan.
There are many ways to produce hydrogen, one of which - in theory at least - is to use surplus electrical power from renewable generation to split water molecules into their constituent hydrogen and oxygen. However, ‘renewable’ power is not automatically a planet-saving ‘good thing’. As reported by Hydrogen Insight (scroll to the table near the end of that post) the IEA has defined how ‘green’ hydrogen will be, depending on what specific technology is used to produce it. In the US this will determine how eligible different ‘hydrogens’ are for subsidies under the so-called ‘Inflation Reduction Act’. Perhaps more importantly, it sets objective standards for the ‘greenness’ of hydrogen, a welcome injection of fact into the ‘let’s use hydrogen for everything’ lobby-fest.
Even if sufficiently low-carbon power can be sourced, you need more than just electrolysers to produce hydrogen. They need process plant around them, and the product hydrogen will usually need to be compressed before it can be economically stored. Only salt caverns can provide meaningful volumes capable of withstanding the high pressures needed, and the deep salt strata geology for these does not occur in all areas of the world.
Example Proton Exchange Membrane (PEM) Electrolyser Hydrogen System
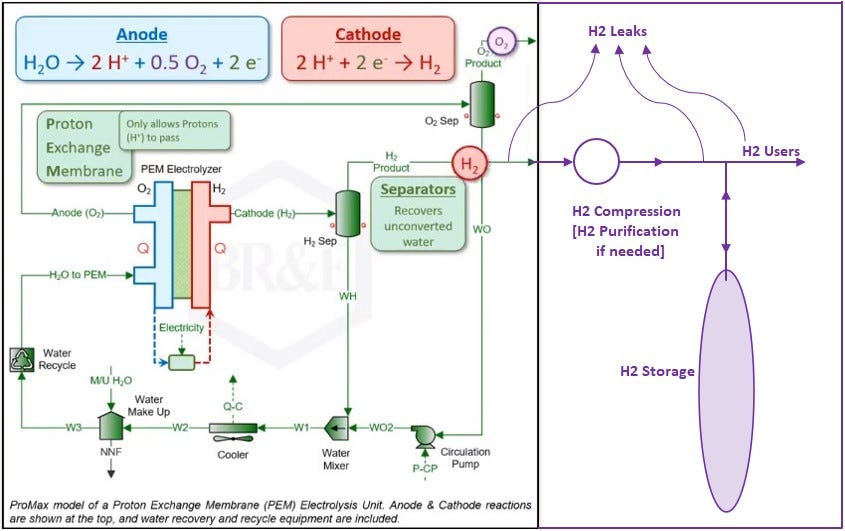
Hydrogen is far more flammable / explosive than methane and relatively very little energy is needed to ignite a hydrogen escape. The tiny hydrogen molecules can leak from a system which with any other gas would be leak-tight. Hydrogen can also cause rapid deterioration of steel containment unless it is designed specifically for hydrogen service. All this adds up to the hydrogen plant being high-hazard and consequently requiring high levels of safety throughout its operating life.
Hydrogen also has significant global warming potential. To mitigate climate change require minimisation / elimination of leaks from any part of the hydrogen system.
Having said all that: for the sake of wrapping this post up in my lifetime, I’ll go along with the Plan’s figure of 6.5 TWh of electricity storage (US only), doubling to 13 TWh for the globe.
Although, because the Plan assumes very large interconnection power flows between regions, I doubt very much that this will be sufficient. Sharing energy across borders is great if everyone in the world will sit around communal campfires singing ‘Kumbaya’. But I’m not convinced the world works like that. Quite apart from the distances involved and the oceans in the way…
The Plan’s 13 TWh of electricity storage is 13,000,000 MWh.
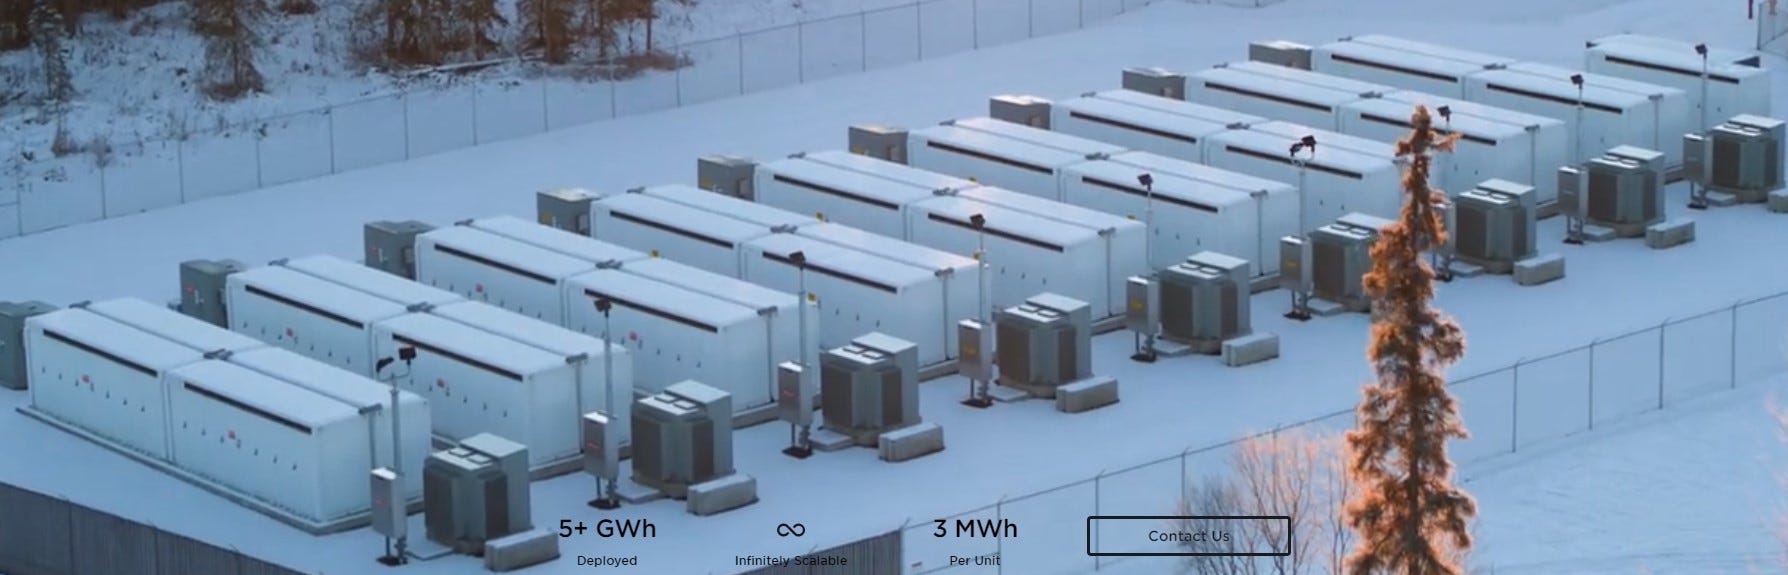
If we think in terms of Tesla ‘Megapacks’ (the idea of which I’m sure Elon is drooling over) then each one is 3 MWh. Ignoring limits on safe maximum charge and depth of discharge this would give 13 million / 3 = 4.333 million Megapacks. Each Megapack is the size of a shipping container, and because of the low but credible risk of thermal runaway in lithium ion batteries they have to be spread out, and cannot be stacked to reduce land area requirements.
Each of the 193 UN countries would need around 22,500 Megapacks.
Alternatively, we can consider pumped storage. For example, Coire Glas in the Scottish Highlands is the UK’s newest proposed pumped energy storage scheme with a price-tag of £1.5bn (USD 1.84 billion as of Mar 22, 2023). Its power capacity would be 1.5GW i.e. 1,500 MW and its storage capacity would be 30GWh (30,000 MWh). And it is expected to take around a decade to construct.3
Globally we would need 13,000,000 / 30,000 = 433 x Coire Glas. Distributing these equally, each of the 193 UN countries needs 2.25 x Coire Glas. Or perhaps slightly more realistically, every four UN countries should club together and between them construct 9 x Coire Glas.4
Alternatively, perhaps the iron-air electricity storage technology currently under development will come to the fossil-free world’s rescue, but at the moment that is not commercially available.
Conclusions
The Plan is not a plan, it is a feasibility study.
The sustainability goal appears from the Plan to be technically achievable, but the technical barriers are immense.
The human barriers to achieving the plan are not touched upon: the politics of over 190 sovereign nations, the training / re-training for new industries, etc.
The Plan offers no quick fixes.
Disclaimer: Opinions expressed are solely my own.
This material is not peer-reviewed.
This summarises why I’ve stopped believing it would do any good anyway.
I am against #GroupThink.
I welcome your feedback via polite factual comments / reasoned arguments.
“fully-ish” is an Engineering approximation. I do not know the mean, median or mode of EV battery capacity, nor am I especially interested. I just like to use credible round numbers that are easy to understand.
Coincidentally, 32 GWh (32 million MWh) / year was the amount of CO2-free electricity produced annually by the last three German nuclear plants which were closed by political decision on 15 April 2023.
Another example: the 900 MW Nant de Drance Pumped Storage facility’s construction started in 2008. It was commissioned in 2022, with a storage capacity of “20 million kWh” = 20,000 MWh. “The project was built at a cost of approximately CHF 2 billion ($2.09 billion).”
Can every country build pumped storage such as Coire Glas? Not flat parts of the world (e.g. the Netherlands, The Gambia, Bahrain and Qatar): for them, pumped storage is a dream.
Thanks, Chris, very useful. I have to say that my numbers here in the UK are very different. We currently use up to 45 GW. When we add transport and heating, etc we will need something over 100GW of capacity. Assuming we make some effort at nuclear power (very unlikely), we will still need 80 GW of wind and solar. Based on 2022 figures, these can go down to essentially zero for periods of a week so we would need storage for that order of time 80 X 168 = 13 TWhr. This is either 400 pumped hydro units like the new one in Scotland or 4 million Megapacks or (I don't understand hydrogen!). Even these numbers are potentially conservative depending on people's behaviour - if half of the 40 million new electric vehicles come home at 6pm and plug in, that could be 150 GW capacity needed.