

"WWS" - What Stanford Prof Mark Z Jacobson Seems to be Telling Us
Mark Z Jacobson published a list of 45 countries he says shows "WWS" can provide reliable power 100% of the time. But what else does that list show?

Summary
Based on his own modelling, Stanford Professor Mark Z Jacobson (MZJ) assures us that “WWS” (Wind, Water and Solar) power generation can reliably keep the lights on in an all-renewable world. As proof, he’s published a list of 45 countries which already produce 50% to 100% of their power using ‘clean’ technologies.
The list indicates “WWS” works, but only in countries for which the middle “W” of “WWS” is “Water”. Countries with mountains or major rivers benefit from controllable, dispatchable Hydro power. Countries which sit atop geologically-active zones benefit from relatively cheap controllable, dispatchable Geothermal power - which MZJ also categorises as middle “W” = “Water”.
Countries which have neither Hydro nor Geothermal will be relying on only the first “W” = “Wind” plus the “S” = “Solar”. In that case MZJ’s list of 45 countries tells you they’re unlikely to achieve a high quality of life in the “WWS” world.
Introduction
Stanford Professor Mark Z Jacobson (MZJ) is eminent in his field. For nearly three decades he has been performing research into and publishing on climate. On LinkedIn he is one of the strongest proponents of the “100% Clean, Renewable Energy Movement” and he is highly influential in climate change policy development.
His Stanford CV says that, based on the output from his modelling, he has convinced a number of legislatures that it’s possible to be 100% ‘renewable’ using “WWS” (Wind, Water and Solar) while reliably keeping the lights on. Laws have been passed and continue to be passed mandating the installation of more and more ‘renewable’ *capacity*1 while requiring phase-out of dispatchable fossil-fuelled power generation.
How good - which I’ll define as ‘how close to reality’ - is his modelling? On the basis of it he offers a vision of a transformational future for large portions of the globe via roadmaps for 145 countries [.pdf]. But will it work?
He makes the data / model / output available - see extract below from the document. However, I’m not a climate scientist. I’m fairly sure I would not understand the model and/or I would misunderstand too much in the roadmaps.
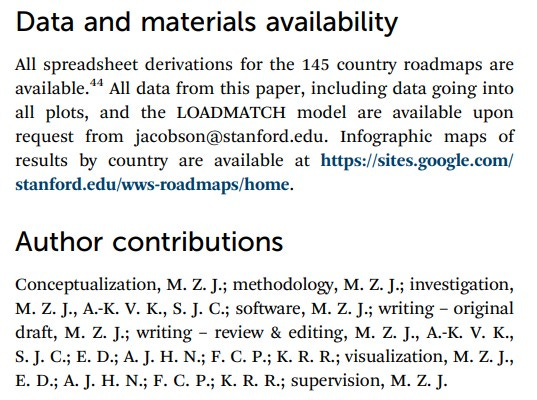
However, I do understand risk, and those Author contributions worry me. MZJ produced the model (software) and most of the report. I suspect there’s significant risk of GroupThink. That’s unlikely to be caught by peer review if the peer reviewers also think similarly. I would hope a topic this big with such potential to massively disrupt large sections of humanity would adopt a blue team / red team approach. But that in itself would almost certainly require WrongThink.
Sufficient doubts must have been voiced over the years that MZJ now claims he shows “with data” that his 100% Clean, Renewable Energy Movement “can be done”. That data comprises a list of 45 countries “with 50-100% of their electricity generated with #WindWaterSolar alone.”
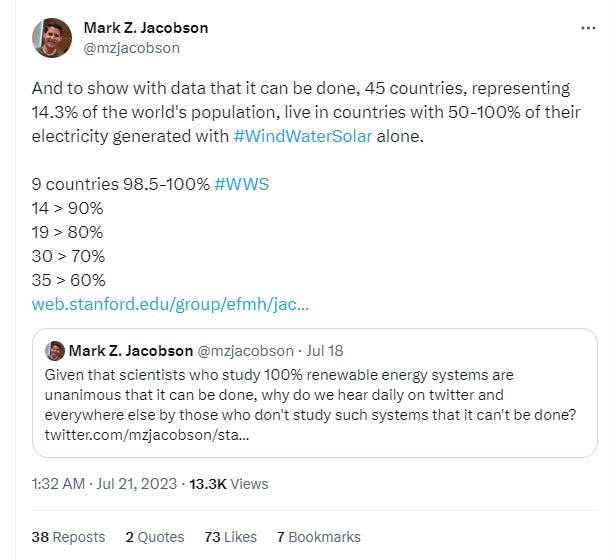
His tweet of Jul 18 is also interesting: “… scientists who study 100% renewable energy systems are unanimous …” That old unconvincing ‘97% of scientists consensus’ cr@p? Not good enough: MZJ claims 100% unanimity!
I understand data, so I downloaded MZJ’s list of 45 countries, filename “Countries100Pct.pdf” (non-subtle messaging there). The document heading is:
“45 Countries Whose Electricity Generation in 2020 or 2021 was 50-100% Wind-Water-Solar (WWS) (Including Nine With 98.5-100% WWS Generation) and Two States With 97.2-120% of Their Electricity Consumed From WWS”
Figure 1 shows the top nine countries:
Figure 1: The Top Nine from the MZJ List of 45
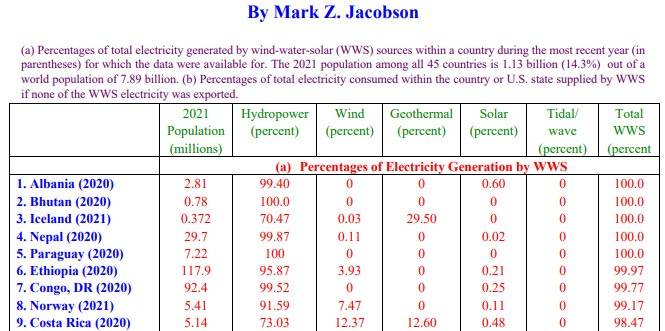
Ok, Iceland and Norway are in the top nine and I *think* I’d like to live like them… But Albania?? A country so horrible that its young men are paying thousands to people-smugglers to get them across Europe then into rubber boats so they can risk their lives crossing the busy English Channel?
“In 2022, around 16,000 Albanian citizens applied for asylum in the UK, making up 16% of all asylum applicants.”
Not Albania, then, but how about the others on the top nine list?
As is so often, the information omitted from a list is often more important than what is included. The data presented in this list of 45 countries is partial. People noticed. For example, couple of comments below MZJ’s tweet were on the lines: “large share of hydro…”; “hydro and geothermal are geographically limited…”
The major piece of data I think is missing is how much power does each citizen on the list of 45 countries actually get? So I copied MZJ’s data into Excel then added power per citizen data from wiki. Again, looking at the same top nine countries from MZJ’s list but from my Excel file I get Figure 1A:
Figure 1A: The Top Nine, with kWh/y per Capita Added
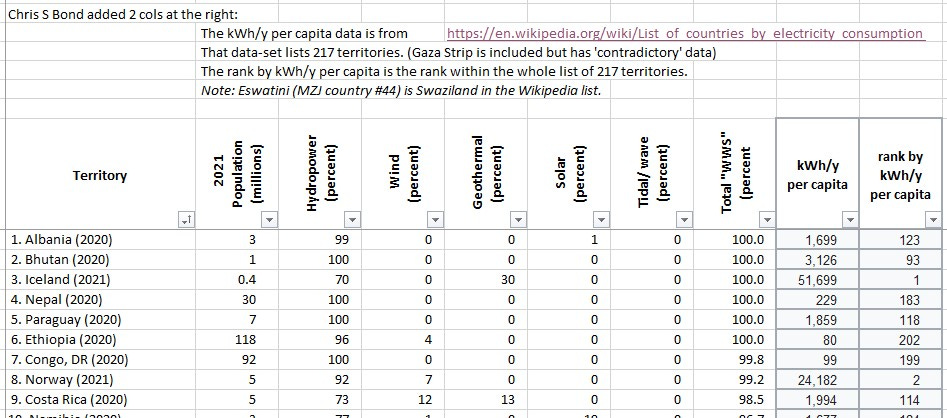
That confirms it. Iceland is energy-rich & ranked #1 in terms of kWh/y per capita. Norway is also energy-rich and is ranked #2. Albania ranks #123 in the world, which probably explains why their citizens are intent on being somewhere / anywhere else despite the risks.
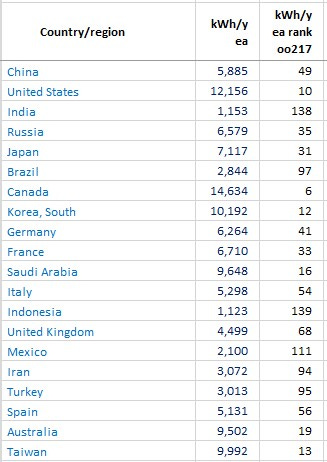
For context, Figure 2 from my Excel file shows the top 20 countries from the wiki data set with my addition of the ranking by kWh/y per capita. Note the wiki page opens with the list ranked in order of Total electricity consumption (GW.h/y), hence China is top followed by the US, etc.
Figure 2: Top 20 from the Wiki List + Rank by kWh/y per Capita
MZJ has listed his 45 countries in order of percent “WWS”. I re-ordered the data in my Excel file in various ways to discover:
37 of the countries on the list have at least 50% Hydro (controllable, dispatchable); 44 countries (exception: Denmark) have 15% or more Hydro
Two countries (Denmark 49% and Uruguay 40%) have more than 30% Wind; nine countries have 10% - 27%; nine have between 1% and 9%.
7 countries have 1% up to 44% Geothermal
3 countries have 11% to 19% Solar PV; 18 countries have 4% or less
Zero countries have Tidal/Wave (see P.P.S. re: Scotland)
I then re-ordered the list of 45 in reverse order of rank by kWh/y per capita:
Figure 3: Reverse Order of Rank by kWh/y per Capita (part 1)
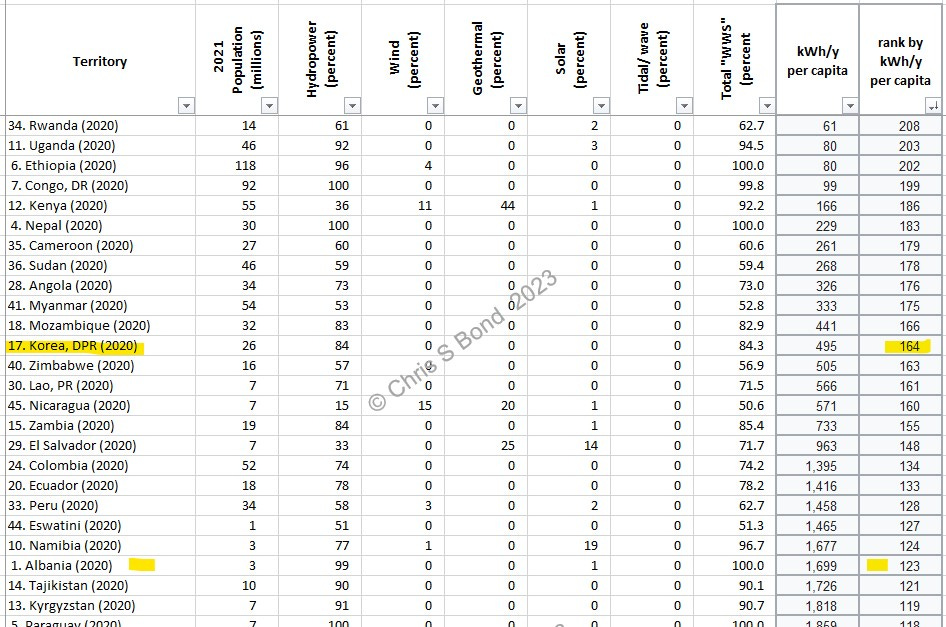
I’ve highlighted that beacon of enlightenment with which we’re all familiar - North Korea. Of the rest of the territories in Figure 3: I’ve been to Mozambique a few times, and Angola once, a long time ago. I wouldn’t recommend trying to live in either country. Colombia is lovely but life there can be perilous. Peru is… interesting.
Completing the list in reverse order of rank by kWh/y per capita:
Figure 3A: Reverse Order of Rank by kWh/y per Capita (part 2)
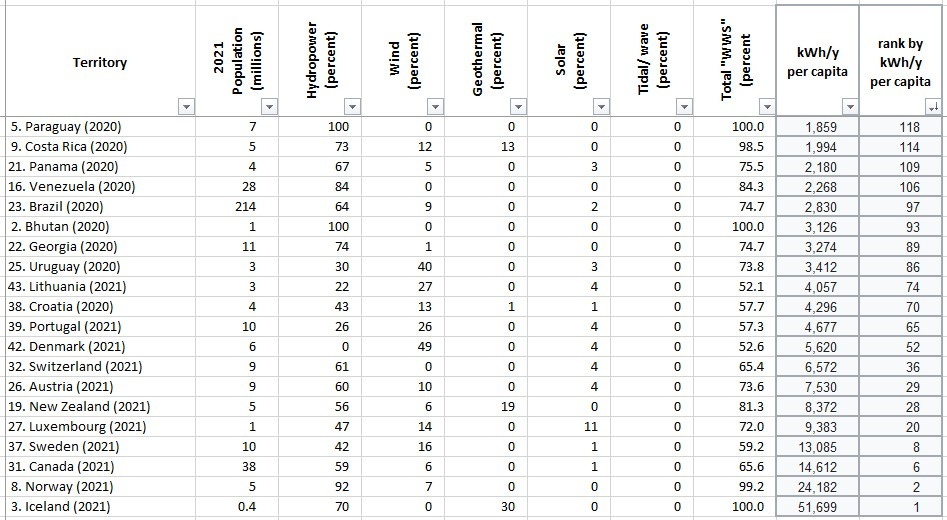
Panama isn’t bad to visit. Venezuela is a lovely country but has been deteriorating ever since the end of the good old ‘Hugo Chavez’ days, which is about when I last visited. In the territories from about Lithuania / Croatia / Portugal down I expect life would look reasonably familiar to most readers:
Would Denmark pass MZJ’s Note (b) constraint? Denmark is highly connected to adjacent EU countries who are all sharing power when they can.
Switzerland has an impressive array of alpine territory, and so its 61% Hydro (controllable, dispatchable) is completely understandable. If your country doesn’t have alps (or an enormous river), that much Hydro would be difficult. Switzerland’s 4% Solar is rather pitiful.
Austria neighbours Switzerland and has similar geography.
New Zealand is mountainous and hence has lots of Hydro (controllable, dispatchable). New Zealand is also part of the Pacific Ring of Fire which results in frequent and sometimes devastating earthquakes but it means it can get 19% of its power from Geothermal (controllable, dispatchable) sources relatively easily.
I believe Luxembourg is similar to Denmark in being highly interconnected - would it pass the Note (b) constraint?
Sweden and Norway have mountains and fjords and consequently lots and lots of Hydro (controllable, dispatchable).
The large majority of hydropower generated in Canada comes from run-of-river or reservoir generating stations and is therefore controllable and dispatchable.
Iceland is ranked #1 with the highest kWh/y per capita in the world.
It lies on the divergent boundary between the Eurasian plate and the North American plate. It also lies above a hotspot, the Iceland plume.
Iceland is one of the most active volcanic regions on Earth, where almost all types of volcanic and geothermal activity can be found:
“In 2016 geothermal energy provided about 65% of primary energy, the share of hydropower was 20%, and the share of fossil fuels (mainly oil products for the transport sector) was 15%. In 2013 Iceland also became a producer of wind energy. The main use of geothermal energy is for space heating, with the heat being distributed to buildings through extensive district-heating systems. About 85% of all houses in Iceland are heated with geothermal energy.”
Because of all the volcanic activity it has lots of mountains ==> lots of Hydro (controllable, dispatchable).
It has a land area larger than Hungary, but few people: the population of Iceland was 387,758 on 1 January 2023. Just under 0.4 million.
So, how like Iceland is the country where you live?
And what general solutions to climate change do you think Iceland might offer?
I conclude that Prof Jacobson is telling us this.
“WWS” can keep the lights on and provide you with a good quality of life… IF your country has mountains and rivers and maybe if it sits on top of a volcanic zone.
If, however, your country is going to rely on Wind and Solar, its “WWS” is unlikely to support the quality of life you’re used to.
P.S. The bottom of MZJ’s list
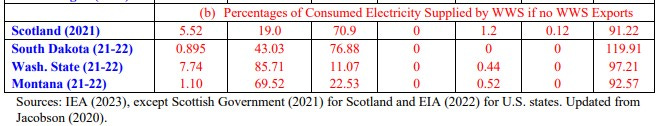
Note (b) includes “… if none of the WWS electricity was exported” and is important to MZJ’s argument. For Scotland and the three US states the high proportion of “WWS” power is only possible by exporting excess to the neighbouring country/state(s) or importing from them at times of shortage. Otherwise, to maintain grid stability they would have to constrain/curtail far more, or burn more gas. Therefore I think inclusion of Scotland + the three US states in the list does not support the assertion that 100% “WWS” power alone is possible.
Figure 4: The Note (b) Territories
P.P.S. Tidal / Wave Power
Figure 5: Scotland the Lone Tidal / Wave Power
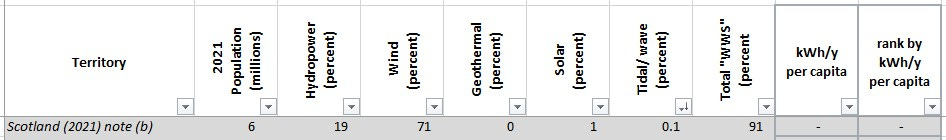
Scotland is the only territory on MZJ’s list that has any Tidal/Wave power, a paltry 0.12%. A commenter asked me recently did I “… remember the “Tomorrow's World”2 prediction that 'Salter's Duck' was the future for all Britain's electricity generation?” That was about 5 decades ago. My commenter also provided me with three recent examples of Wave / Tidal projects around the UK, none of which have generated much power despite large lumps of public and private funding being thrown at them.
P.P.P.S. Democracy
I believe in democracy. If our elected leaders provide a full transparent explanation of the need for the energy transformation to their population, pros and cons, and then the vote is for this transformation, so be it. If there are significant uncertainties in the modelling and gaps in available technology, I expect that to be part of the discussion informing the electorate.
What I do NOT expect nor accept is to have energy transformation forced upon us by ideologues just because they shout louder than anyone else.
They have to convince the majority.
Disclaimer: Opinions expressed are solely my own.
This material is not peer-reviewed. This is why I stopped believing it would do any good, and this reinforces that conclusion.
I am against #GroupThink. And I am really pro #FreeSpeech.
Your feedback via polite factual comments / reasoned arguments welcome.
I put *capacity* of renewable sources within asterisks to remind readers that the measured actual ‘load factors’ of any entire fleet of wind and solar PV will be moderate percentages of the nominal numbers.
I use the definition of ‘load factor’ as used by HM Gov:
"Percentage of how much was generated compared to maximum possible generation."
Depending whether this is "based on the average of capacity at the start of the year and capacity at the end of the year" or "based on the generation and capacity of plants that were operational throughout the year" you get two sets of slightly different answers.
For the UK as a whole, load factors averaged over five years 2018-2022 on the basis of ‘plants … operational throughout the year’ are:
· Onshore Wind 26.32 % [for each 10 MW installed you get ~2½ MW on average]
· Offshore Wind 40.56 % [for each 10 MW installed you get ~4 MW on average]
· Solar PV 11.16 % [for each 10 MW installed you get ~1 MW on average]
Tomorrow's World is a former British television series about contemporary developments in science and technology. First transmitted on 7 July 1965 on BBC1, it ran for 38 years until it was cancelled at the beginning of 2003.
It's amazing that Stanford Prof Mark Z Jacobson fails to understand that sources annually generating 100% of a need ≠ sources annually generating needs 100% of the time.
That reflects badly on Stanford.
The work of Jacobson cannot be taken seriously.
Apart from the issues you have raised, there are some even more fundamental ones.
1. Who would manage this? Which international body would have the authority to co-ordinate it all?
2. Who would finance it? Which countries would pay more/less than their share. Which countries could afford it?
3. It cannot be done piecemeal because of interdependencies, so which nations will submit themselves to such an overarching programme of work? See 1, 2 and 3 above.
4. There is no materials schedule. What do we need? How much? When? Where do we get it from? Without that the "plan" is worthless.
There are many, many other very major issues, but one thing that is very apparent is that it can only ever be a "thought exercise".