Constrained
A very windy week at the end of December provides clear evidence of renewable generation being constrained. What implications does that have for the 'plan'?

Summary
In my post of 23 December I looked at actual power generation data for 2020, 2021 and most of 2022. I thought I saw evidence of constraint actions by National Grid to keep the grid stable. The Gridwatch data for the last couple of weeks of the year have confirmed this.
I touch upon the implications that immediately spring to mind. Please feel free to comment with others.
Lots more to explore as we go further into the new year.
Same Basis as Previously
In this post I continue to use real GB power data from Gridwatch. However, as I explained in my 23 December post, I am now applying correction factors to the wind and solar PV energy integrations. I continue to try to keep things human-scale with the same units: mega-watts (MW) for power flows and mega-watt hours (MWh) for amounts of energy.
Constrained Wind
Constrained wind1 is when National Grid tells wind generators to stop generating in times of surplus power to avoid overbalancing the grid. In my last post I said I thought I saw evidence of this in some of the data from 2020 and 2022. Now that I’ve downloaded and plotted the rest of December 2022’s data from Gridwatch and ‘connected the dots’ to a LinkedIn report of negative power prices throughout the period 20 - 30 December I can see it clearly.
December 2022:
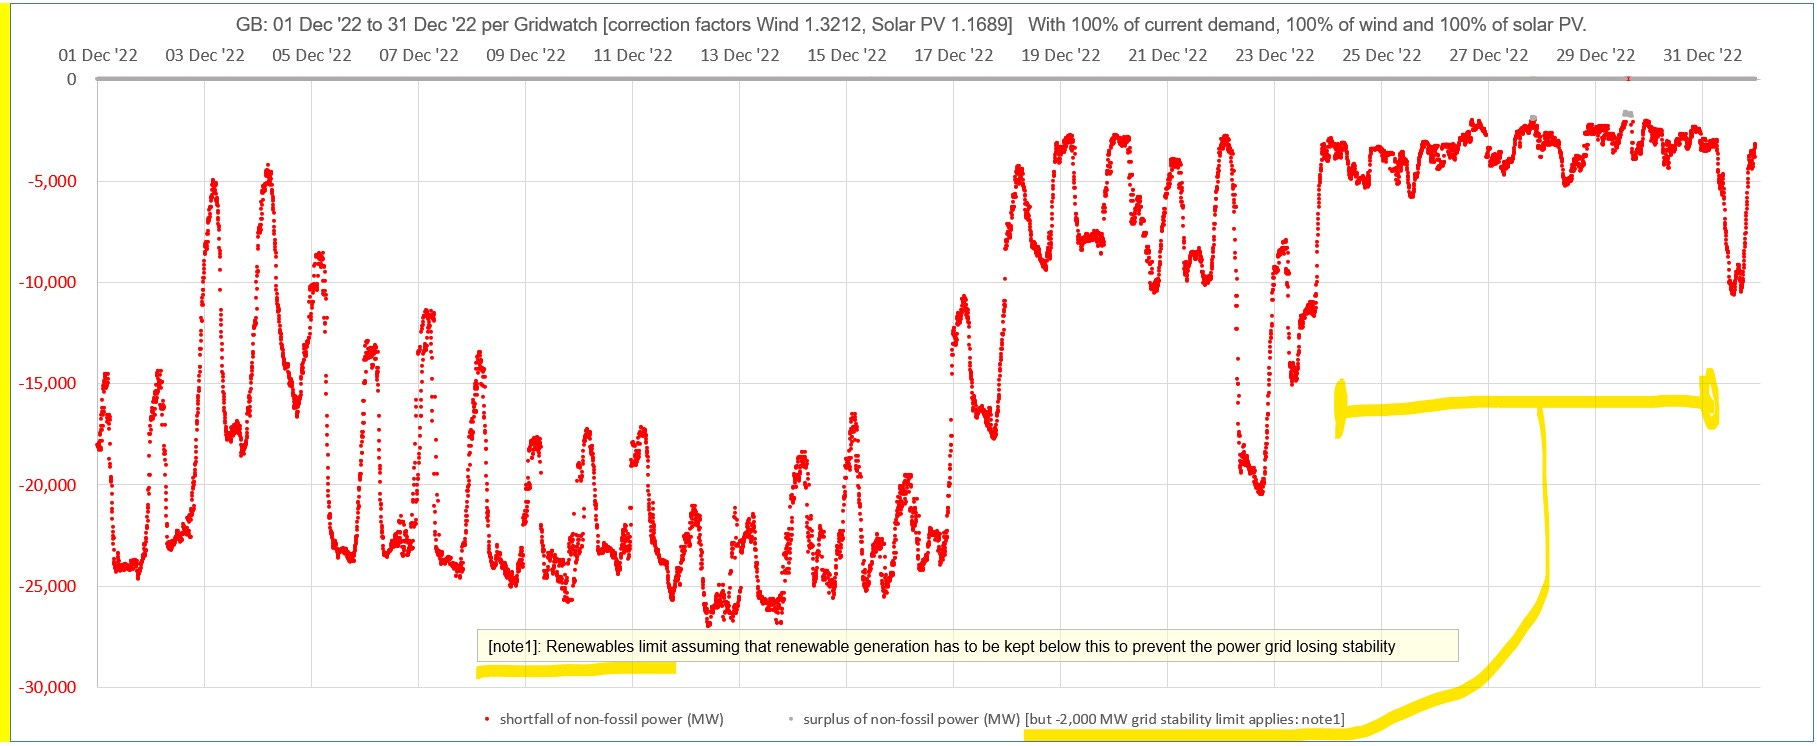
Following the bitterly-cold low-wind, low-solar PV interlude 09 - 17 December when the shortage of renewable power was between 17,000 and 27,000 MW, the winds around the UK strengthened dramatically. You can see in the chart above how the trace, particularly during 24-30 December, is flattened. This absolutely confirms my assumption that there is a ‘stability limit’ at around -2,000 MW which triggers constraint action.
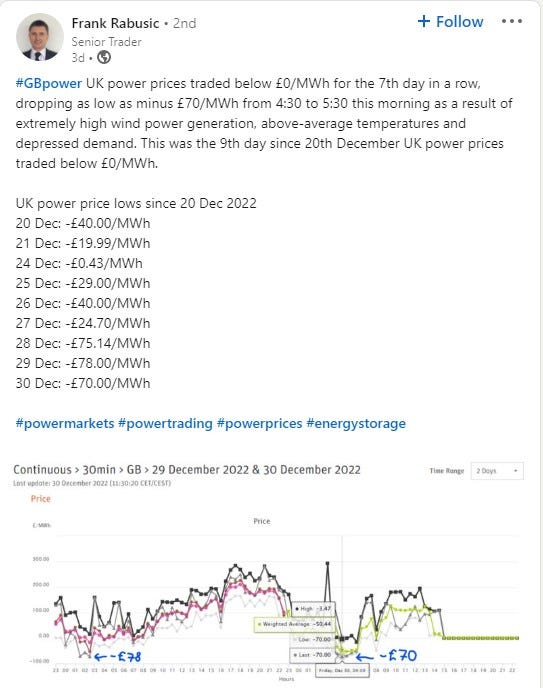
Also, on LinkedIn it was reported that GB power prices had gone negative in nine days in the period 20 - 30 December:
That being the case, and assuming a repeat of actual 2022 weather conditions, what would be the effect of applying HM Gov’s planned higher proportions of wind and solar PV versus the anticipated higher power demand of 2030-35? (Again, see my last post or other posts for background).
2022 Conditions, HM Gov’s ‘Plan’ vs. Increased Demand:
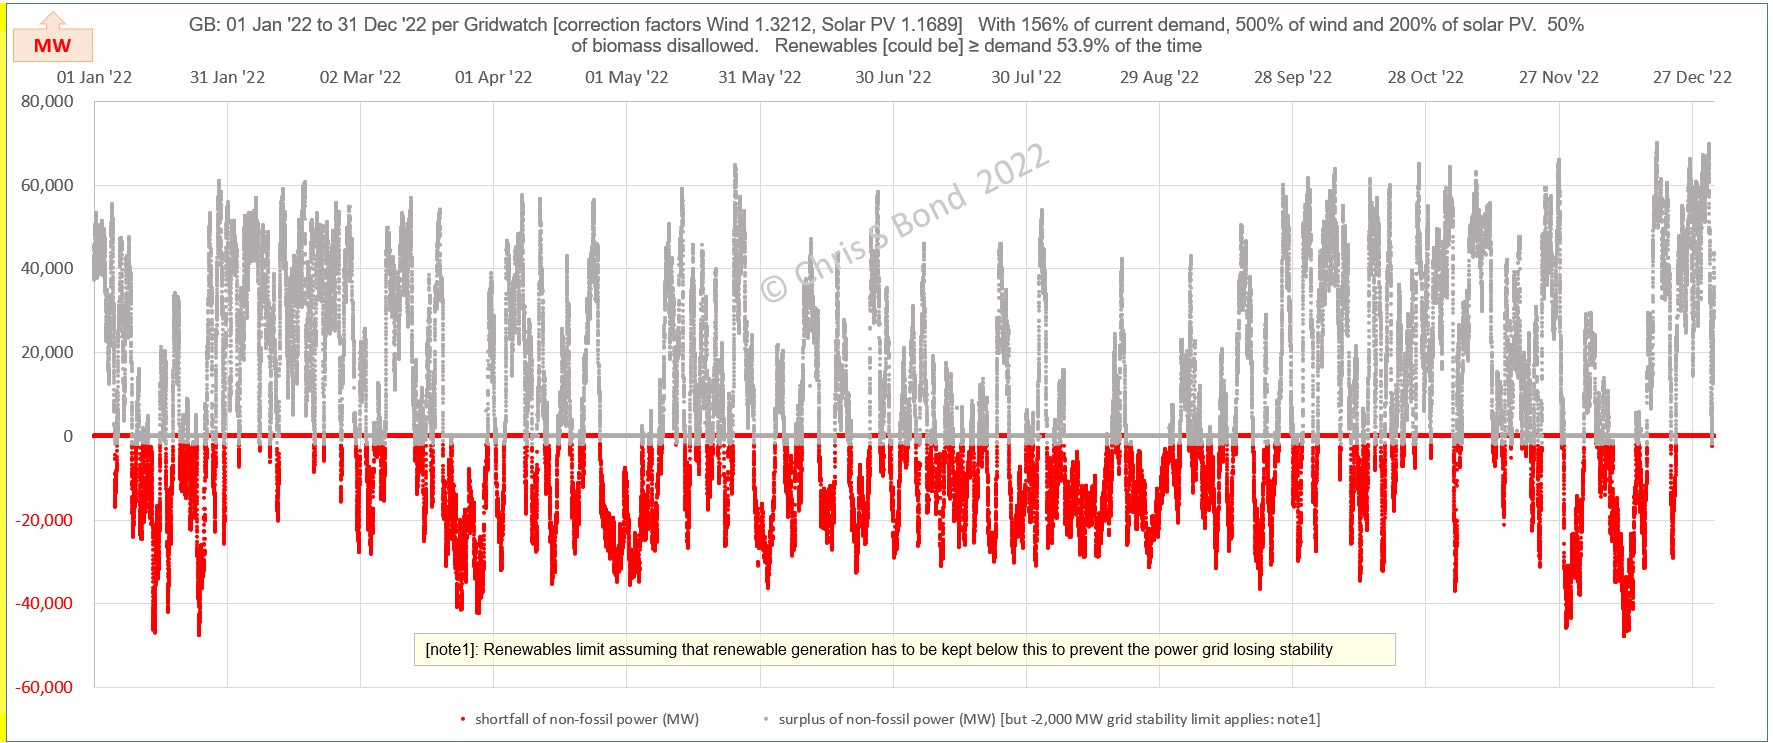
Under current grid stability controls, more renewable capacity would just result in more and more constraint (the grey spikes on the chart).
2022 Conditions, 2035 *Capacity*, Cumulative:

In the cumulative chart, all the upward parts of the line could potentially be surplus renewable energy used to charge energy storage of some form. Numerical integration tells us that that total could potentially be nearly 135 million MWh of energy. That’s quite a lot, considering GB’s power demand currently totals 308,659 GWh =
308.7 million MWh (DUKES 6.2, 2021). Nearly 44%, not a trivial contribution to future electrification… potentially.
There’s only one problem: we don’t have anything near the amount of energy storage needed, by orders of magnitude. That quantity of that type of energy storage capable of storing then discharging over days and weeks - long-duration energy storage, LDES - simply does not exist. Sure, there are pumped storage schemes like Dinorwyg in Wales and Nant de Drance in Switzerland which could theoretically store energy for weeks or even across seasons. But try putting that together as a business proposal to potential investors - as well as solving the geographical and societal difficulties of finding suitable bodies of water the locals agree to have developed in that way.
So instead, unless there is a huge energy storage breakthrough, the world of 2030-35 would watch the great majority of that 135 million MWh being constrained, not generated. All the infrastructure that might be used to generate that power - the wind farms themselves, plus the high-capacity cables, the substations, the grid-reinforcements - for what? All that investment, just for the chance to claim that GB is not generating much CO2 for 54% of the time? (If you think that’s “Net Zero” please read one of my other substack posts.)
Additionally, all the downward parts of the cumulative chart show where (without immense energy storage that was previously *charged up*) we currently have to keep burning fossil fuels to keep the lights on 60/24/365. That, for 2022’s actual weather conditions, would total around 66 million MWh-worth.
That sounds quite a lot, doesn’t it? How much, exactly? One half of Hinkley Point C is rated at 1,600 MW. Assuming that once it is eventually commissioned it runs flat out on average 90% of the time, that would produce 12.6 million MWh of energy. So instead of burning gas to produce that 66 million MWh we could hurry up and build 2½ more Hinkley Point Cs. Not a snowball’s chance in Hell, I’d say, considering we are already in 2023.
By the way, you don’t need to just take my word for the need for energy storage. Have a read of Technologies for Large-Scale Electricity Storage which includes as its first Key Take-Away:
… the UK will need an estimated 65 GWh [65,000 MWh] of intra-day storage and 16 TWh [16,000,000 MWh] of inter-seasonal storage in the renewable electricity future.”
Some context to those numbers: Dinorwyg stores up to 9,200 MWh and took over a decade to build. In total across the UK we have about 23,700 MWh of pumped storage in 4 schemes. The Swiss Nant de Drance facility’s construction started in 2008 and it was completed in 2022, with a storage capacity of “20 million kWh” = 20,000 MWh. If that ‘Technologies for Large-Scale Electricity Storage’ blog is anywhere near right - and I think it’s in the right ball-park, my own estimate is 13,000,000 MWh - we would need hundreds of times the current total UK pumped storage capacity.
And that’s where I’ll leave it for now.
Future thoughts to be developed
ESO Plans
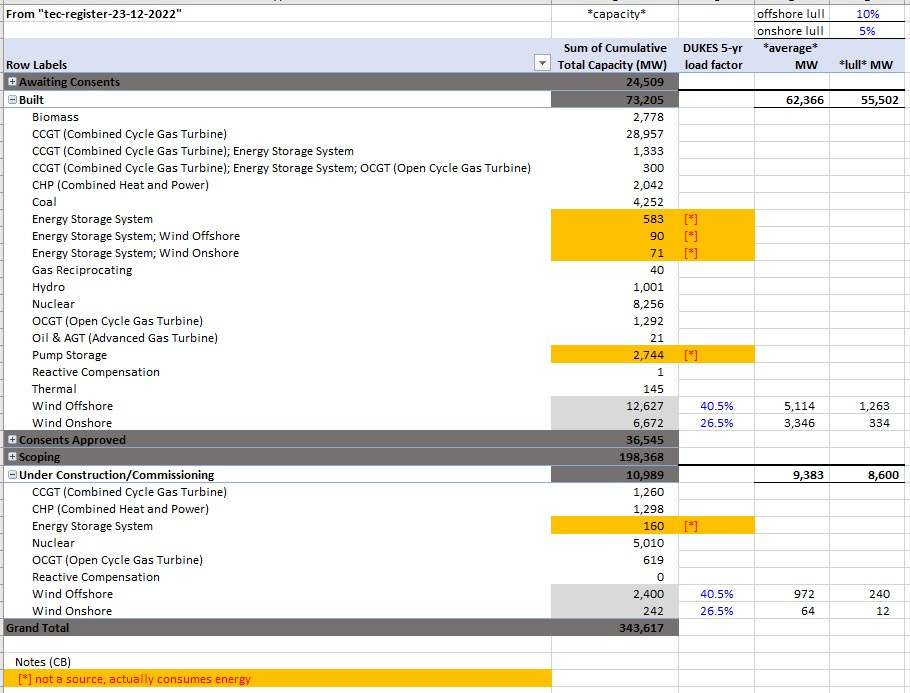
Great Britain's National Grid Electricity System Operator (ESO) has a pipeline of power projects that hold contracts for Transmission Entry Capacity (TEC) with ESO. Above is a snapshot of the pivot table I used to sort the database into comprehensible format. Of the 343 GW grand total, nearly 200 GW are only in ‘scoping’ phase. Energy storage projects are counted as generation *capacity* whereas they actually consume energy round-trip. No attempt is made to de-rate wind *capacity*. And so on.
Hydrogen for Energy Storage?
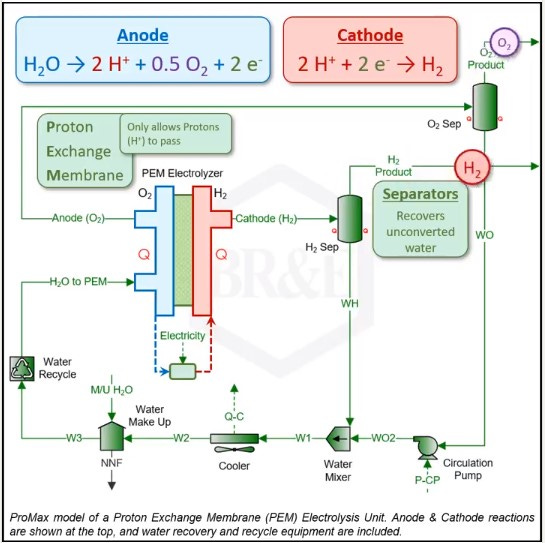
Is it possible to produce truly ‘green’ hydrogen and store it securely? I and a lot of other people have a lot of questions around this - we simply do not believe the Hydrogen Lobby’s hype. Below is an example of ‘an electrolyser’. Which as I understand it, needs a constant supply of power. Instead of which in our future renewable world the potential surplus renewable power is wildly spiky in a completely random way.
Disclaimer: Opinions expressed are solely my own.
This material is not peer-reviewed.
This is why I’ve stopped believing it would do any good anyway.
I am against #GroupThink.
But I welcome your feedback via polite factual comments / reasoned arguments.
No, not an unfortunate medical complaint.
I'm beginning to believe that a lot of this net-zero stuff is simply political posturing. So that our dear leaders can stand up in front of the world's media and claim they've installed 100% renewables. The fact that, as you have shown, most of this 100% is never used is something that's easy to characterise as a trifling detail that needn't concern the voters.
How many AAs would we need for 16TWh?
Assuming a 1.5V AA battery discharging at 100mA can yield 2Ah we have a capacity of 3Wh per battery.
16TWh = 16 * 10^6 * 10^6Wh requires ~5 trillion AAs. That's a lot of silenced drumming bunnies.
This equates to 125 million tonnes (25 grams each) or 1250 aircraft carriers.
Not trivial for a small island and I hope my arithmetic is correct!
BTW I tend to agree about peer-review!
Getting real data on constraints is difficult. You can get an approximation by looking at the wind forecast vs outturn reports - any big change downwards from a high forecast to a lower actual almost certainly represents curtailment, though it is hard to be precise about how much (and that must be a real problem anyway - you can't estimate what wasn't produced with certainty).
https://www.bmreports.com/bmrs/?q=foregeneration/dayaheadwindnsolar
A more nitty gritty approach is to look at output wind farm by wind farm, but that is painful in terms of accessing and downloading the data. However, it can be very revealing about what drives curtailments between one wind farm and another. There are various categories of wind farms contractually.
The simplest are those which are just paid market price for their output. These are wind farms that have no Renewables Obligation support, and either have yet to qualify for CFD support because they are not fully commissioned, or have not taken up their CFDs in the present strong market conditions that offer a much better return than their lowball CFD strike price (Triton Knoll, Moray East, Hornsea 2). These will have every incentive to curtail on the economics any time market prices are negative: they can simply buy back any forward sale of output at a negative price and bank the profit, rather than simply accepting the forward sale price at a lower margin. All they stand to lose are REGOs, although those have recently started to become of material value rather than being worth just a few pence per MWh.
Next are wind farms paid Renewables Obligations for every MWh they generate. In order to curtail they need to be compensated for the loss of any ROs they would earn. Different wind farms are entitled to different levels of ROs, so it will be the ones that are on the lowest RO band that are cheapest to curtail, and will be first in the pecking order where a constraint is operationally required because there is insufficient transmission capacity somewhere on the system (the constraint need not be in the immediate vicininty, but might be - more likely it will be the chokepoint of the Scotland-England transmission flows). Meanwhile the more expensive wind farms get to keep on producing. The market price tends to be set by the size of subsidies at risk (RO+REGO), and will be negative, and the curtailment payment will be of similar magnitude.
Wind farms on CFDs get paid their full strike price in compensation when market prices are negative, Their net proceeds are the strike price reduced by the negative market price, which will in most cases still leave them with a handsome income and thus no incentive to curtail. The first exception to this is that should day ahead intermittent market reference prices be negative for six or more contiguous hours no compensation is paid for the duration, and they have full market exposure to negative prices, and thus an incentive to curtail. Future rounds of CFDs will see the six hour minimum dropped, with any hour with negative prices offering no protection - potentially a big income hit compared with earning the strike price on more or less 100% capacity production on a windy day.
The other exception is when National Grid decides to persuade a CFD wind farm to curtail for operational or other reasons. It appears this has been happening with Beatrice quite regularly, despite the fact that it would be entitled to its full strike price - currently £175.47/MWh - if it carried on producing to offset any negative market price. I have yet to track down its compensation payments, but I plan to be asking questions as to why consumers have been paying out very large compensation when much cheaper compensation for RO generators on 1 or 2 ROCs/MWh ought to be available. The Beatrice accounts suggest the compensation has been more than generous. Perhaps they are being asked to free capacity so that National Grid can reduce its liabilities for failure to connect other wind farms at all.