Three Years' Data and Still Not Workable
Even after recalibrating Gridwatch, the all-renewable future is not very bright

Summary
I’ve realised that Gridwatch-derived energies for wind and solar are underestimates. In this post I’ve re-calibrated using whole-year DUKES totals for 2020 and 2021.
I revisit my 2020 and 2021 analyses on the adjusted basis, and update with 2022 data to date. Lo and behold, the trend continues: weather-dependent power is highly variable, and if we are going to replace GB’s fossil energy we will require A LOT™1 of it. Additionally, because long-duration energy storage technology doesn’t exist at anything like the immense scale needed, we will be constraining A LOT™ of renewable energy in times of surplus wind.
The charts below are derived from actual data for 2020 and 2021, and almost all of 2022. HM Gov’s plan in April 2022 was to have 50 GW of offshore wind *capacity*2 by 2030. Since then HM Gov has become even less effective: the quick turnover of Prime Ministers seems to have resulted in games of musical chairs within state departments while actual governance of the country gets little competent attention.
Same Basis as Previously
In this post I continue to use real GB power data from Gridwatch.
I continue to try to keep things human-scale with the same units: mega-watts (MW) for power flows and mega-watt hours (MWh) for amounts of energy. For example,
1 MW would fast-charge 20 electric vehicles (EVs) at UK supermarket Tesco (although they’ve recently started demanding payment for the service). A decent-sized fossil power station might generate 1,000 MW = one giga-watt (GW) of power. That power station running for one hour produces 1,000 MWh = one giga-watt hour (GWh) of energy. You will also often see country-scale energy consumptions / generations cited in tera watt hours (TWh) which are millions of MWh.
The Gridwatch power flow data is recorded every 5 minutes i.e. 5/60 of an hour. The Gridwatch power flows (MW) can thus be converted to amounts of energy (MWh) by multiplying each power by 5/60 [* except, see next section]. For each full year there are around 105,000 sets of Gridwatch data which provide most of the basis for my analysis and charts.
Gridwatch vs. DUKES Wind and Solar PV
The Digest of United Kingdom Energy Statistics (DUKES) is the annual energy statistics publication produced by BEIS (Department for Business, Energy & Industrial Strategy) on behalf of HM Gov. I realised as I started writing this post that the total MWh of wind and of solar PV from my numerical integrations of Gridwatch data do not match DUKES 6.2. (Neither does the University of Sheffield data - but with a different variance - on which Gridwatch solar PV is based. Odd.)
DUKES analysis is produced quarterly and roughly a quarter in arrears. However, the whole-year data for the previous year is published each June or July to allow for data reconciliation and updating from suppliers. The last summary Capacity of, generation from renewable sources and shares of total generation (DUKES 6.2) was published on Thursday 28th July 2022. The next publication date is Thursday 27th July 2023. I summarise the last two complete years as follows:
2020, Wind:
DUKES recorded total wind generation 75,615 GWh i.e. 75,614,880 MWh
From integrating Gridwatch data I derived 54,773,684 MWh = 72.44% of the official number. Hence increase Gridwatch-derived wind by 100% / 72.44% = 1.3805
2020, Solar PV:
DUKES recorded 12,903 GWh, i.e. 12,902,730 MWh
11,099,235 MWh was derived from Gridwatch data = 86.02% of the official number
Hence increase Gridwatch-derived solar PV by 100% / 86.02% = 1.1625
2021, Wind:
DUKES recorded total wind generation 64,662 GWh i.e. 64,662,060 MWh
48,941,464 MWh derived from Gridwatch data = 75.69% of the official number
Hence increase Gridwatch-derived wind by 100% / 75.69% = 1.3212
2021, Solar PV:
DUKES recorded 12,138 GWh, i.e. 12,137,960 MWh
10,384,415 MWh derived from Gridwatch data = 85.55% of the official number
Hence increase Gridwatch-derived solar PV by 100% / 85.55% = 1.1689
2022, Wind:
Increase Gridwatch-derived wind by 1.3212 [same as last whole-year 2021]
2022, Solar PV:
Increase Gridwatch-derived wind by 1.1689 [same as last whole-year 2021]
Whole-Years 2020 and 2021 Redux; 2022 to Date
In my second substack post I looked at what real GB data for two recent whole years was telling us about how achievable is ‘decarbonisation’ or elimination of fossil-fuel derived power. Because of the long lead-times for new nuclear and the continuing dithering in that area, I do not assume anything more than a continued status quo with the nuclear fleet capacity.
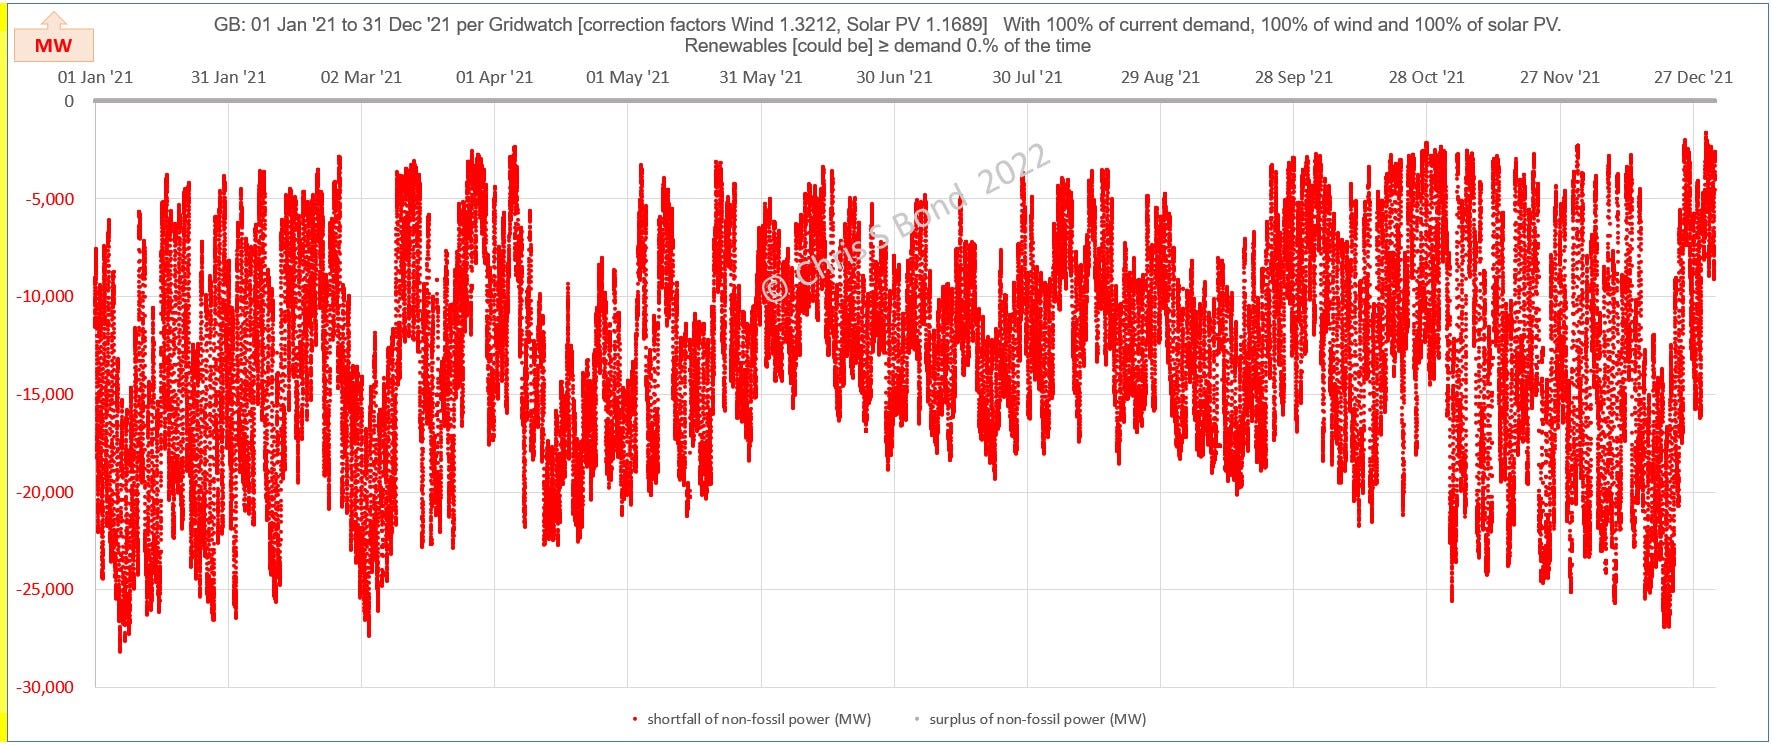
Thus in this post, for each data-set in Gridwatch I compare the power from renewable generation (wind + solar PV) with that from (gas CCGT + gas OCGT + coal + oil + ‘biomass’). In the charts below, red = shortage of renewable power, grey = [potential] surplus.
On the pre-recalibration basis I previously concluded that we completely failed to fully displace fossil energy at any moment throughout the last 2½ years. Recalibration increases wind and solar PV and therefore would tend to improve this picture, so in this post I revisit whole years 2020 and 2021 and look at most of 2022. Still we get three all-red charts apparently showing shortages of renewable power throughout each year:
2020:

2021:
2022:
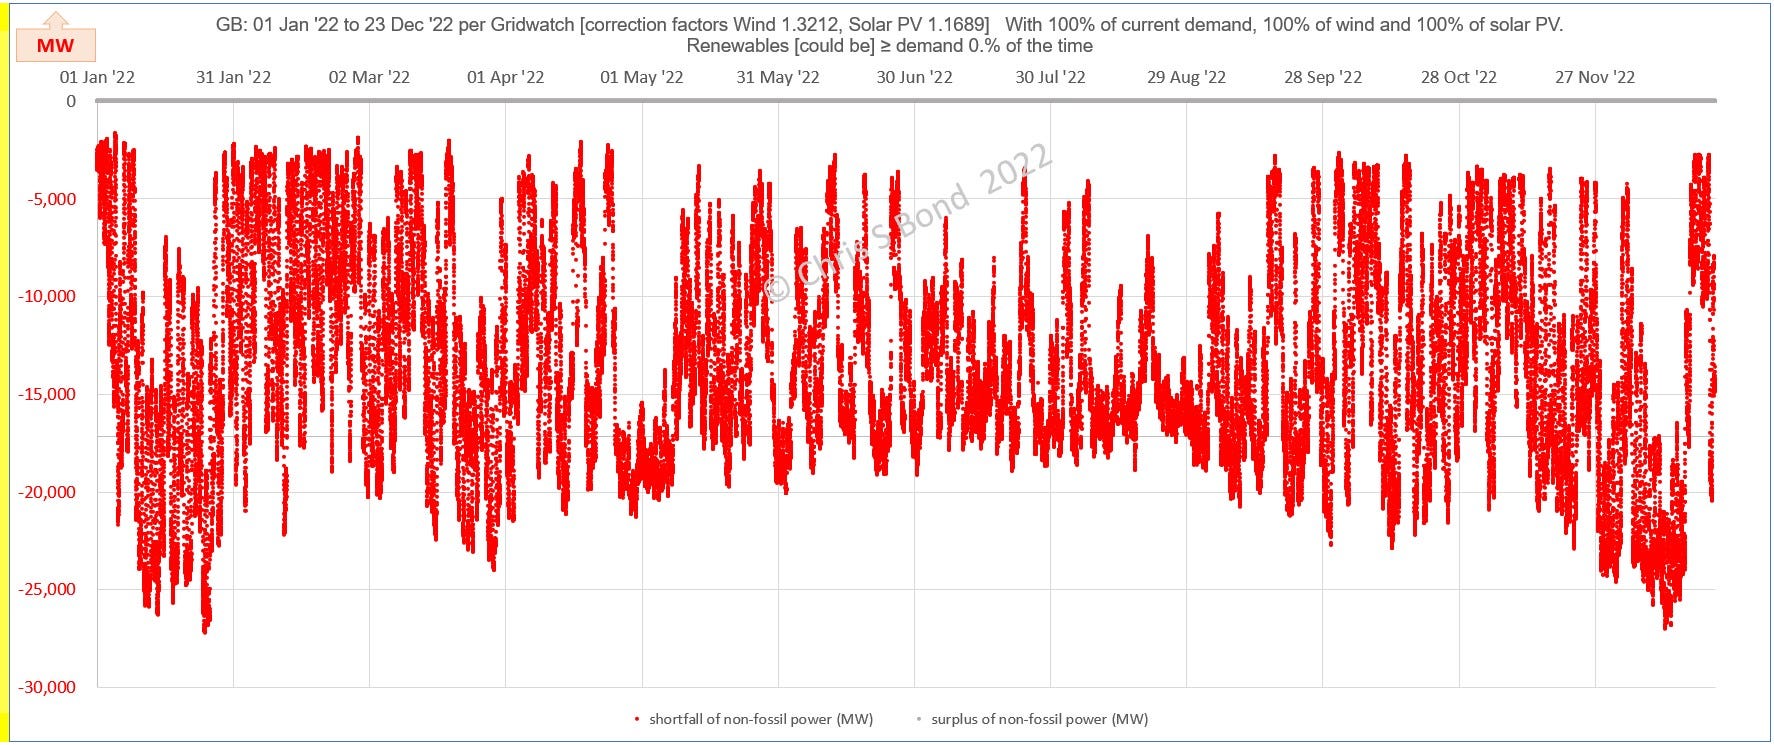
Then, a lightbulb moment. Particularly in the 2020 and 2022 charts it looks like we can see the effects of constraint actions by National Grid to keep the grid stable. In the chart aboce it appears that early in 2022 there is about a month of peaks all stopping about 2 GW below the zero axis. Of course! Gridwatch data is a record of power flows after Grid control actions are taken. There was actually more renewable power available than the Gridwatch record shows.
This makes sense. The country-wide UK power grid has to be kept stable, supply = demand 60/24/365. Currently, the way to achieve this is to prevent excess power being fed to the grid, while leaving room to react as the multiplicity of loads and supplies and interconnectors vary, potentially in non-predictable or unplanned ways. In the future, maybe ‘demand management’ would be applied instead. Oh, sorry, Coventry, were you cooking your supper? That’ll have to wait a few hours until the sun goes down I’m afraid. Don’t worry Guildford, your turn next, ha ha!
So, under current grid stability controls, more renewable capacity will result in more and more constraint. Possibly we will reach a point when we instead flip to demand destruction, sorry, “management”.
However grid stability is controlled, let’s look at the HM Gov plan for renewables generation *capacity* out to 2030 (that’s just 7 years from now, folks). Let’s combine that with the McKinsey prediction of a 56% increase in electrical demand once home heating and cars etc. are electrified in around the same timescale.
But since my original substack posts my opinion has hardened against the industrial-scale wood-burning in Drax. Hence in this post I have disallowed 50% of power generated from ‘biomass’ (it barely registers).
I’ve allowed solar PV to increase as well just because there’s nigh-unstoppable momentum behind it (*so* cheap, don’t you know?) Therefore I have run the analyses assuming that solar PV will increase to 200% of current *capacity* simply because the lobbying for it is probably irresistable for a while. But eventually people will stop believing in the Magical Money Tree (that is what MMT stands for, no?) and perhaps begin to demand value-for-money once more, like in the good old days. (Maybe bring back performance guarantees for energy producers, that may force intermittent sources to include the massive electrical storage capacity needed.)
Putting all that together I have run the actual yearly profiles of the last three years across the GB renewable electricity generating fleet, simply extrapolating higher wind and solar PV in direct proportion. Countering the greater supply is the predicted greater demand as more fossil-fuel uses are converted to electrical power (the main examples being cars and home heating using heat pumps).
2020 weather: 156% demand, 500% wind, 200% solar PV, 50% biomass disallowed:
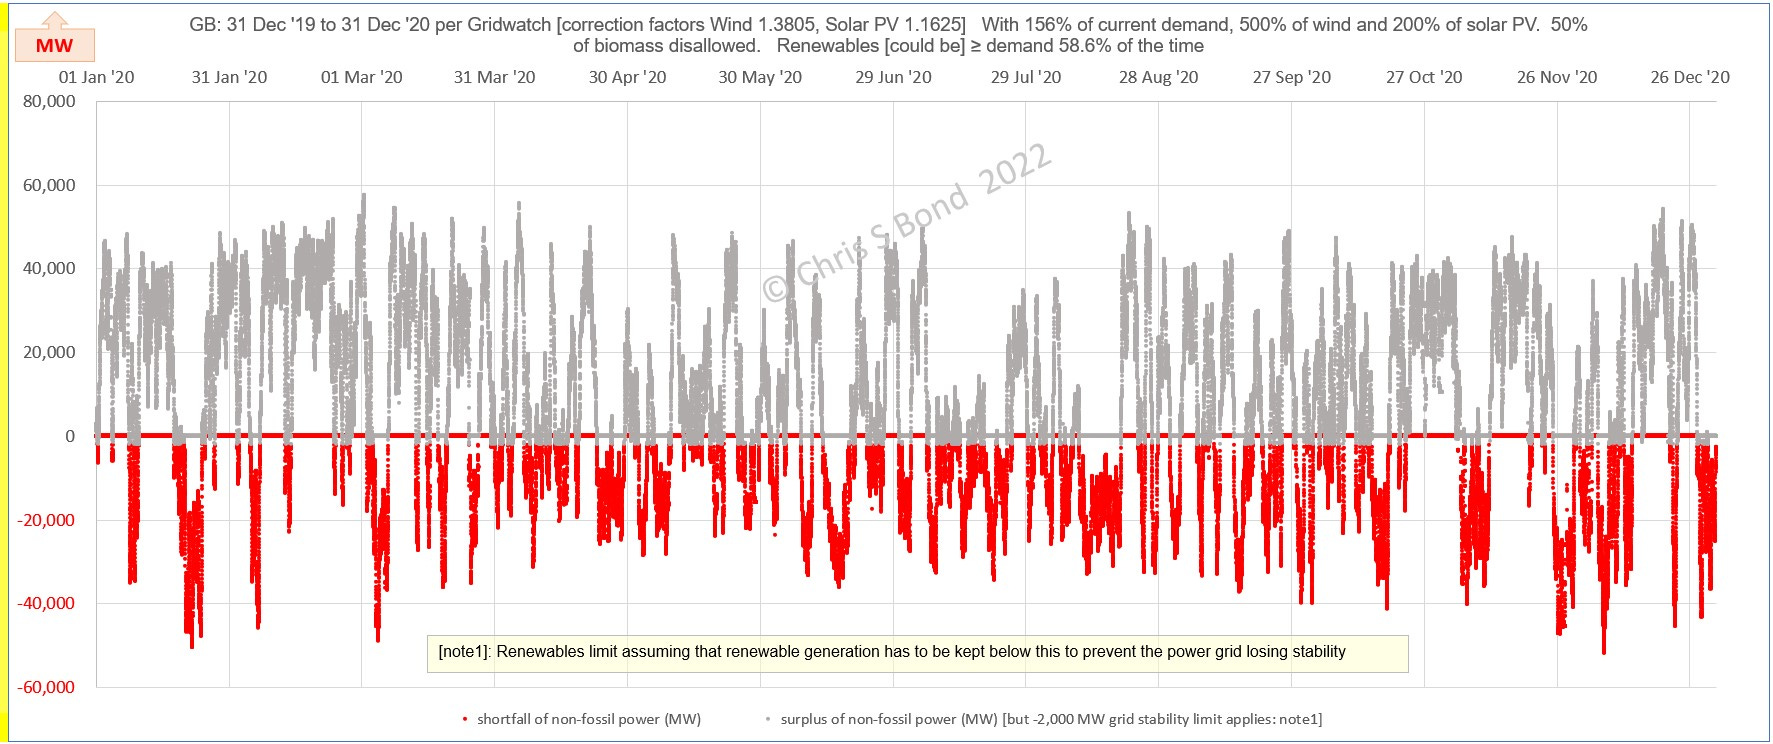
So for 2020 actual weather, HM Gov’s ‘plan’ achieves ‘decarbonisation’ of the power grid nearly 60% of the time. But look at all the grey spikes. Currently all that surplus renewable energy would have to be constrained, which under current contracts would result in enormous payments to generators to turn their windmills down or off. Unless immense loads (spiking to around 50,000 MW) could be applied just for those times of surplus.
What do we get when we apply the same approach to the far less windy year of 2021? A LOT™ less renewable power.
2021 weather: 156% demand, 500% wind, 200% solar PV, 50% biomass disallowed
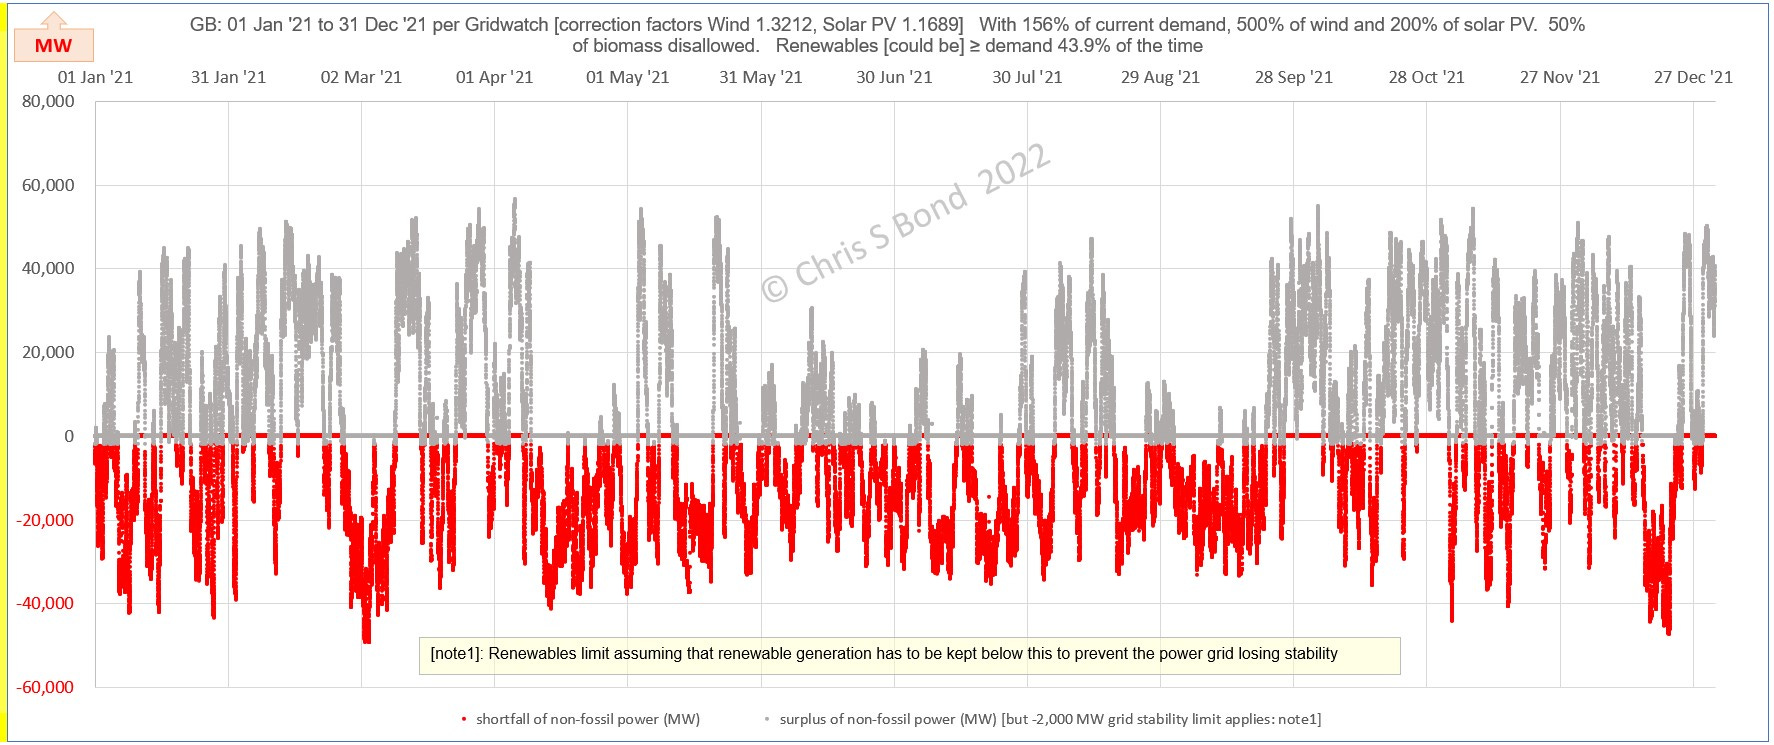
Oh, but 2021 was such an unusual year… Actually the report “Benefits of Long Duration Electricity Storage” (BEIS Research Paper Number 2022/019 of July 2022) commissioned by BEIS from AFRY Management Consulting includes on page 65: “Each scenario and sensitivity were run using weather patterns from 5 years, which were chosen to capture a reasonable range of weather patterns. In this sensitivity, the system dispatch model was rerun using all weather patterns from 2009 to 2019 to explore the impacts of more extreme weather on the system. This includes 2010, which is assessed to be the most extreme year for high demand and low wind output based on analysis of 30 years of weather data.” [My bold. Edited: Gridwatch existed in 2010 - on a public server - but its earliest downloadable data available now is from 13 May 2011. Apparently on the evening of 13 December 2010 demand almost exceeded supply at 59 GW. I surmise that since then GB has been de-industrialised to reduce maximum power demand by around 10 GW.]
Never mind, what’s been happening in 2022 (through to 23 December)?
2022 weather: 156% demand, 500% wind, 200% solar PV, 50% biomass disallowed
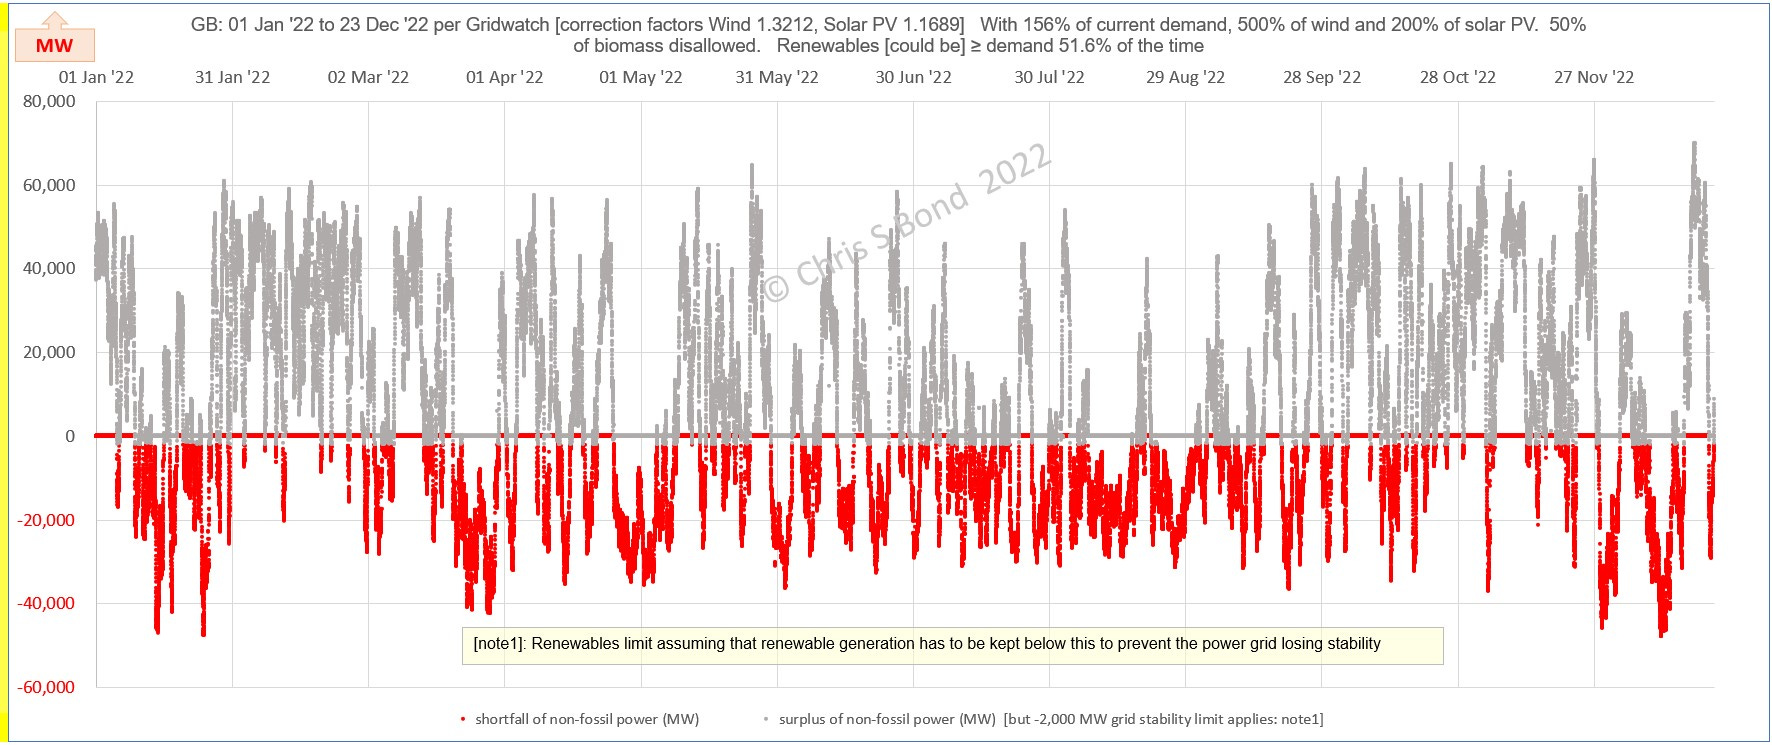
Success for a little over 50% of the time, but look at the size of those [potential surplus] generation peaks! Over 60,000 MW / 60 GW, i.e. about 1½ times current maximum UK power demand. Those power flows would be coming from new, mainly offshore, mega-wind farms requiring massive investment to create and reinforce the grid. Even more huge constraint payments to generators when there is so much surplus - unless the balancing control and funding mechanisms change fundamentally. Or are we going to both reinforce the grid within the UK and build immense interconnectors and find third parties willing and able to absorb those kinds of power flows whenever we find the wind’s blowing too perfectly here?
Hydrogen to the Rescue?
Or if you believe it is, show me with technical information as to how hydrogen production could cope with the intermittency.
Electrical Energy Storage?
There is nowhere near enough available. By orders of magnitude.
Or have a read of Technologies for Large-Scale Electricity Storage which includes under its Key Take-Aways:
In the renewable future, the UK will need an estimated 65 GWh of intra-day storage and 16 TWh [16,000,000 MWh] of inter-seasonal storage in the renewable electricity future.”
Disclaimer: Opinions expressed are solely my own.
This material is not peer-reviewed.
But I’ve read some critiques of the peer-review process - this is an example.
Edited to add the post I remember reading.
It seems that peer-review is not effective for quality control or even error-capture.
Rather it can be used to enforce conformity, and I am against #GroupThink.
I welcome your feedback if given via polite factual comments / reasoned arguments.
What do I mean by A LOT™? Much more than currently envisaged by most folk.
I put wind and solar PV *capacity* within asterisks to draw attention to the fact that the design limit of the facility is not the output you can expect from it. For example, this recent headline: “German developer installs 170 MW of solar at former coal mine”. In the middle of the sunniest of sunny mid-summer days you might be getting 170 MW from that facility… *if* the solar panels are clean and in tip-top condition. At night, around dawn or dusk, or in the middle of winder with heavy cloud cover? Not so much. Similarly for wind installations.
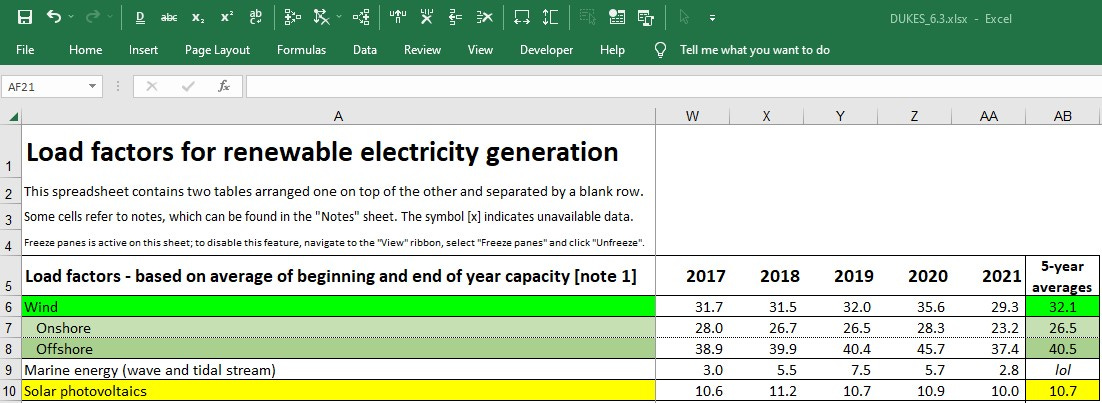
Across the whole of the UK fleet of wind and solar PV, DUKES 6.3 Load factors for renewable electricity generation over the last five years are as shown in the table below, with the definition of “Load factor” given in the note below the table. I have added the 5-year averages column. [The “lol” against Marine energy is “laugh out loud” for fairly obvious reasons.]
Hence if the example 170 MW *capacity* solar facility were to be constructed in the UK, on average it would produce 10.7% of 170 MW = 18.2 MW.

Gridwatch sources its data off ELEXON which is collecting data from generation connected to the National Grid at 275/400kV levels. However, to participate in the balancing mechanism a generator has to connect to the ELEXON metering system system so over the last few years progressively more generation, and BESS, located within the DNO system has become visible in real time. There are other sources of generator info from OFGEM renewablesandchp.ofgem.gov.uk which provides historical data on all sites accredited under the RO scheme (be warned there are plenty) but it does provide high level summaries. Problem is some of the larger sites are also reporting through ELEXON so you would need to remove them.
Anyhow only recently found this substack but great work.
Hi Chris.
This is interesting reading as always.
One question occurs - if the Gridwatch data gives actual generation after grid balancing action, what happened to the ‘surplus’ generation in the corresponding DUKES figures? If supply must always equal demand, how was the excess supply implied by DUKES used?