Are We Nearly There Yet?
From some headlines you see you would think so, but you would be mistaken.
Pure Snark
Summary
With all the headlines about how well we’re doing in the race to net zero, the reality is rather a disappointment.
Interconnectors to other parts of Europe won’t help much because lulls in the wind are not just local (and we all experience nights at about the same time as each other).
Do we really need immense energy storage to keep the lights on 60/24/365 in a fully renewable world? Yes, we do.
Where Are We Now?
In my review of the British Energy Security Strategy I was less than enthusiastic. In this post I continue to use real GB power data from Gridwatch: for this post I have downloaded the data and plotted some charts for the first 5½ months of 2022. I continue to use the same units: mega-watts (MW) for power flows and mega-watt hours (MWh) for amounts of energy (to keep things human-scale). 1,000 MW = one giga-watt (GW) = power; 1,000 MWh = one giga-watt hour (GWh) = energy.
The Gridwatch power flow data is recorded every 5 minutes i.e. 5/60 of an hour. The Gridwatch power flows (MW) can thus be converted to amounts of energy (MWh) by multiplying each power by 5/60. About 47,800 sets of real data form the basis of the analysis below. Amongst other things they illustrate the continuing random nature and length of wind lulls which are a feature of these islands and the wider area.
From the Digest of UK Energy Statistics (DUKES): renewable sources of energy data, published 31 March 2022, we get some snap-shots of where we’ve got to.
DUKES: Wind-Farm Locations:
DUKES: Renewable Generation Capacity:
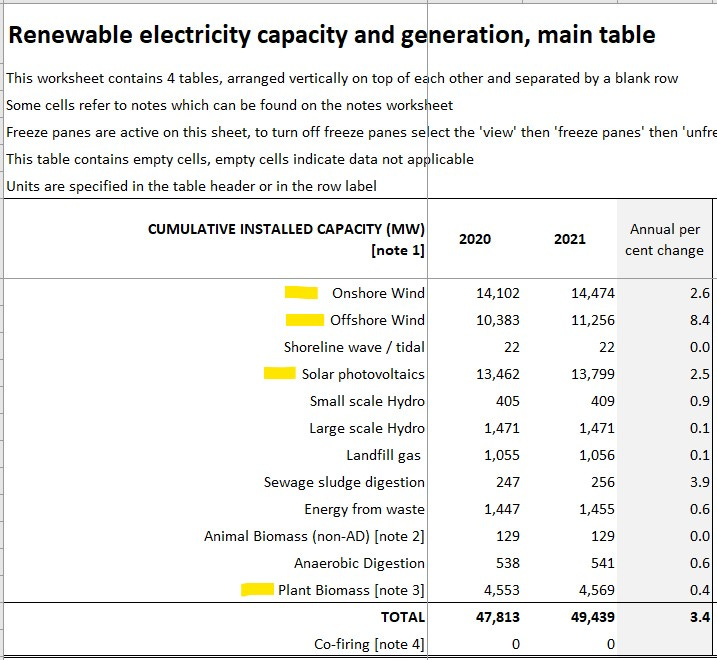
I’m unconvinced by the arguments that CO2 released from burning millions of tonnes of wood pellets especially at Drax can be re-converted back into mature trees in time for the 2050 deadline for Net Zero. It contradicts the COP 26 ‘commitment’ to end deforestation by 2030, which anyway leaves room for 8 more years of deforestation in the meantime. So I have left out the “Plant Biomass” figure of 4½ thousand MW from the analysis that follows.
[But at least burning wood pellets is a darned-sight more reliable than wind, and nearly seven times more reliable than solar PV, see below.]
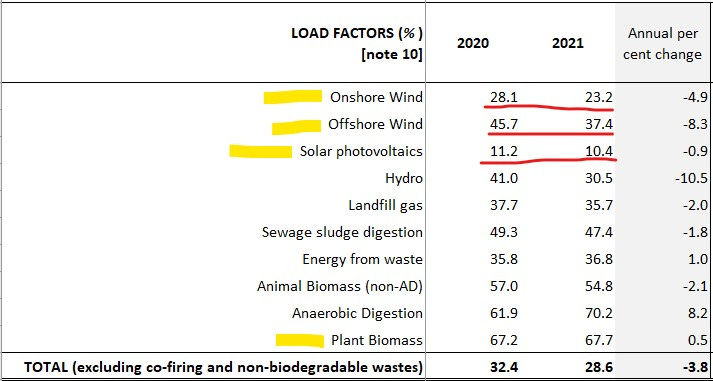
DUKES: Renewable Generation Load Factors:
Yes folks, for all the money spent on onshore wind, we get power equal to about one quarter of the installed capacity on average. Offshore wind is better at between a third and a half, but the costs of installing and maintaining offshore wind are commensurately greater - see below. As for the solar PV installations, you have to hand it to the subsidy-seekers and solar lobbyists, they’ve done a great job getting so much of their one-tenth load factor kit installed across the UK.
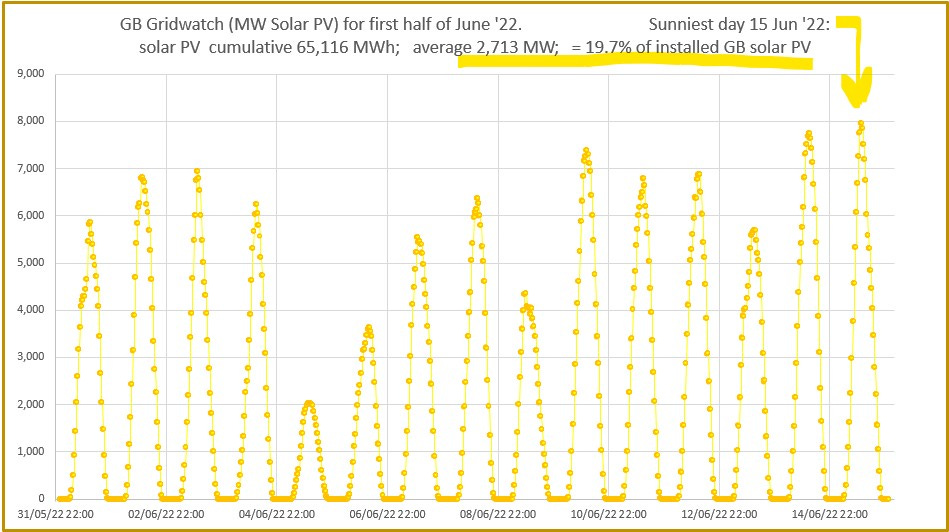
But, they cry, you get power from solar PV even when it’s not sunny! Yes, some, but not as much as you probably would like. Let’s take a look at the first half of June:
On one of the sunniest days of the year so far - 15th June - the solar energy generated was just under 20% of installed capacity. Don’t look at the unsunny 5th of June if you like getting value for your ‘green levies’ on your energy bills. As for winters when we need all the energy we can get, try not to cry when you look at the November through February charts in my last substack post.
But LCOEs are Falling, so that’s OK!
Lazard.com published their latest Levelized Cost Of Energy (LCOE), Levelized Cost Of Storage (LCOS), and Levelized Cost Of Hydrogen (LCOH) on Oct 28 2021.
The utility-scale Solar PVs look particularly cheap. The wind range is for onshore ($26 to $50, mid-range $38); the wind diamond ($83) has note [2] stating it is the “estimated implied midpoint” for offshore wind “assuming a capital cost range of $2,500 to $3,600/kW. So far, so good.
The historical charts of unsubsidized [sic] wind and solar PV LCOEs show wonderful percentage reductions… if you choose 2009 as your reference. If you choose as your reference the data from 10 or 5 years ago (because you want to know recent trends), the reductions in LCOEs are not so wonderful. And remember offshore wind’s LCOE (which is where HM Gov is placing its big 50GW bet on our behalf), is $83/MWh versus mid-point onshore $38/MWh, i.e. over 2 times higher than onshore wind.
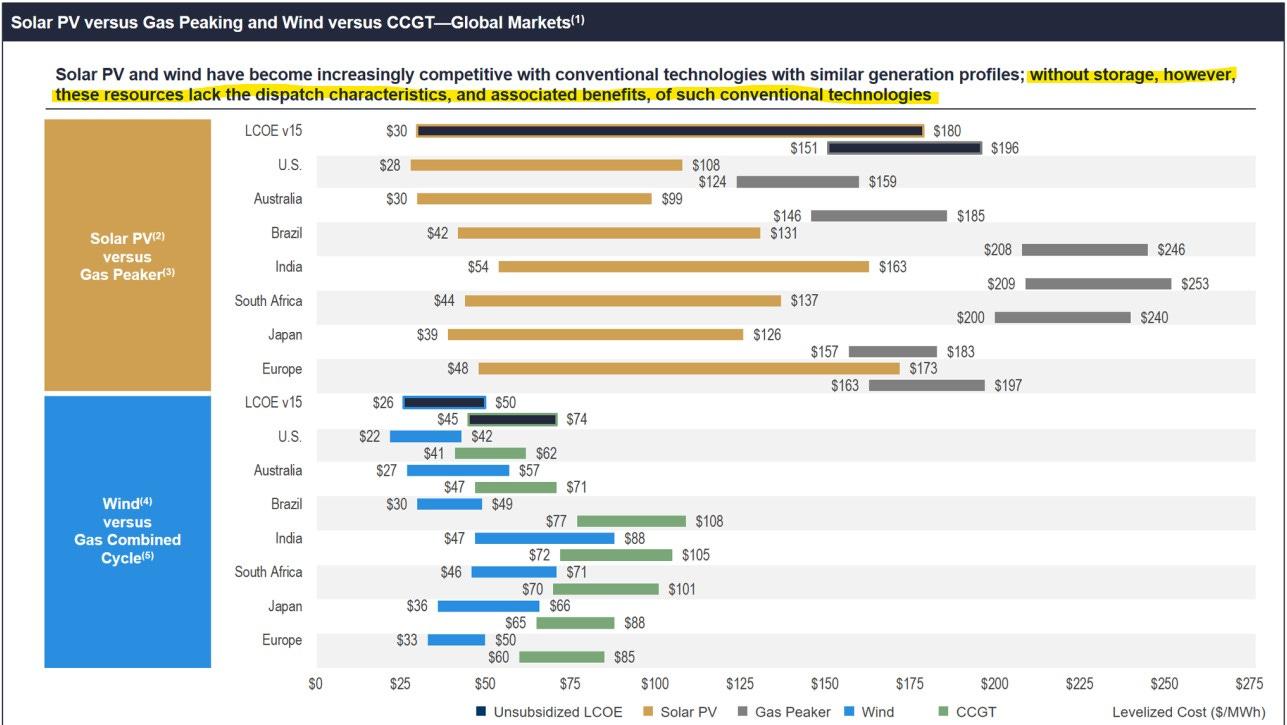
The Global Markets chart is fascinating. Why would anyone compare the costs of Solar PV to Gas Peaker? Or even compare wind to CCGT? The highlighted note implies Lazard are a bit embarrassed at doing so: they are chalk and cheese.
Each renewable system would require energy storage for them to have “the dispatch characteristics … of … conventional technologies”: what quaintly used to be called ‘reliability’. If you are in the midst of a freezing cold winter night, or if your loved ones are vulnerable, I’m betting you would prefer “the dispatch characteristics … of … conventional technologies”.
So to make the comparison like-for-like in terms of ‘dispatch characteristics’ the local operators would have to research ambient conditions and power outputs over a long-enough interval as to gain confidence in the storage capacity design. Per my analysis this needs to be over seasons and years rather than just days or weeks.
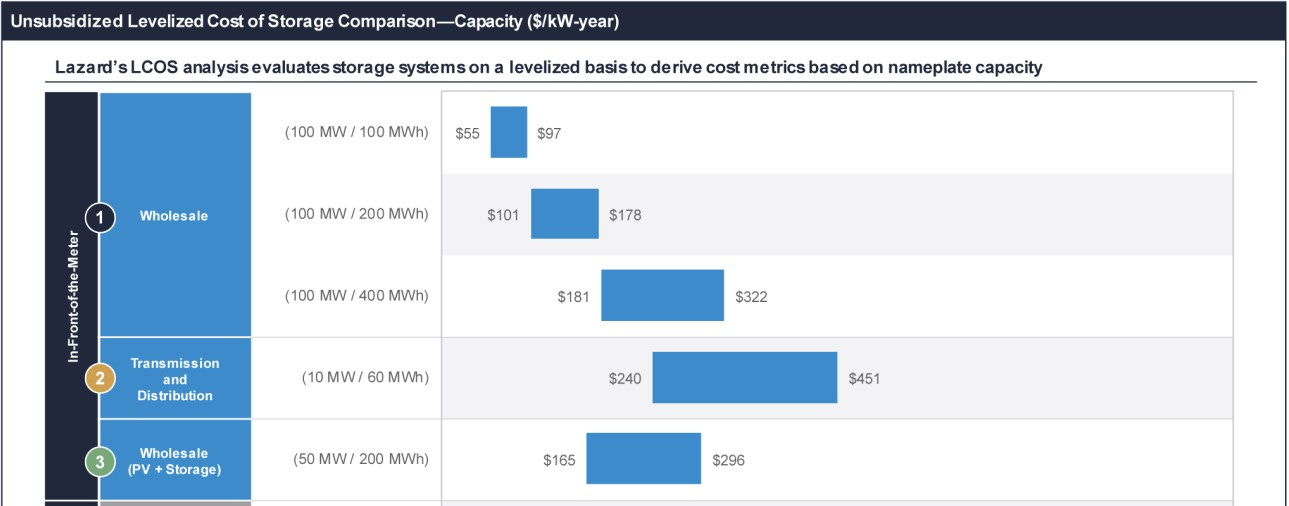
Then looking at the ranges of Levelized Cost Of Storage (LCOS) in the Lazard chart above, it wouldn’t take many MWh of storage requirements at most sites to completely tip the LCORE balance against the renewables sources of energy.
(LCORE = Levelized Cost Of Reliable Energy.)
Anyway, enough of the theoretical waffle. Back to some real data.
The First 5½ Months of 2022
Was 2021 really such an unusual year? Certainly you can see from the DUKES load factors above that wind blew a lot less across the entire UK wind-farm fleet in 2021 compared with 2020. But things have picked up now, right? We can rely on our windmills once again… can’t we?
Over a year ago Carbon Brief released their “Analysis: UK is now halfway to meeting its ‘net-zero emissions’ target”. We’re half-way there, yay!
Sorry to burst your bubble, @CarbonBrief, but let’s take a look at the recent real data.
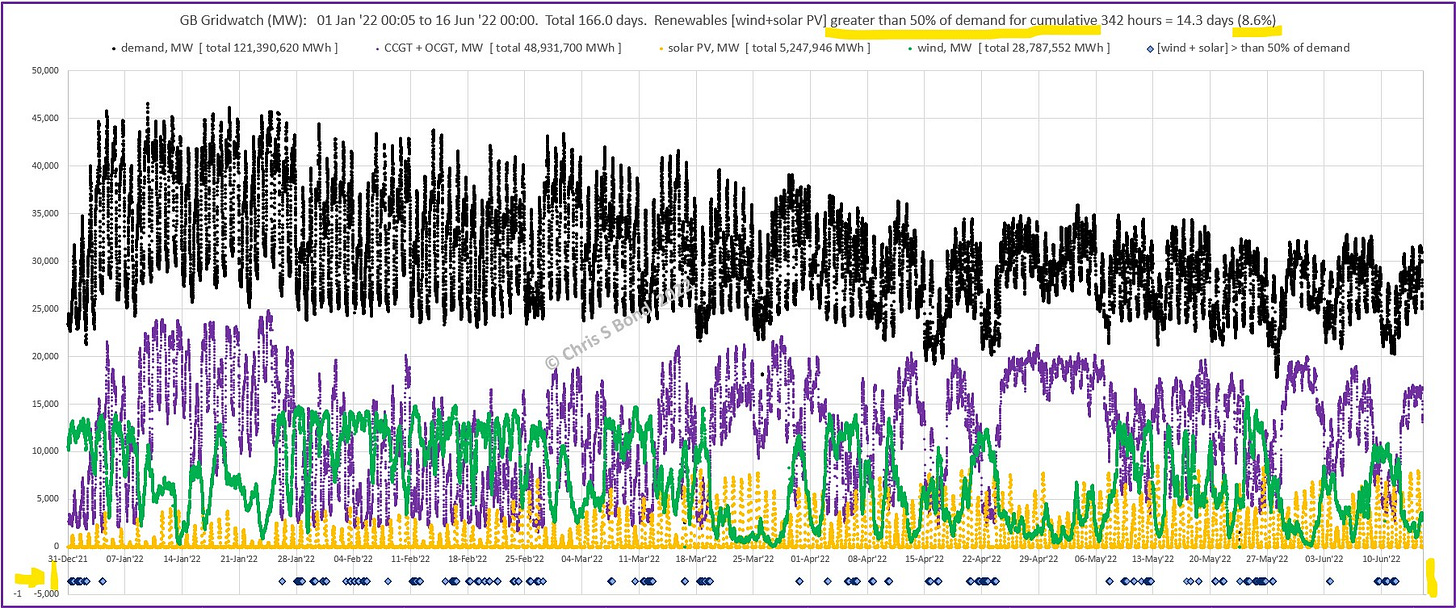
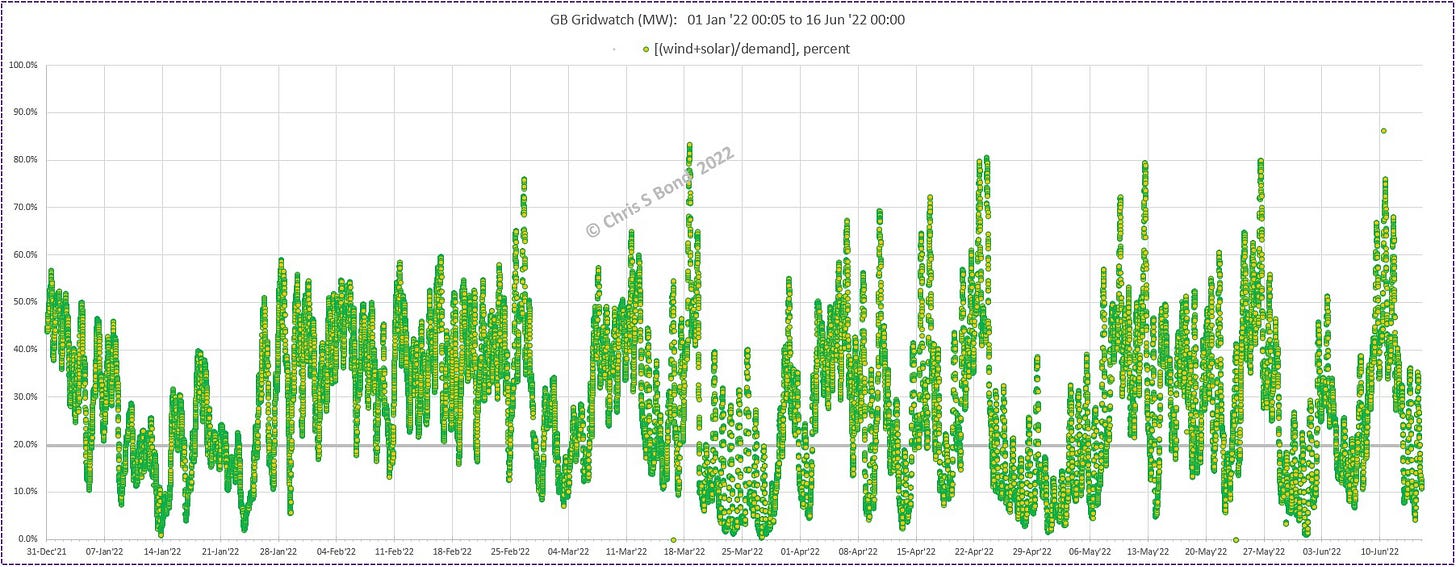
Alternatively, look at the chart of percent renewable for the same 5½ months:
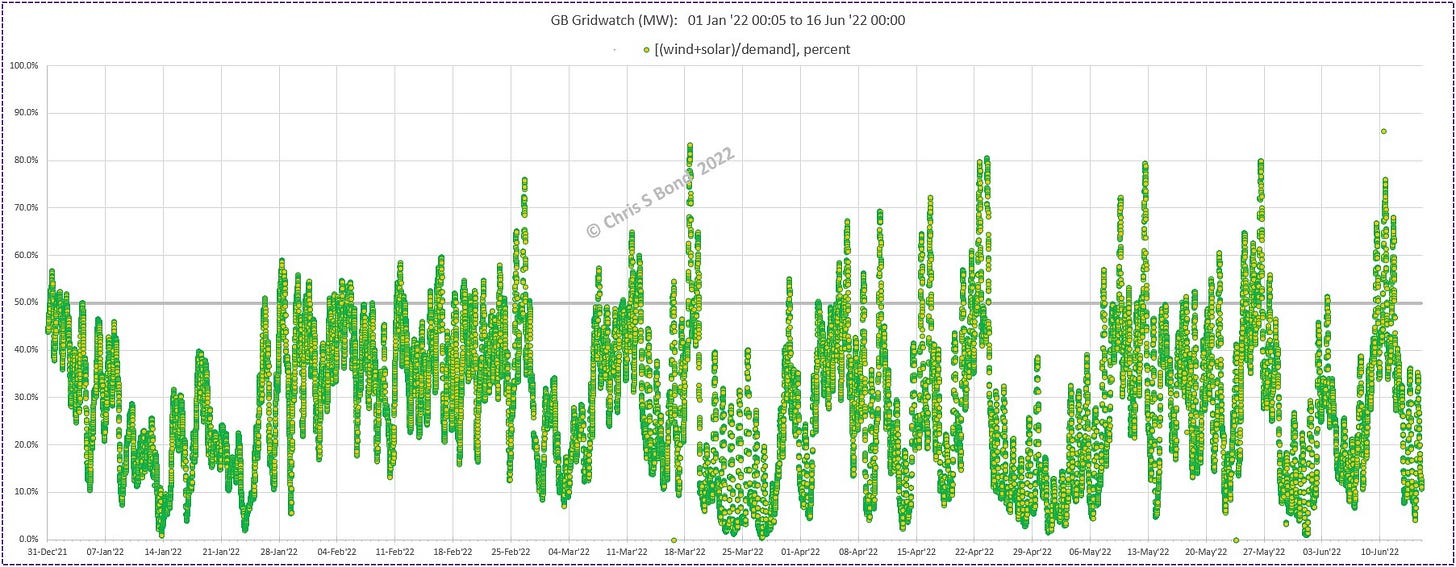
Reality disagrees with the Carbon Brief ‘analysis’. A lot.
In the British Energy Security Strategy published April 2022, HM Gov says “Our ambition is to deliver up to 50GW by 2030, including up to 5GW of innovative floating wind… by 2030 we will have more than enough wind capacity to power every home in Britain.” 50 GW of offshore wind is nearly five times current capacity. Onshore wind? HM Gov: Mumble, streamline planning process, mutter. Solar PV? [~10% load factor]. HM Gov: “We expect a five-fold increase in [capacity] deployment by 2035.” Nuclear? HM Gov: World-beating streamlined planning process, mumble.
HM Gov’s hopes seem mainly to be pinned on five times current wind capacity. So let’s re-look at the real data with ‘success’ set at 20%, because 5 times 20% = 100% success, no? Actually, no, not all the time:
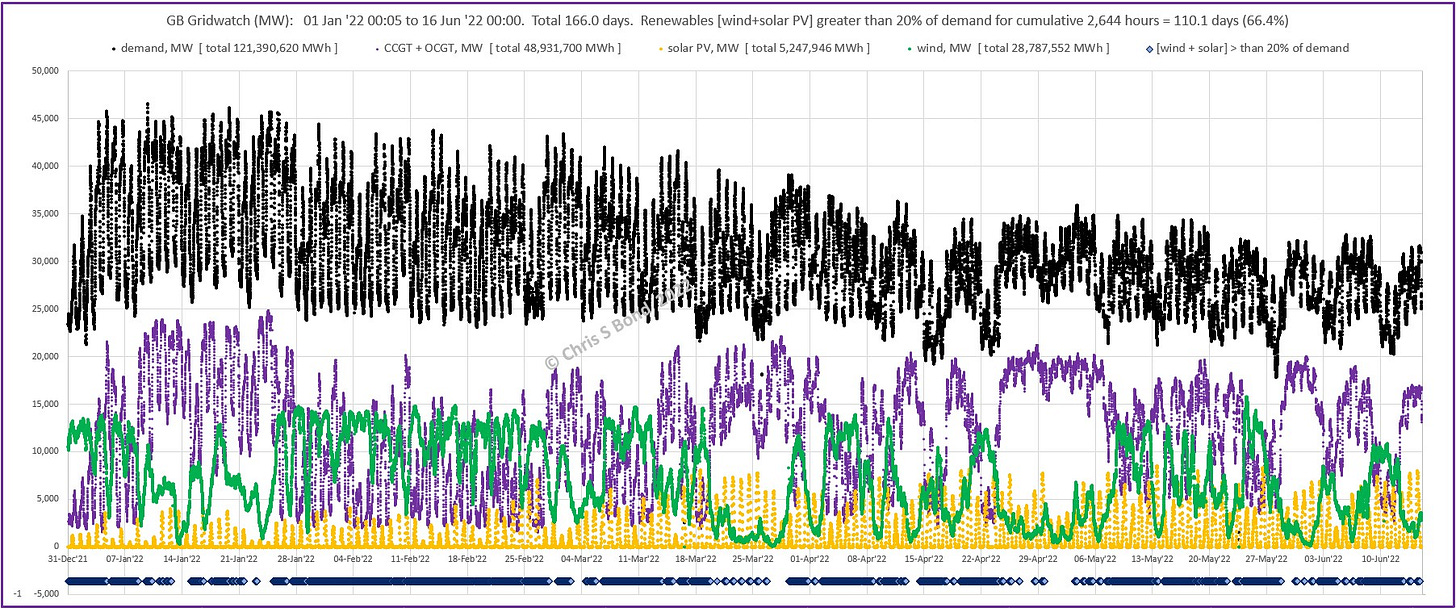
So, HM Gov’s Energy Security Strategy will result in us needing candles and / or heavy blankets for one third of the year.
On the chart of percent renewables versus demand every 5 minutes of the past 5½ months, all those dips below the 20% line would be when the lights go out.
UNLESS you also had immense long-duration energy storage… which is mentioned as a 2024 ambition in the Energy Security document: “Develop appropriate policy to enable investment in…” so that’s fine, ha ha!
Or, be more like Germany, burn coal when you need reliable power to keep the lights on and industry running. Which makes burning ‘biomass’ look ‘green’ by comparison.
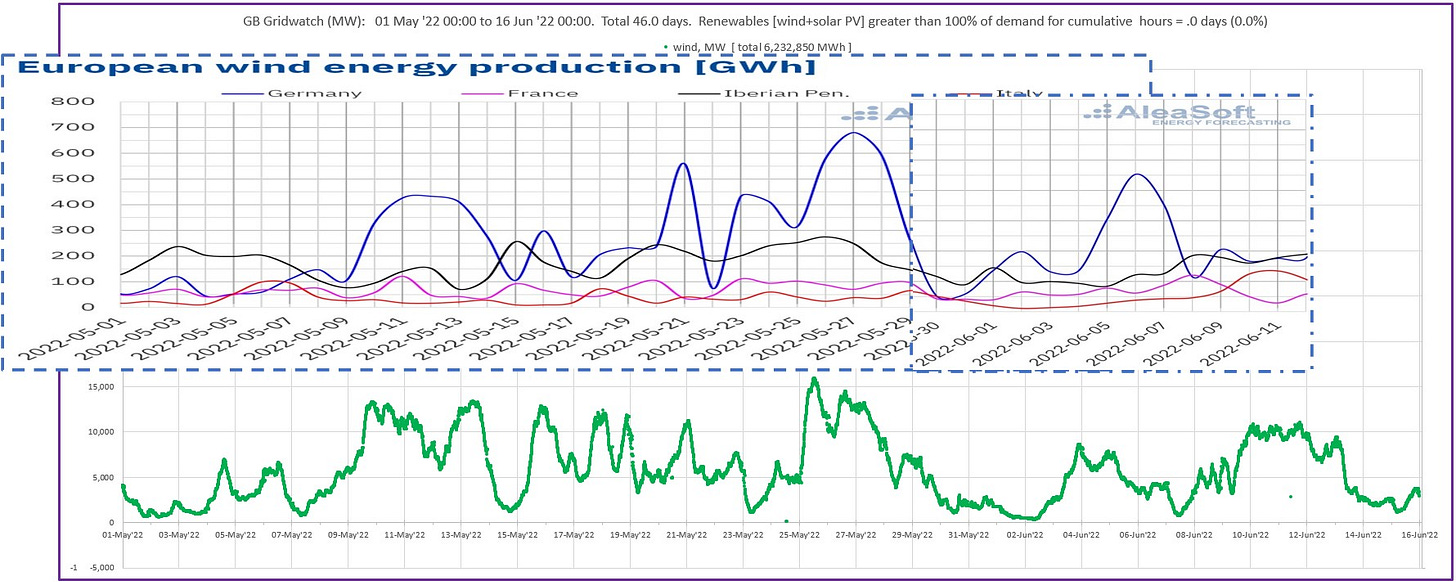
But, some people might say, we can get all the electricity we need through the interconnectors with France and the rest of Europe! Um, no we can’t. Take a look at the UK’s wind generation profile for 01 May ‘22 through 15 June ‘22 below (the green chart). I have superimposed the evwind.es wind generation profiles from Germany (blue), France (pink), Iberian Peninsula (black) and Italy (red) from two different reports from evwind.es. One report covered 01 May - 06 June ‘22, the other 16 May - 12 June ‘22. Notice the similarities in the profile shapes, the near-coincident peaks and troughs.
When wind is high across the UK it tends to be high across our near-neighbours in Europe, and vice versa. Interconnectors would not prop anyone’s fully-renewable grids up. Instead, all our lights would go out together in neighbourly solidarity.
How Much Energy Storage?
I’ve had some push-back against my estimate (for example in my Part 2 of UK plc Power Decarbonisation) of the immense 13 million MWh (i.e. 13,000 GWh) energy storage needed to enable a fully decarbonised UK power system to keep the lights on 60/24/365. That equates to about 18 days of average load. So who else is saying similar things?
Ruhnau and Qvist’s 2021 analysis for Germany alone: Storage requirements in a 100% renewable electricity system: Extreme events and inter-annual variability. Their cost-optimised solution for keeping German lights on included about 7% of the annual load = 24 days of average load.
European decarbonisation and fuel independence from Russia ‘impossible without energy storage’ of May 11, 2022. “… roughly 190GW of energy storage would be needed by 2030” to reduce CO2 emissions by 55%. I think they mean 190 GWh (=190,000 MWh) and I am sure that’s low.
Scottish Scientist, meanwhile, got in touch (anonymously) to shed further illumination on their Strathdearn mega-pumped-storage concept, about which I had expressed doubts in my second post. Those doubts were admittedly based on a third-party’s “energy blog, claiming big new dams & impounded reservoirs are "unacceptable" though many have been built world-wide for great benefit.” So I took a look at Scottish Scientist’s source material.
Disclaimer: I have not checked any of the sums behind the following numbers.
A large part of Scottish Scientist’s motivation seems to be for Scotland to have the biggest canal in the world linking the top reservoir to the coast over 30 km away. Said canal would contain “up to 216 million cubic-metres of water” and require the excavation of more than the Panama Canal’s “total of 205 million cubic-metres of material”. So I still think that getting general buy-in from the affected locals would be tricky in these NIMBY times.
The upper reservoir would be behind a “massive dam about 300 metres high and 2,000 metres long” with “superficial volume … estimated at 80 million cubic metres, not including the subterranean dam foundations”. By comparison, the Hoover Dam is 221 m high and 379 m wide and 3.4 million cubic meters of concrete was used in it. Over 20 times the concrete of the Hoover Dam, wowser!
How long does Scottish Scientist think energy storage needs to last? Based on their analyses of various months’ worth of data, 1½ days of peak demand. This estimate is lower than Prof David MacKay’s 5 days, which I showed was based on limited data available to him at the time. As Ruhnau & Qvist have shown, and I demonstrated, you have to account for cumulative surpluses or shortages of renewable generation over seasons and years. Clearly if by the end of one interval your storage ‘battery’ has gone flat, you cannot draw down from it in the next interval.
What power is Scottish Scientist aiming for? 40 GW up to 1,000 GW, according to the header graphic in the article (below).
Confining my comments to the lower of those two numbers: 40 GW = 40,000 MW is more than 20 times Dinorwyg’s 1,728 MW. Dinorwyg has six reversible, vertical Francis type pump-turbine units of 288MW capacity and about 450 tonnes weight each - huge machines. These are served by some of the largest high-performance
(60 bar shut-off pressure) ball-valves ever made. At full power the flow of water through each Dinorwyg machine is 60 cubic metres per second.
So Strathdearn would need roughly 120 sets of pump/generators and valves, each of that scale. To reduce risk they would need to be housed in separate areas, otherwise disaster could strike the whole facility.
What is the cost of this mega-scheme? You have to dig down into the comments recorded April 25, 2015 at 2:06 pm to find:
“Scottish Scientist
8 GW / 8.5 GW-days – £5.4 billion (Scottish needs demonstrator project, using about 20km of canal as the upper reservoir)
264 GW / 280 GW-days- £180 billion.”
That excludes the immense-capacity north-south intra-connectors - assuming running this scheme just within the UK. And it ignores the risks to the South’s energy security if Nationalism leads to Scotland ending the Union.
So yes, having read some of the details, I am highly dubious the Strathdearn mega-pumped-storage concept would ever be given the green light as compared to, say, eight copies of Hinkley Point C spread around the UK @ ~£25 billion for 3,200 MW each.




Lazard's figures are junk. They say that the capital cost of offshore wind is $3.6m/MW. Recent UK units are costing £4m/MW, so say 25% more than Lazard claim. (And there is only one offshore windfarm in the US, which was more expensive still). They say maintenance is $79k/MW, so perhaps £70k. Recent UK units are spending double that.
It's a complete fiction.
Another very interesting analysis, much of which corresponds to our findings. See https://www.our-energy-future.com.