

Update from the "Saudi Arabia" of Wind Power
The Digest of UK Energy Statistics (DUKES) was updated 27 July 2023, so I took a look at what the data-tables tell us.

Summary
I processed the data in the DUKES 6.3 update of 27 July 2023 to get the latest five-year (i.e. 2018-2022) average load factors1 across the entire UK fleets of the main generators of ‘renewable energy’ viz: Onshore Wind, Offshore Wind and Solar PV. These are:
Onshore Wind 26.32 % [for each 10 MW installed you get ~2½ MW on average]
Offshore Wind 40.56 % [for each 10 MW installed you get ~4 MW on average]
Solar PV 11.16 % [for each 10 MW installed you get ~1 MW on average]
Plugging these and the other ‘renewable energy’ technologies’ five-year average load factors into DUKES 6.2 we see that the official Declared Net Capacity (de-rated) is over-estimated by a factor 142%.
We also see that, far from being the "Saudi Arabia" of Wind Power, our progress towards HM Gov’s targets for 2030 (now about 6½ years away) looks rather slower than they would hope.
Introduction
The Digest of United Kingdom Energy Statistics (DUKES) is the annual energy statistics publication produced by HM Gov’s Department for Energy Security and Net Zero (was ‘BEIS’ until recently). DUKES provides a detailed and comprehensive picture on the production and consumption of individual fuels and of energy as a whole across the UK. Some of it is in .pdf format where the analysis and interpretation are presented. For those like me who like to crunch their own numbers and arrive at their own interpretations, access to the supporting data tables is provided via the DUKES table of tables.
Load factors for renewable electricity generation
(DUKES 6.3)
Figure 6.3 A - Load Factors 2018-2022, Note 1] basis
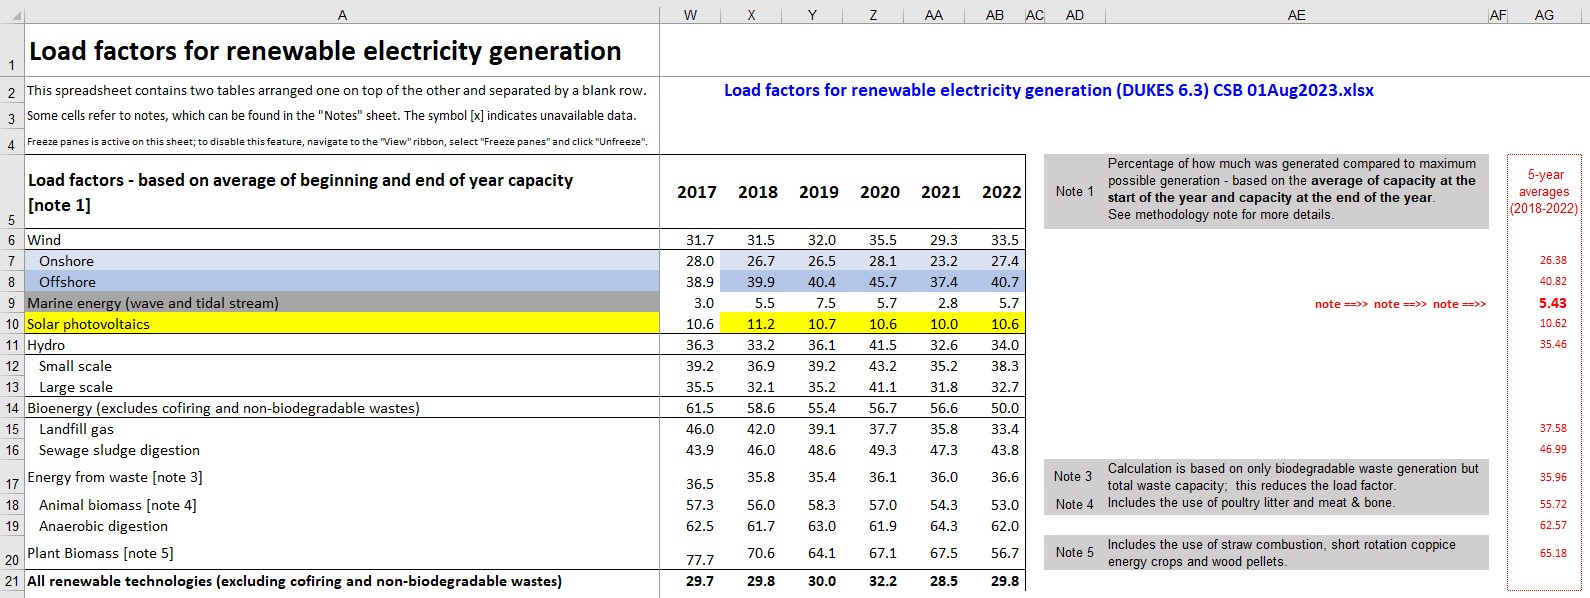
Marine Energy 5.43 % [for each 10 MW installed you get ~½ MW on average]
Figure 6.3 B - Load Factors 2018-2022, Note 2] basis
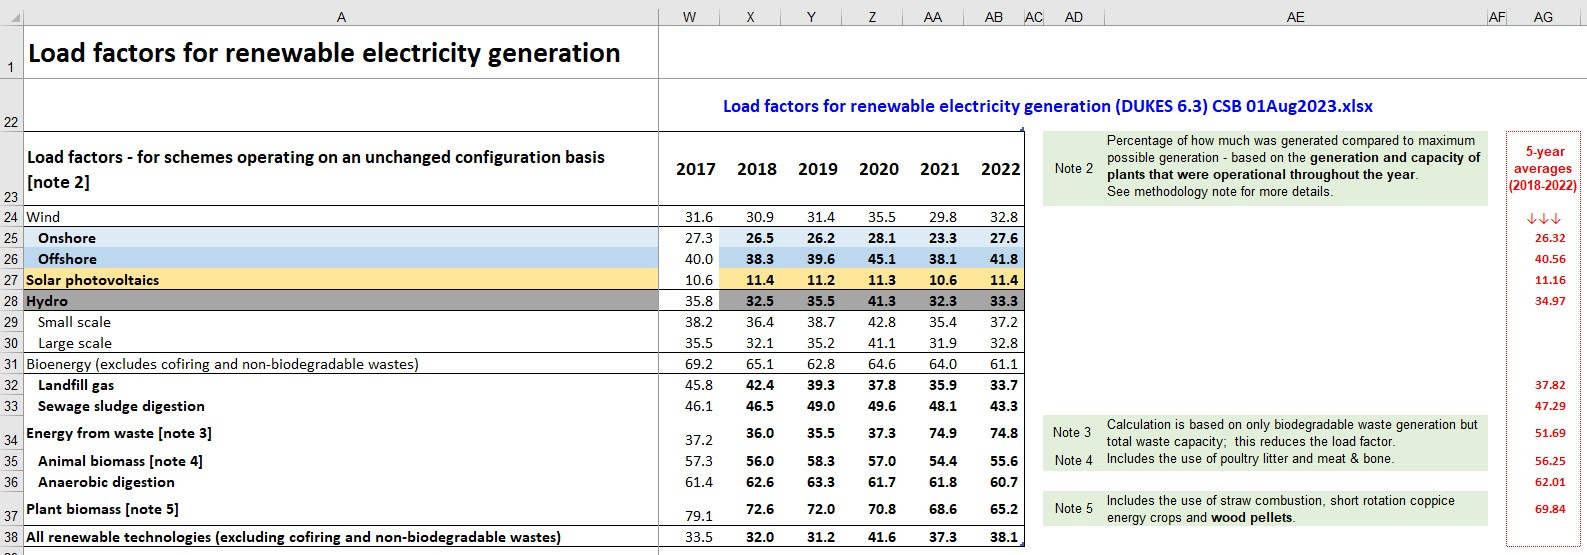
The Note 2] basis is: “Percentage of how much was generated compared to maximum possible generation - based on the generation and capacity of plants that were operational throughout the year.” [My bolding]
That basis seems to me to be more representative of the technologies than Note 1]’s basis: "Percentage of how much was generated compared to maximum possible generation - based on the average of capacity at the start of the year and capacity at the end of the year.”
The numbers are similar. I decided to use the numbers on Note 2] basis. I looked for guidance on this in the “DUKES_2023.pdf” narrative2 and found none.
The five-year average load factors come out to be as tabulated in Figure 6.3 C below:
Figure 6.3 C - Five-Year Average Load Factors 2018-2022, Note 2] basis
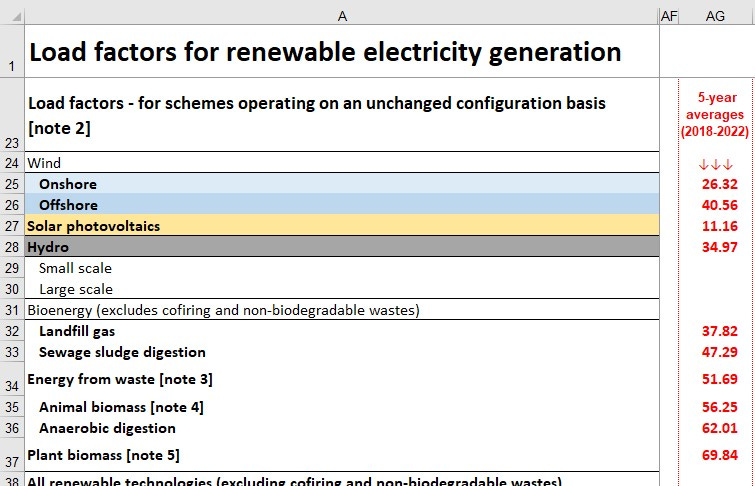
I used those actual realistic achieved-over-5-years load factors instead of Note 6]’s fixed load factors: “Hydro, wind and solar PV capacity are de-rated to account for intermittency, by factors of 0.365, 0.43 and 0.17 respectively. See section 4.10.2 and 4.10.3 of 'Electricity statistics: data sources and methodologies' for details”
I dug into the data sources and methodologies for my (half-retracted) post on the topic. The capacity de-rating factors were defined in guidance by HM Gov in 2010.
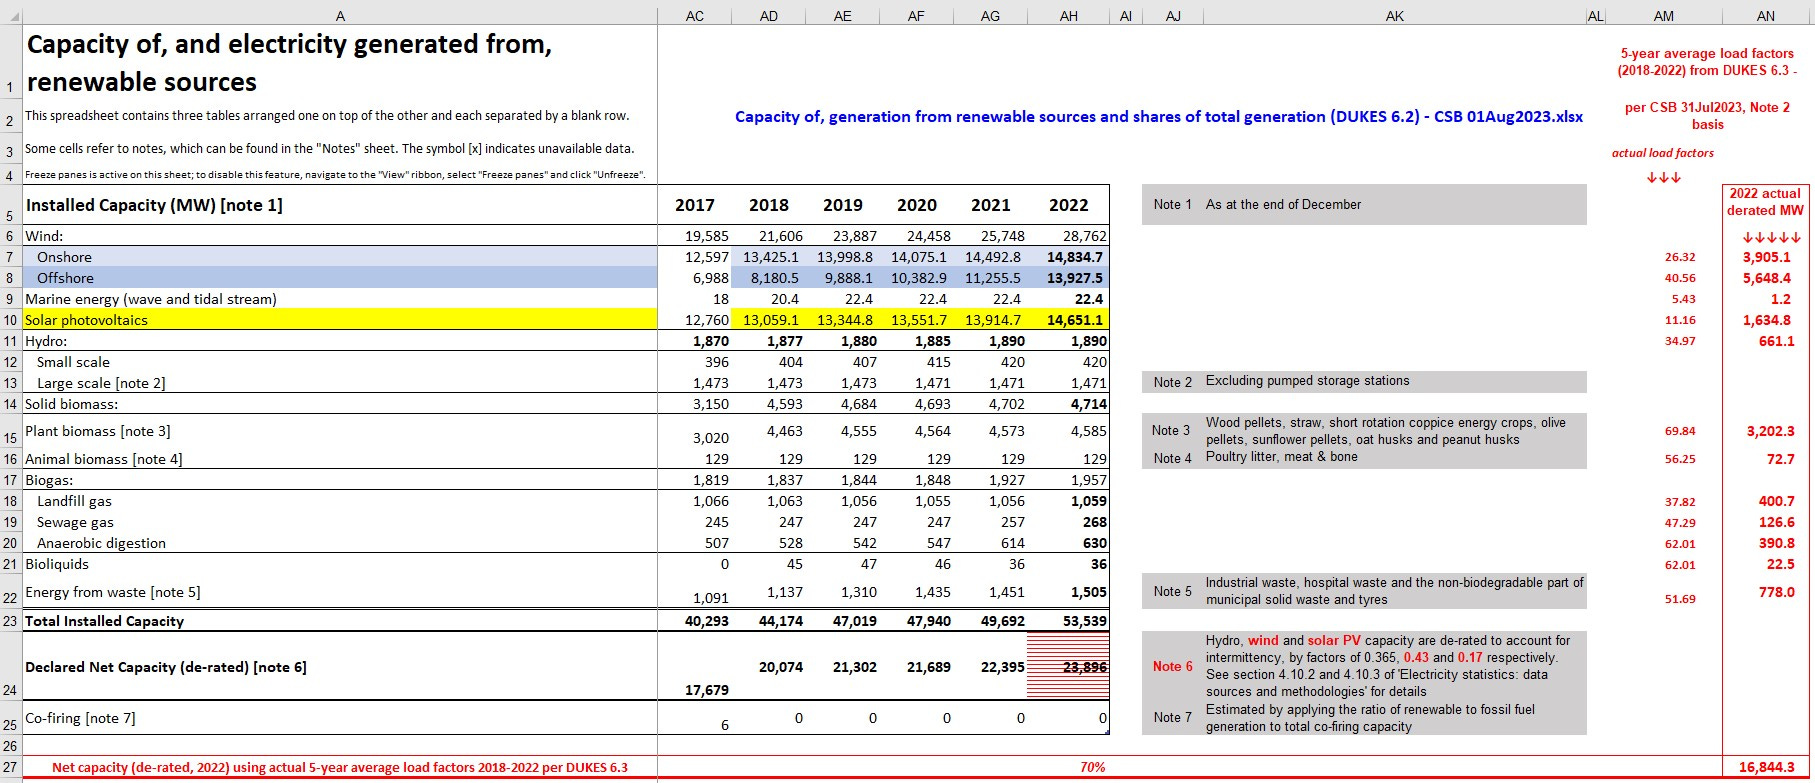
I re-crunched the numbers in DUKES 6.2 using the Figure 6.3 C load factors, and hence estimated the Net capacity (de-rated, 2022). The results are shown in Figure 6.2 and are stated here in text:
DUKES 6.2 Declared Net Capacity (de-rated) [note 6] is 23,896 MW.
Using the Figure 6.3 C load factors this number reduces to 16,844.3 MW,
i.e. 70% of the DUKES 6.2 value.In other words, DUKES 6.2 over-states the Declared Net Capacity (de-rated) by 142%
“DUKES_2023.pdf” narrative includes [under Chapter 5: Electricity, Key headlines]:
“Total de-rated generation capacity increased to 76.7 GW in 2022, 0.4 per cent higher than in 2021. Capacity for renewable technologies increased by 6.2 per cent to 24.6 GW, fossil fuel capacity increased 1.9 per cent to 43.5 GW and nuclear capacity decreased 25 per cent to 5.9 GW.” [My bolding]
No, I don’t know why the narrative “24.6 GW” doesn’t agree with the Figure 6.2 spreadsheet calculated 23,896 MW = 23.9 GW.
But I do know that a more realistic number is 16,844 MW = 16.8 GW
Figure 6.2 - *Capacities* 2018-2022 and De-rated *Capacity* 2022
Therefore I think that, if the “DUKES 2023.pdf” stated de-rated capacity for renewable technologies of 24.6 GW is ‘informing’ HM Gov policy…
it is currently seriously misleading HM Gov by a factor 142%.
That’s it for now.
Sometime I’ll take a look at whole-year 2022 per Gridwatch in light of the DUKES 6.2 numbers for total generation from Wind and Solar PV:
Disclaimer: Opinions expressed are solely my own.
This material is not peer-reviewed. This is why I’ve stopped believing it would do any good anyway.
I am against #GroupThink. And I am really pro #FreeSpeech.
Your feedback via polite factual comments / reasoned arguments welcome.
Either
Note 1] Percentage of how much was generated compared to maximum possible generation - based on the average of capacity at the start of the year and capacity at the end of the year.
Or
Note 2] Percentage of how much was generated compared to maximum possible generation - based on the generation and capacity of plants that were operational throughout the year.
I have emailed DUKES making comments and asking various questions as included in this post.
I’ll post an update if/when I get a response.
Thanks for your insightful analysis Chris.
Marine generation at 5.43% average capacity factor!
Are many others old enough to remember Tomorrow's World's prediction that 'Salter's Duck' was the future for all Britain's elecricity generation? And smile.
https://www.bbc.co.uk/news/uk-scotland-scotland-business-42988872
https://www.bbc.co.uk/news/uk-england-cornwall-40294158
https://www.walesonline.co.uk/business/business-news/deltastream-tidal-energy-device-only-12306961#
Thanks Chris. I suppose the question is what is the intended use for the derated capacity. If it’s to check whether demand can be met then they are far too high. Solar has zero output at time of peak demand, and even wind which will be higher than average over peak cannot guarantee more than a few percent.