

*Is* DUKES the Gold Standard? Part Retraction
I was contacted asking had I made a basic error? Yes I had. But it is still true that wind and solar PV *capacities* are reported on the basis of fantasy load factors defined by legislation in 2010

Observations in DUKES statistics explained
The Digest of United Kingdom Energy Statistics (DUKES) is the annual energy statistics publication produced by BEIS. It provides a detailed and comprehensive picture on the production and consumption of individual fuels and of energy as a whole. Much of it is in pdf format where they present their analysis and interpretation. For those like me who like to crunch their own numbers and arrive at their own interpretations they provide access to the supporting data tables via the DUKES table of tables. I have to date treated the DUKES data as the ‘gold standard’, such that I adjusted Gridwatch-derived renewable energy totals according to DUKES.
This post is about two of the DUKES data tables:
“Capacity of, generation from renewable sources and shares of total generation” (DUKES 6.2 ) - click on the link to download Excel file “DUKES_6.2.xlsx”
“Load factors for renewable electricity generation” (DUKES 6.3 ) - click on the link to download Excel file “DUKES_6.3.xlsx”
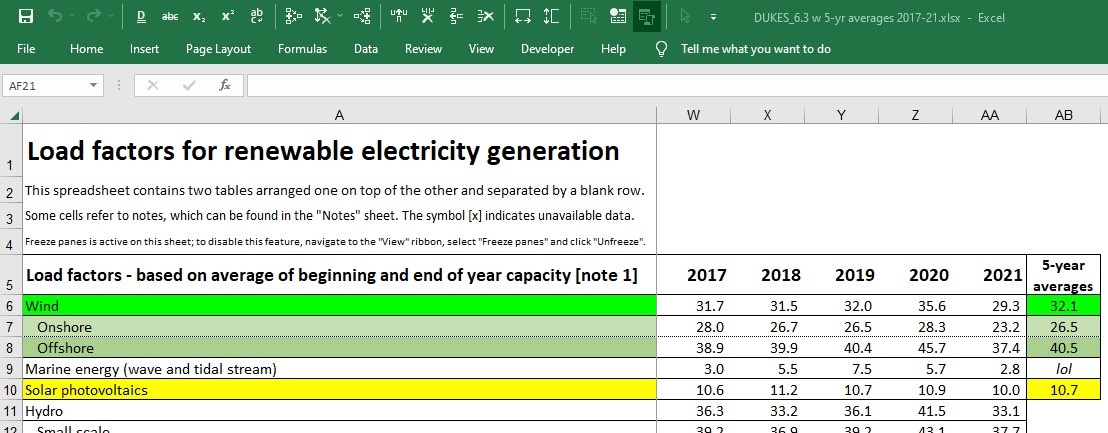
I have used DUKES 6.3 load factors in some of my previous posts, as in footnote 2 here for example. Below footnote 2 I included a screen-grab of my calculations of 5-year average load factors for wind [overall], wind onshore, wind offshore and solar PV, as repeated here.
DUKES_6.3 with 5-Year Average Load Factors


In this part retraction / major edit I realise that I didn’t apply the averaging of beginning and year-end capacities when I was crunching the numbers in DUKES 6.2. Now that I have, everything has fallen into alignment. Cutting the long story short, here are the amended results from DUKES 6.2:
Comparing with the load factors given in DUKES 6.3:
Overall a close match.
My apologies to DUKES for any alarm caused.
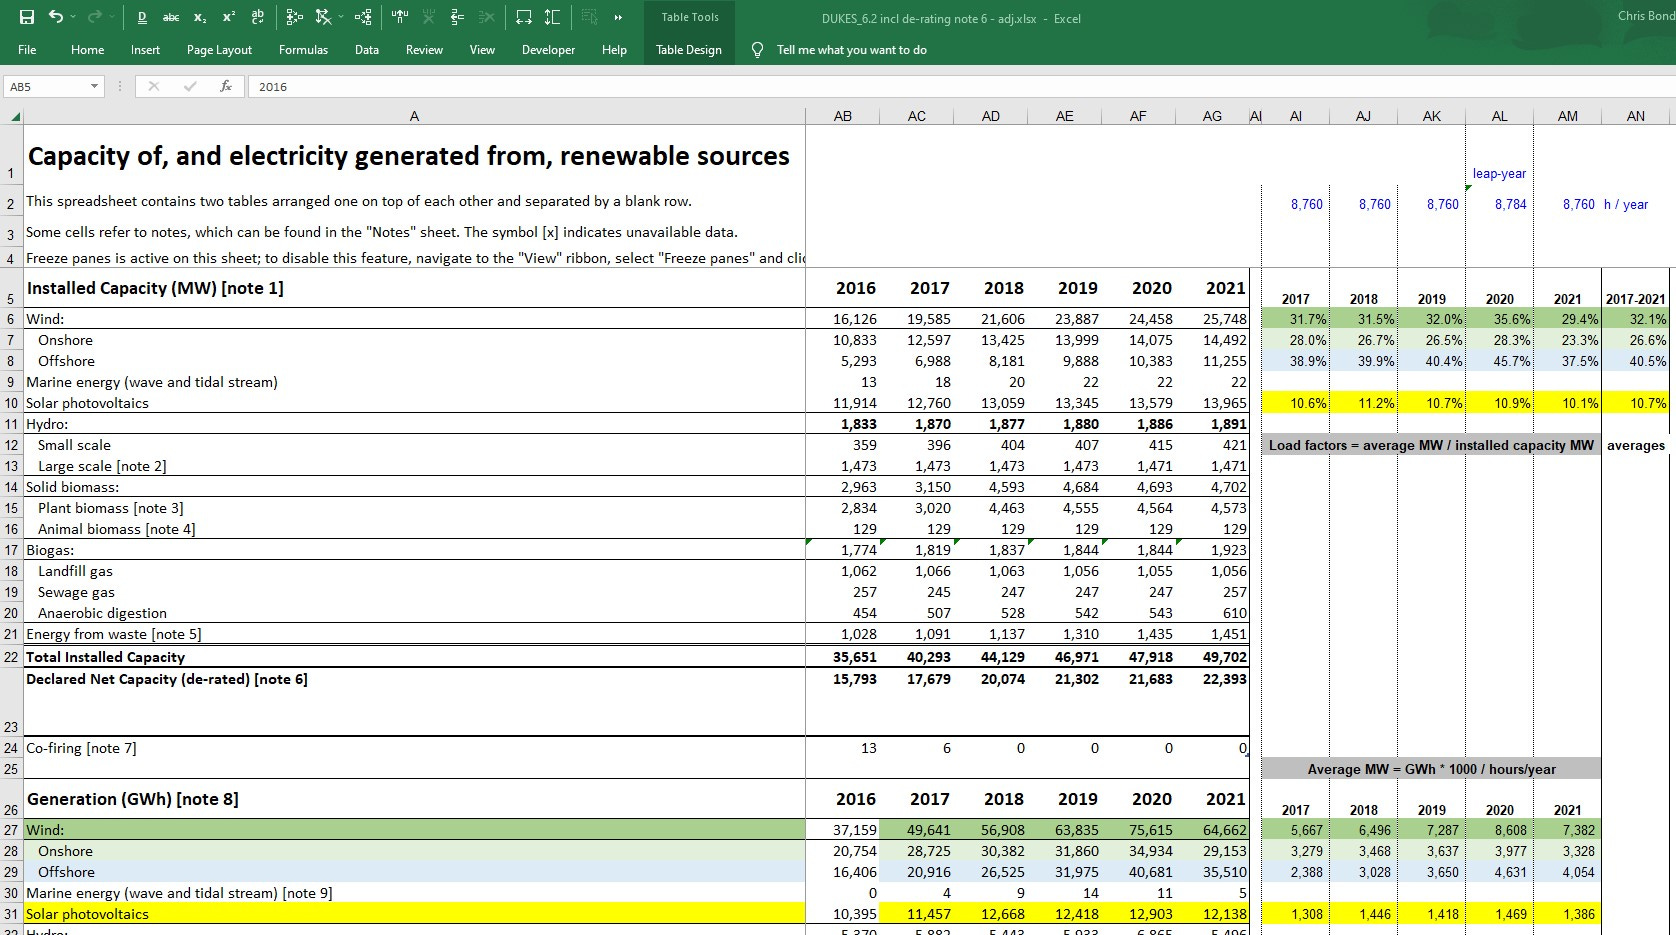
However, Note 6 in DUKES 6.2 still puzzles me. It is the note in row 23 against “Declared Net Capacity (de-rated)”. I have repeated the text of Note 6 below the graphic, added a link to the statistics source referenced, and repeat the relevant paragraph of the guidance below that.
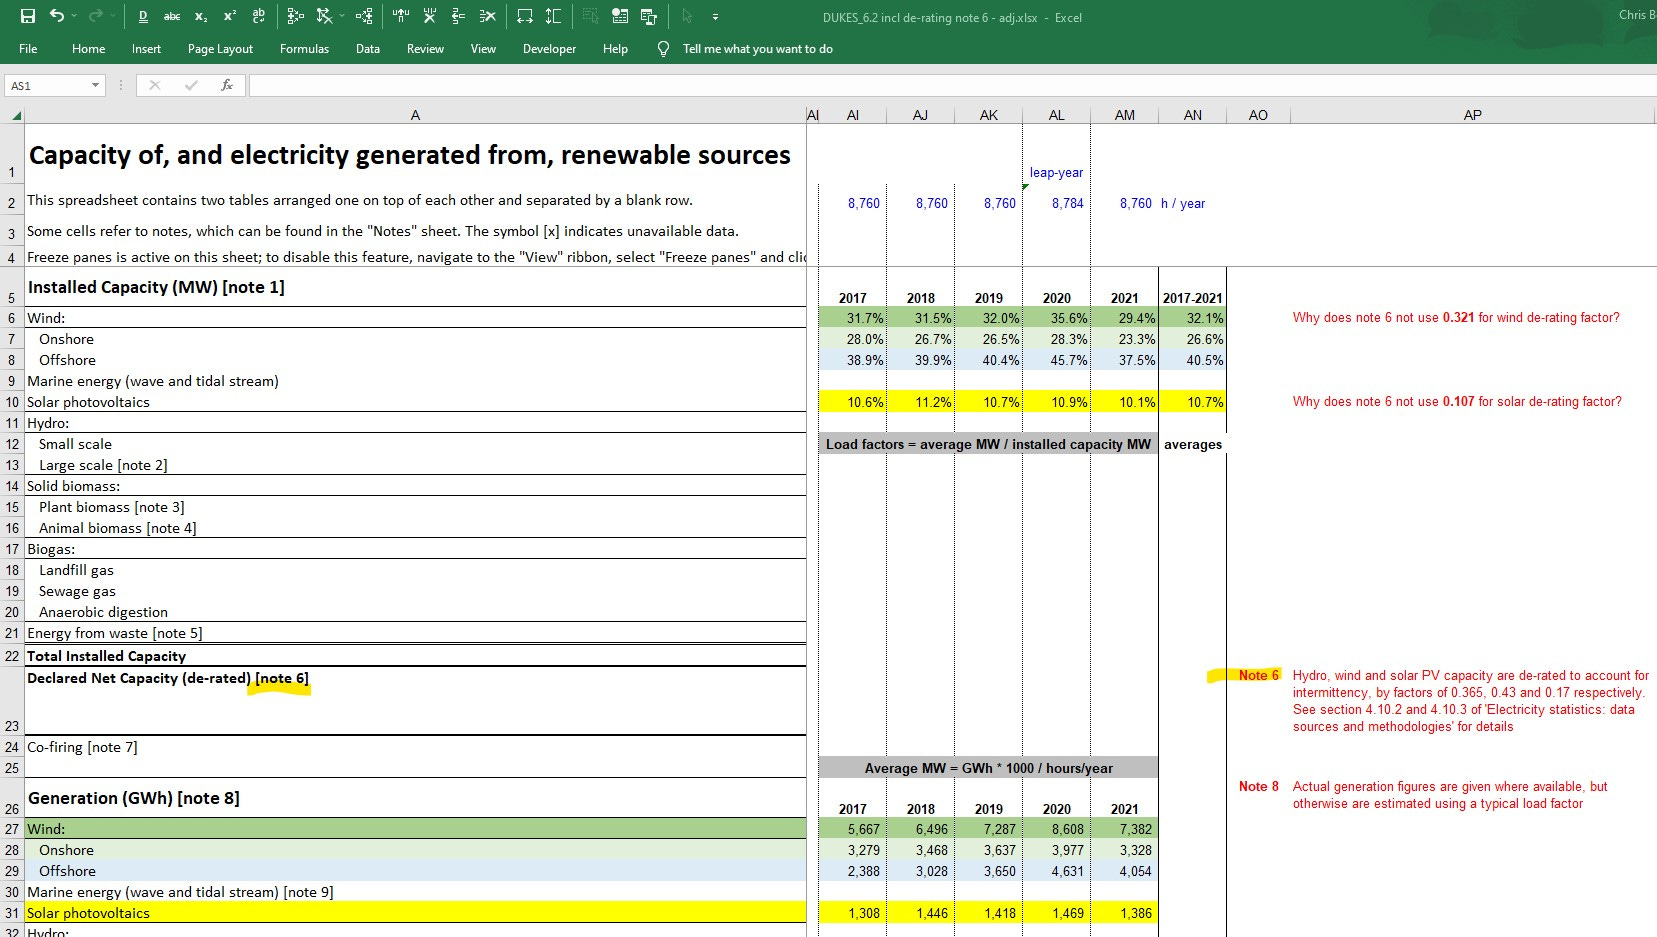
Note 6 Hydro, wind and solar PV capacity are de-rated to account for intermittency, by factors of 0.365, 0.43 and 0.17 respectively. See section 4.10.2 and 4.10.3 of 'Electricity statistics: data sources and methodologies' for details
The derating factors cited in Note 6 are different from the actual load factors DUKES itself is publishing. Maybe the clue is when the guidance was published:
9 August 2010.
The guidance 4.10.3 states:
4.10.3 Capacity derating
Derating of capacity reduces the reported capacity figure for types of generation that require particular conditions, particularly wind, hydro and solar generation which are reliant on wind, rainfall and sun. It is done in order to make comparisons with forms of generation that do not have these restrictions. Capacity is derated by applying a scaling factor to the declared net capacity of the generator. These factors are 0.43 for wind, 0.365 for small scale hydro and 0.17 for solar photovoltaics. Further information on this can be found at: www.legislation.gov.uk/uksi/1990/264/made.
[That last is a link to ‘The Electricity Act 1989 (Modifications of Section 32(5) to (8)) Regulations 1990’]
So, the capacity de-rating factors were defined in guidance by HM Gov in 2010. I doubt you’ll find a better example of politicians passing a law and expecting it to modify reality.
No, DUKES / BEIS, you are *measuring* the actual real-life load factors year on year. You can calculate a reasonable *average* actual load factor for the purposes of reporting *capacity* of types of generation that rely on wind and solar. And then you can report the resulting numbers based on *reality*.
If you did all that, maybe our politicians would be less likely to believe that we will be powered by unicorns in the near future.
Hello Chris.
[Previous comments deleted]
I have been doing some analysis on the DUKES numbers. Here are some observations.
1) Taking 2021, the capacity factors implied by table 2 (using the end of year capacity not the average) and the stated generation are: Onshore wind - 22.9%; Offshore wind - 36.0% (Combined wind - 28.9%); Solar - 9.9%; Hydro 33.2%. These are pretty close to expected so I think we can presume that the generation values are accurate, although footnote 8 signals that estimates based on the estimated (inaccurate) capacity factors may have been used if actual data were not available.
2) Again using 2021 values, if we apply the stated de-rating factors (Hydro 0.365; Wind 0.43, Solar 0.17) to the stated Installed capacity values, we get a total of 22,234 MW, which is close to the Declared Net Capacity of 22,393 MW.
3) If we substitute the calculated capacity factors in 1) above for Combined wind, Solar and Hydro instead of the 2010 estimates, the total Declared Net Capacity would be 17,610 MW, which is 20% less than the stated DNC. So, the DUKES DNC values overestimate generation from those sources by 25%! If the DNC values are used for planning, that is certainly enough to generate some false optimism.
4) I agree that the average Installed capacity for any year is a better value than the end of year but without knowing when any particular capacity actually came on line, we don't know how much better.
I'd still like to understand why there is such a large gap between the DUKES generation numbers and Gridwatch. It would be useful to know how both sets of numbers are compiled.
Thanks for your efforts, Chris.
In my opinion, DUKES is shambles, and designed to deliberately obfuscate facts about UK energy.
https://assets.publishing.service.gov.uk/government/uploads/system/uploads/attachment_data/file/1130501/DUKES_2022.pdf
To me, the most annoying fact is BEIS's narrative-based comparisons without providing Tables of Data that would enable its audience to easily compare the different variables and over time.
E.g. Year vs Year; Energy sources; Generation mixes etc, etc.
This is especially annoying because DUKES is 'UK', yet doesn't apportion data England / Scotland / Wales / Northern Ireland. (Or even Britain / Northern Ireland)
We in Britain have our grid & our data, and in real time. Northern Ireland has its SONI data. Naturally, they're not easily comparable.
https://www.soni.ltd.uk/how-the-grid-works/system-information/
/Rant over. ;-)