DESNZ to Include (some) Reality
Modelled UK Wind capacity factors are to be adjusted according to Actual Experience. Solar capacity factors, and Design Margins, next perhaps?

In late October I saw media commentary [paywall] to the effect that the ‘official’ Wind load factors used by the UK’s Department of [Energy Security and] Net Zero (DESNZ) were being reduced very substantially, as quoted below:
The Government’s new estimates slashed the predicted “load factor” – the proportion of the year turbines are expected to generate power – from 61pc to 43.6pc for offshore wind. The estimated load factor for onshore turbines was also revised down, from 48.7pc to 33.4pc.
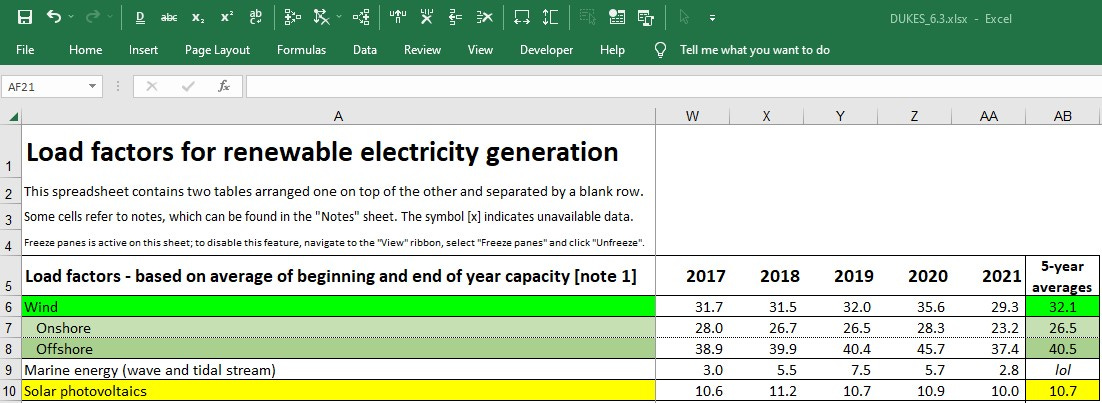
But, hang on. As long ago as Dec 23, 2022 in Note 2 of my post “Three Years’ Data and Still Not Workable”, I was highlighting the actual measured load factors as reported in the official Digest of UK Energy Statistics 6.3 [xslx]:
I put wind and solar PV *capacity* within asterisks to draw attention to the fact that the design limit of the facility is not the output you can expect from it...
Across the whole of the UK fleet of wind and solar PV, DUKES 6.3 Load factors for renewable electricity generation [xlsx] over the last five years are as shown in the table below, with the definition of “Load factor” given in the note below the table. I have added the 5-year averages column...

If you clicked on that DUKES 6.3 link today (in late 2025), you would see something confusing. My captured numbers in the graphic above for years 2020 and 2021 are different from the numbers in the July 2024 version of the “DUKES_6.3.xlsx” file. I *think* this is because, from 2020 onwards, DUKES 6.3 began reporting load factors on two different bases:
[note 1] “Percentage of how much was generated compared to maximum possible generation - based on the average of capacity at the start of the year and capacity at the end of the year. See methodology note for more details.”
or
[Note 2] “Percentage of how much was generated compared to maximum possible generation - based on the generation and capacity of plants that were operational throughout the year. See methodology note for more details.”
When I last investigated the methodology note it left me none the wiser.
Which official UK energy statistics are (more) correct?
Goodness only knows, because DUKES 6.3 gives no hint or guidance.
But here are all the numbers from the July 2025 release (I have added the 5-year average calculations in the right-hand column):
DUKES 6.3 [July 2024 version] Load Factors Last Five Years:
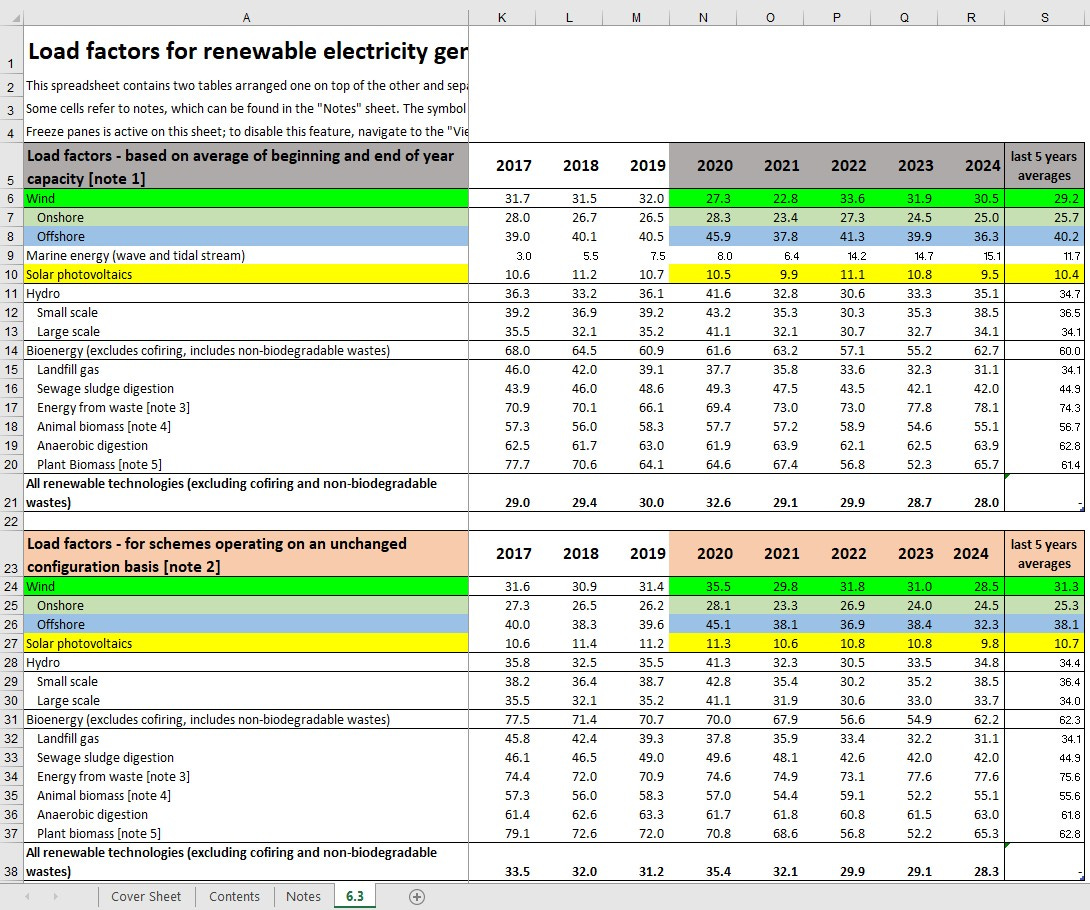
I didn’t bother generating standard deviations: I think the variability in the numbers is sufficiently obvious. I also think it’s obvious that, if the quoted numbers in that Torygraph article are valid, 43.6pc for offshore Wind and 33.4pc for onshore Wind are still wildly optimistic.
In July 2025 DNZ published its
“Wind load factor methodology note
DESNZ SICE1 Methodology to Estimate Net Load Factors for Renewable Wind Technologies” [pdf] with Contents and Introduction as shown in Figure 1
[my highlighting, obvs]:
Figure 1: Reality Dawning:
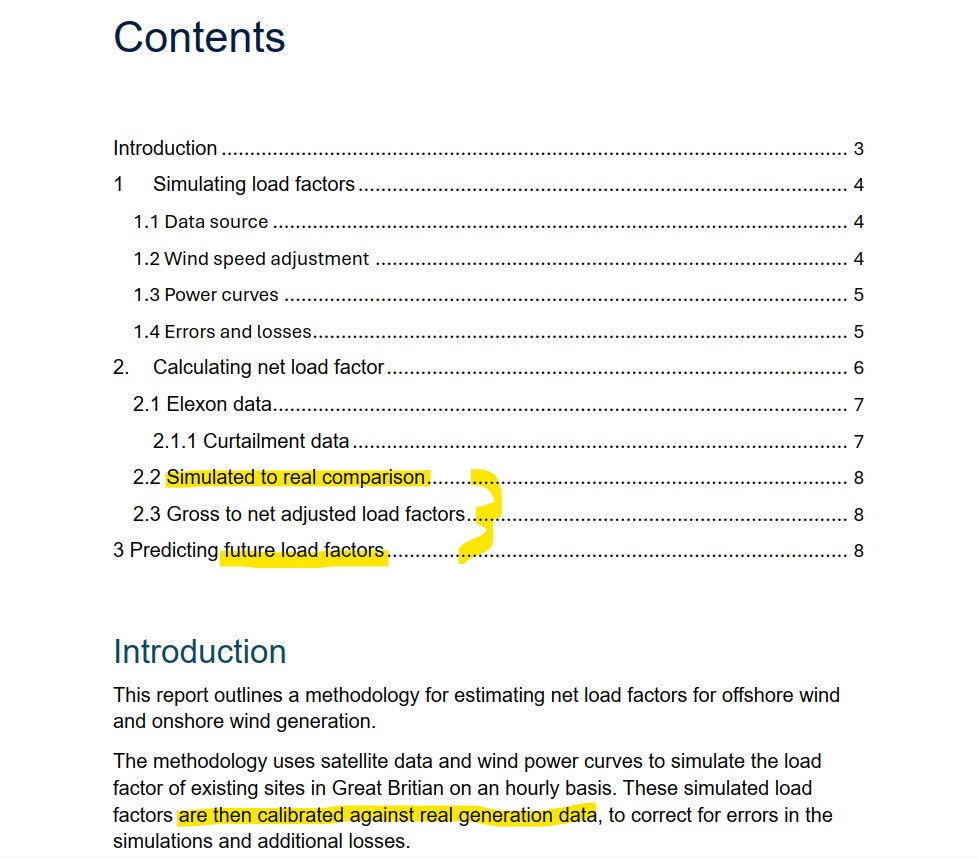
Better a late nod to reality than never, but more is needed.
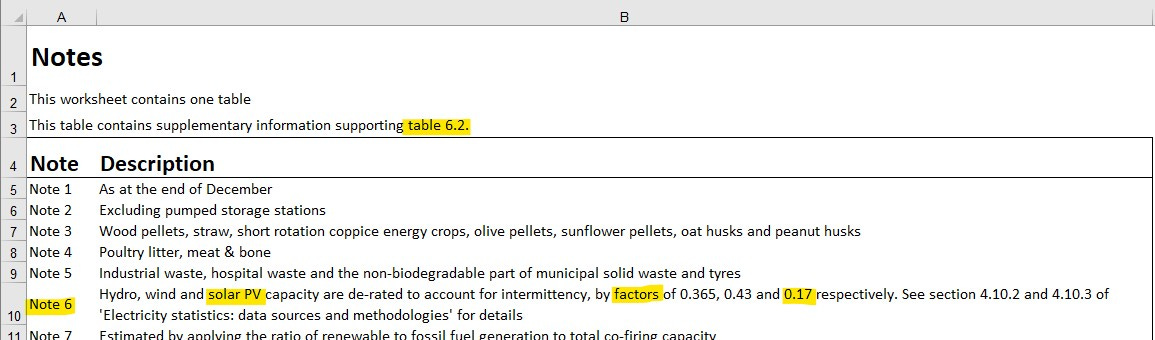
DESNZ, apply your trained minds to the Solar load factor which was fossilised with a value 0.17 by ancient legislation. Looking at the DUKES 6.3 data above it is consistently recorded at around 0.10 (10% ± ~1% ). Whereas…
Here is Note 6 from DUKES 6.2:
And last but not least, DESNZ, you need to include sensible design margins.
#KeepTheLightsOn
Copyright © 2025 Chris S Bond
Disclaimer: Opinions expressed are solely my own.
This material is not peer-reviewed.
I am against #GroupThink.
Your feedback via polite factual comments / reasoned arguments welcome.
No, the DNZ document doesn’t define what it means by “SICE”.
From a search on “SICE methodology” I think it’s Society of Instrumentation and Control Engineers.
[Sarc font] Too hard to state, obviously.
Overall this is good news
I am concerned with the words “the proportion of the year that turbines are expected to produce power” within the statement
The Government’s new estimates slashed the predicted “load factor” – the proportion of the year turbines are expected to generate power – from 61pc to 43.6pc for offshore wind
indicates that the journalist does not understand what load factor is and thus misleads DT readers
43% capacity (load) factor for offshore wind is the figure that NESO use in their CP2030 report where they write on P25:
"An additional 28-35 GW of offshore wind is required to reach a total of 43-50 GW in 2030, with average load factors (the proportion of energy generated compared to the maximum possible generation capacity) of 43% generating 167-187 TWh. Our load factors are sourced externally, are site specific for a typical weather year and change over time with the development of wind turbines. If load factors as high as 63% (as proposed by DESNZ in their Generation Cost 2023 publication) can be achieved then the same generation levels could be delivered with around 6 GW less new build of offshore wind."