How's it Going, Ed?
... after another 6 months of weather-related generation data from the UK
In case you’re unaware, the headline question is directed at The Rt Hon Ed Miliband MP, Secretary of State for Energy Security and Net Zero, who holds a BA in Philosophy, Politics and Economics from Oxford University and an MSc in Economics from the London School of Economics.
This post is a follow-up to my Great Britain Reality post from January this year. To avoid repetition I leave you to browse that post for all the background to this one.
For this post I’ve downloaded GB power data for the first six months of 2025 from Gridwatch.
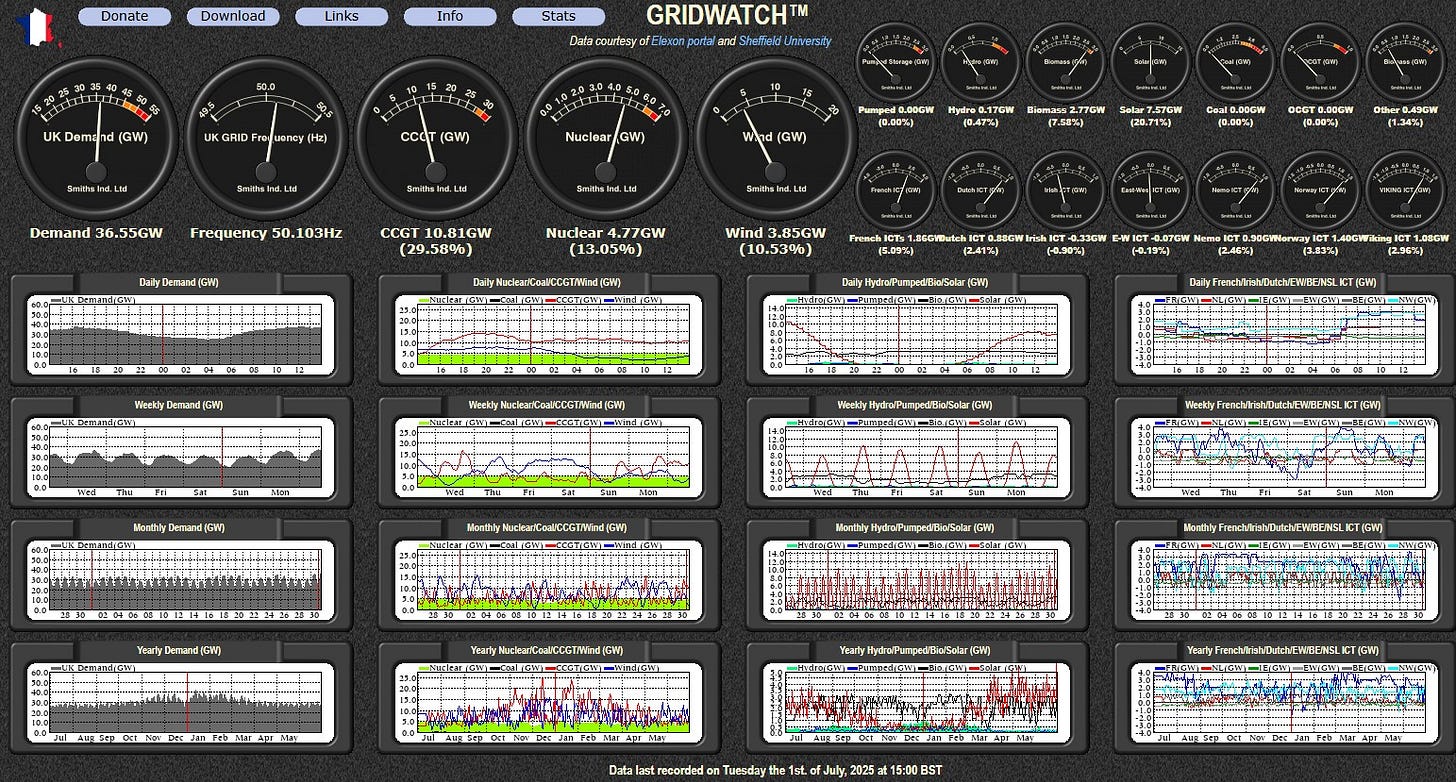
Figure 0: The Gridwatch Dashboard on 01 July 2025:
I’ve then processed this data using a copy of the ‘2024’ file I used for the ‘G B Reality’ post linked above, i.e. using all the 2024 adjustment factors and multipliers as explained there.
The downloaded set of Gridwatch data comprises GB energy flows recorded every 5 minutes i.e. 5/60 hour. From this I can plot Demand versus the other key parameters as in Figures 1.
Figures 1: 01 Jan thru 30 June 2025 per Gridwatch:


I discovered there was a short gap in the data between 2025-03-17 19:05:32 and 2025-03-20 19:20:32, but this is only 3 days (less than 1% of a year). I have just adjusted how I pro-rata-ed to 365 days to get a first indication of likely energy quantities in the brave new ‘decarbonised’ GB.
Note: in the total energy balance tables appearing on the Shortfalls with LDES charts, I have used labels “[nominal] Wind” and “[nominal [Solar]”. This is because
Generation = Demand *every* minute of *every* hour of *every* day
The future extrapolations produce arithmetic results (future Wind + future Solar > Demand on ‘good’ days, and vice-versa) which are nonsense on stilts - grid stability demands all surpluses or Shortfalls are corrected in real time:
- [nominal] Surpluses that cannot be dispatched to empty energy storage or other reliable schedulable Demand would have to be constrained = curtailed;
- Shortfalls would have to be filled by dispatching controllable energy storage (if available) or controllable fossil generation;
- I refuse to accept ‘Demand Management’ as an option because it is ‘de-industrialisation’ by a different name.
Before I can extrapolate to a future scenario via Demand, Wind and Solar multiples, I have to adjust the raw Gridwatch numbers to get closer agreement of total energy from each source with the most-recently-available official record (DUKES). All as explained in the ‘G B Reality’ post.
Figures 2: 01 Jan thru 30 June 2025, Adjusted to ≈ DUKES:


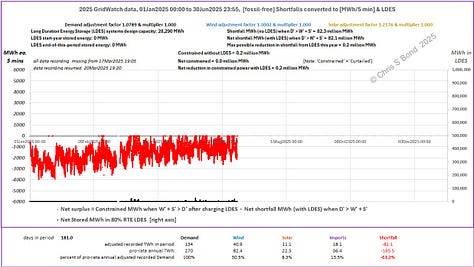
As you can see in Figures 2, GB is getting close to having sufficient ‘renewable’ energy on good-weather days so as to reduce Shortfalls to ~ zero on those occasions. However, we do rely on power imports of up to ~10 GW at times via the interconnectors.
Into the Future
So, let’s see how this half-year of real weather-dependent power generation looks when we extrapolate to end-2030 via Wind and Solar (and Demand) multiples.
I make the gross assumption1 that, despite its dithering and general ineptitude, HMGov will by the end of 2030 still have the same largely CO2-free nuclear generation capacity as we have now.
Figures 3: 01 Jan thru 30 June 2025, Extrapolated to Dec 2030:
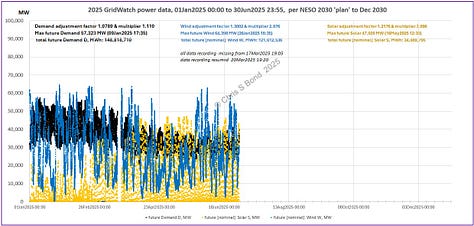

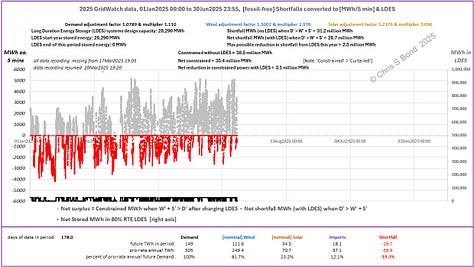
Note the extreme peaks of both Wind and Solar, and the rate of change of both, in the left chart. All the sources of ‘firming’ will have to ramp as fast to keep the lights on.
I have assumed for simplicity that imports & exports (centre chart) remain as-is.
(It is possible that by December 2030 more interconnectors will be operating, although it’s worth noting that Norway for one is pushing back against selling its precious carbon-free Hydro [paywall] at the same time its citizens are growing increasingly resentful of importing high European energy prices. But the sheer magnitude of the UK’s future [potential] surpluses and Shortfalls means that interconnectors are never going to have sufficient capacity to cope anyway… and that’s ignoring the introduced energy security risks with undersea infrastructure vulnerable to dragging anchors (or worse). It’s also probable, weather systems being the large-area phenomena they are, that the opposite parties in Scandinavia or Northern Europe would be enjoying similar weather-dependent gluts and Shortfalls at roughly the same times.)
The centre chart shows the peak power Shortfall is 50,000 MW = 50 GW. That’s the total capacity of the ‘firming’ (likely from gas turbines) that would be needed to keep the lights on in the worst circumstances this half-year. The peak Shortfall occurred 22nd January at about 6pm when Solar was zilch. (I discuss below what difference a credible capacity of energy storage would have made.)
The right chart (wherein note: power flows are converted to MWh per 5-minute interval) assumes that the total existing capacity of energy storage in the UK (currently comprising mostly pumped hydro, plus some batteries) could be dedicated solely to storage and discharge of fossil-free energy to mitigate against fossil-free Shortfalls. I know it doesn’t operate that way now, but it illustrates the reality of just how minimal it is.
The energy balance from the right-hand chart in Figures 3 is shown in Table 1.
Table 1: GB Energy Balance, December 2030 - Unchanged LDES:
Using first-half GB data and extrapolating to December 2030 according to what I understand is NESO’s plan (see my ‘G B Reality’ post for a discussion around that), it looks like GB will need just over 19% of Demand to be generated by fossil-fuelled sources… otherwise the lights would go out… frequently.
Figures 4: Extrapolation to Dec 2030, Varying LDES Capacity:


In the charts in Figures 4 the peak Shortfall is unchanged with the change of LDES capacity: in each case it is -4,190 MWh per 5 minutes (i.e. just over 50,000 MW ~ 50 GW, the same as remarked above). This is because 22 January was at the end of a low-Wind interlude lasting a week. By the end of such a long-duration lull, quite typical at almost any time of the year, any credible capacity of LDES would go flat as a pancake so there would be no stored energy to mitigate the Shortfall. Only some extremely dramatic and unlikely advances in cheap energy storage in the next 5-6 years could even begin to change that result.
The energy balances from the charts in Figures 4 are shown in Table 1 above, and Table 2 and Table 3 below.
Table 2: GB Energy Balance, December 2030 - Doubled LDES:
GB will still need just over 18% of Demand to be generated by fossil-fuelled sources if we could somehow double the available capacity of long duration energy storage (LDES) by December 20230 and dedicate it solely to storage and discharge of fossil-free energy to mitigate against fossil-free Shortfalls.
Table 3: GB Energy Balance, December 2030 - Quadrupled LDES:
… this would fall to just over 16% of Demand generated by fossil-fuelled sources if GB could somehow increase by four times, the current available capacity of long duration energy storage (LDES) ... etc.
None of those results are remotely close to NESO’s planned 5% fossil generation by the end of 2030.
I wonder, has 2025 thus far been an unusually uncooperative year, weather-wise?
Or are the ever-increasing constraints / curtailments showing themselves in the overall quantities of useful generation?
Time will tell.
Subsidies to Date
The GB ‘renewable electricity’ subsidy regime has, over the last 20+ years, paid out around £220 billion (in 2024 prices), all of which ultimately ends up in our power bills. This is equivalent to nearly £8,000 per household over that ~20 years. The Renewable Energy Foundation analysis shows that the total subsidy cost per unit of ‘renewable’ electricity generated is approximately £200/MWh currently… in addition to whatever the facility owners are paid for the power they produce.
Final Thought
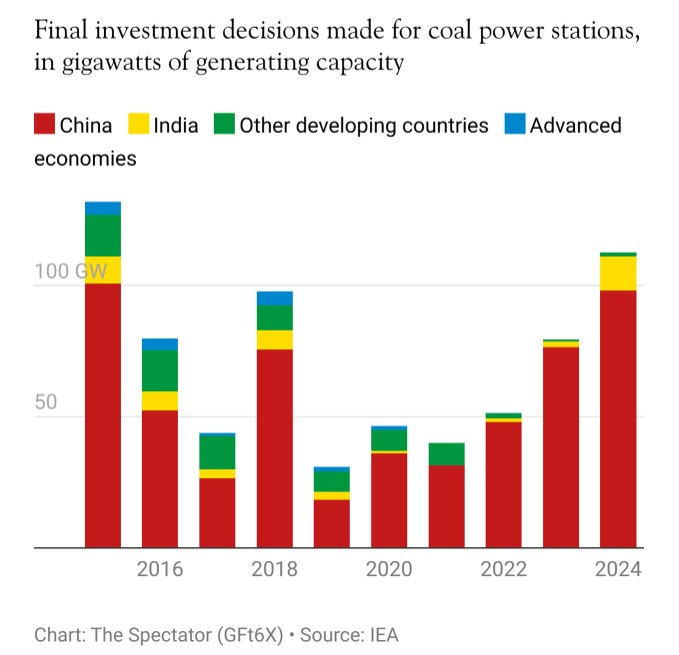
Last but not least, to show GB bill-payers it’ll all be worthwhile... a reminder of how the rest of the world is eagerly following the path HMGov is demonstrating with its inspirational leadership2 and unswerving commitment3.
Copyright © 2025 Chris S Bond
Disclaimer: Opinions expressed are solely my own.
This material is not peer-reviewed.
I am against #GroupThink.
Your feedback via polite factual comments / reasoned arguments welcome.
Probably hopelessly optimistic.
Substack *really* needs a sarc font / style for sentences such as this.
Commitment to our de-industrialisation and impoverishment, that is.



Chris,
with regard to storage, and companies’ duty to shareholders, I presume that the battery will be kept at an optimum charge level when not discharging.
What interests me is what is the source of charging power? While solar farms with BESS do not specifically say they use their own generation to keep them charged, the public would assume that to be the case. In winter, with very little solar generation and the need for the rapid response for peak lopping input to the grid being much higher, I would assume that grid power would charge these batteries with a corresponding increase in CCGT (gas) generation to meet this extra demand.
To get to the point, from the above, I am surmising that the reason companies build battery storage is pure money making rather than an actual requirement from a grid perspective assisted by government approval?
Thanks for another insightful post. Why is it that government agencies can’t produce & publish this type of analysis?
I appreciate your concern that curtailing loads leads to deindustrialization, but would it not be pragmatic to consider limited demand management together with fill-in carbon based generation capacity as part of a transition strategy.
Would variable pricing of power not result in “voluntary” curtailment of demand? Of course relying on market forces does not necessarily result in the best outcome for society as a whole, which leads back to strategically identifying demand that can be curtailed…