

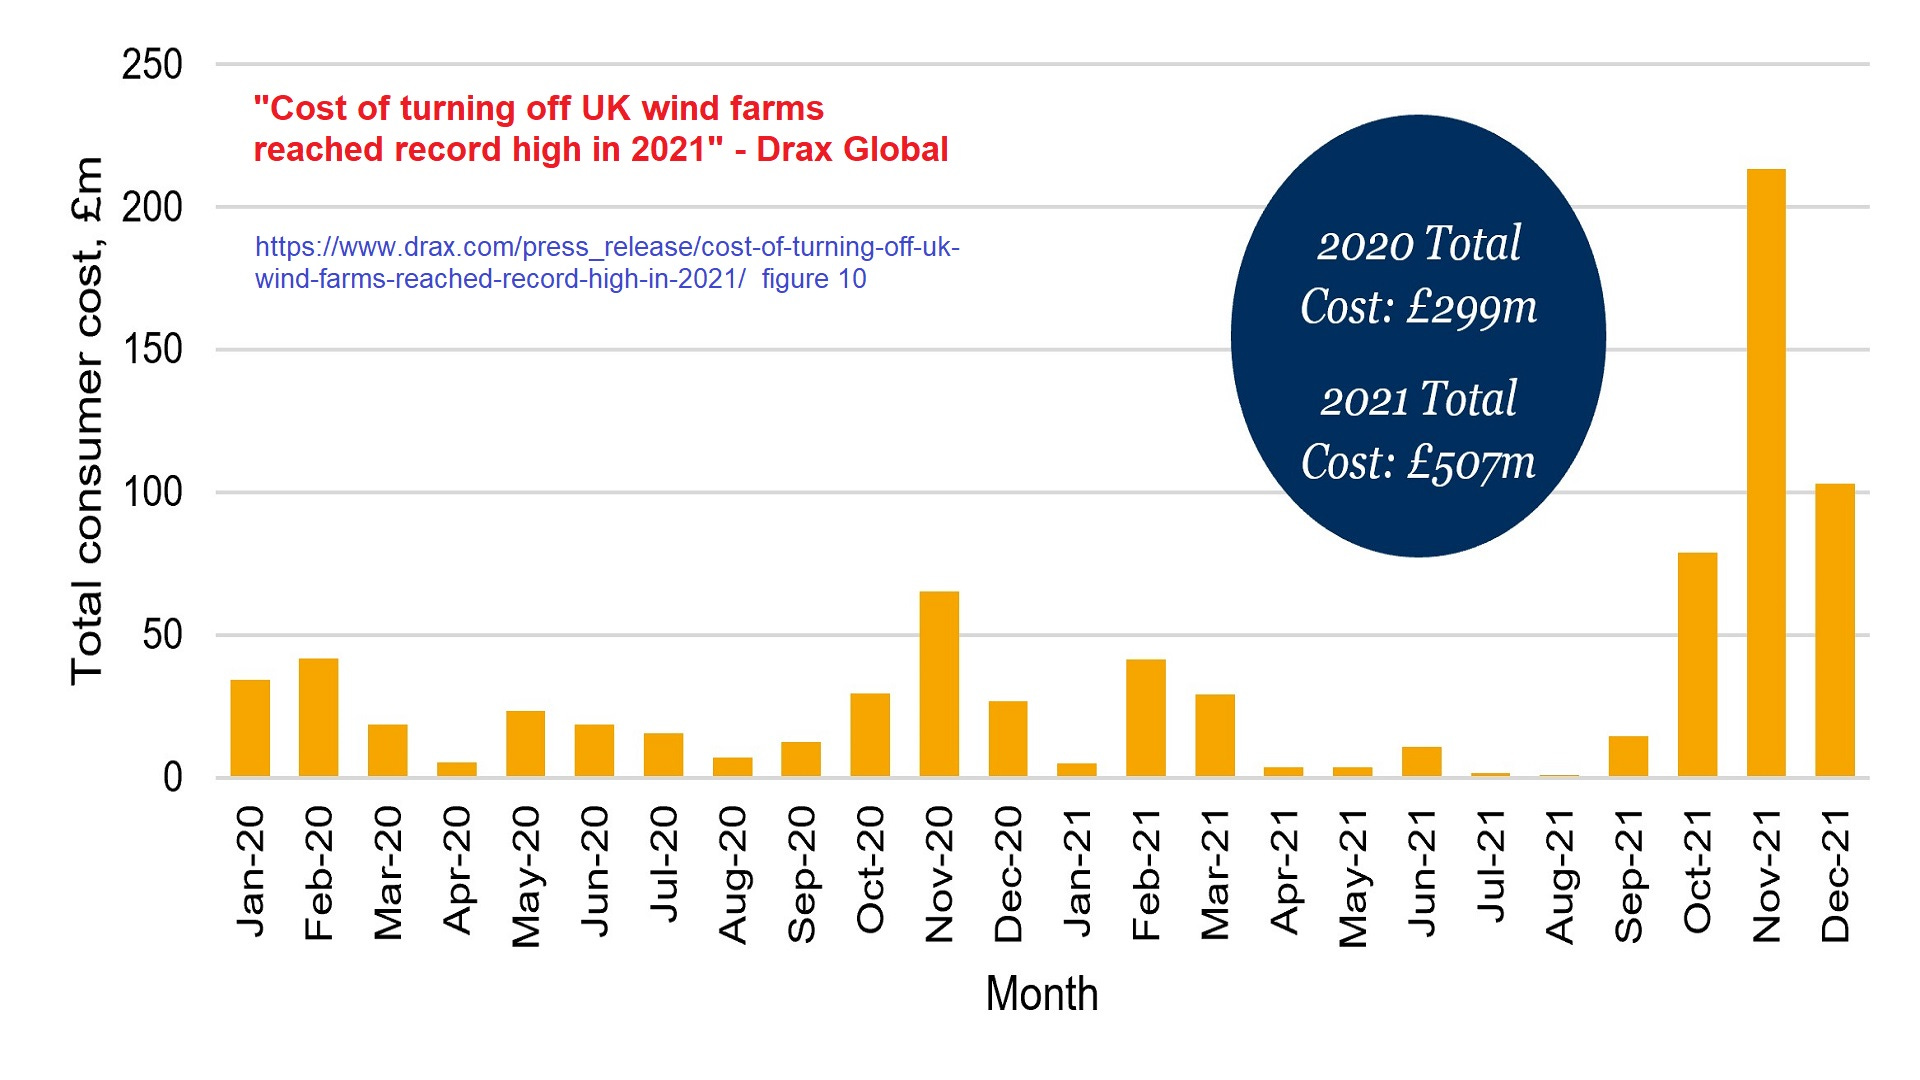
Solar Power - a Growing Problem
What to do about too much ‘free’ energy

Summary
The huge surge of Solar power injected into the GB grid every 24 hours in summer makes curtailment more likely and hence increases costs to consumers.
Therefore any new Solar facility should be designed as a system required to produce steady power output throughout each 24 hours. Unless it produces consistent smoothed power it should not receive consent / funding.
As battery technology is improved, battery capacity should be added to existing Solar facilities to smooth their outputs.
Same Basis as Previously
As I explained in my 23 December post, I am now applying adjustment factors1 to the wind and solar PV power data as recorded by Gridwatch. I continue to use the same units: mega-watts (MW) for power flows and mega-watt hours (MWh) for quantities of energy. Supply must balance demand2 every minute of every day (i.e. 60/24/365)
20 April 2023 – a ‘good’ solar day in Great Britain
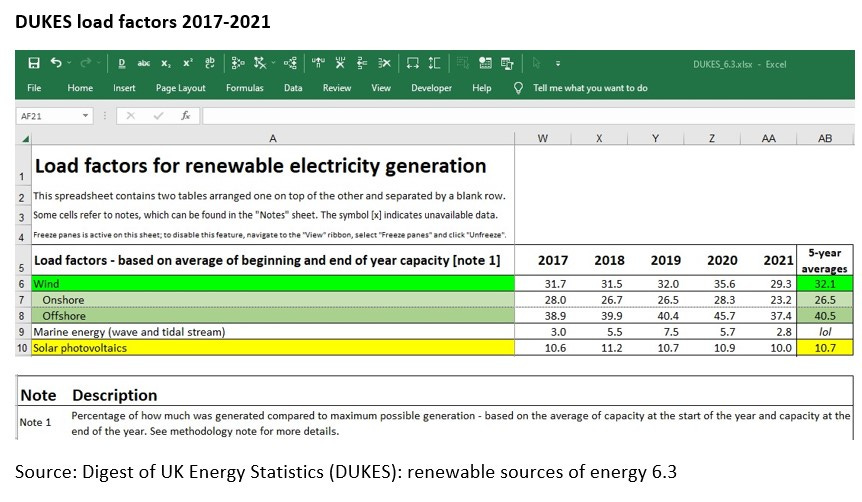
The latest Digest of United Kingdom Energy Statistics (DUKES) published mid-2022 stated that the total installed *capacity*3 of Solar PV is 13,965 MW. From that fleet (plus recent additions), the power generated - as estimated by Sheffield University and reported by Gridwatch - on 20 April 2023 is plotted below.
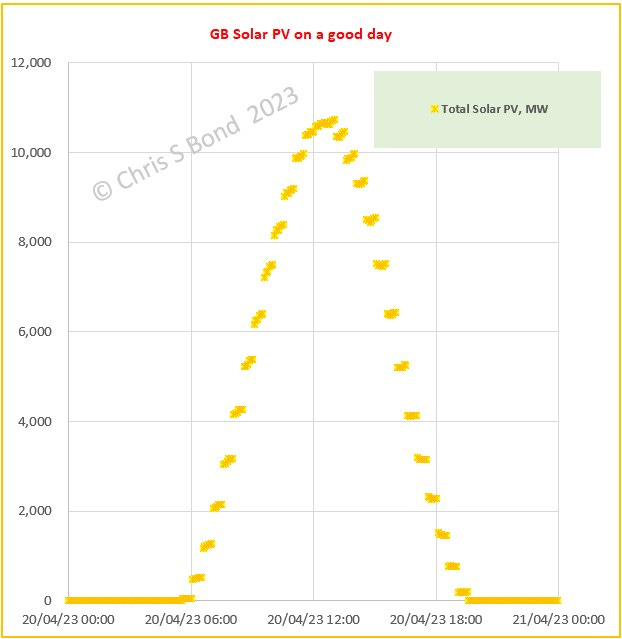
It was a lovely sunny day across the GB fleet of solar panels, giving rise to a peak power generation rate (MWp) of 10,716 MW. That’s a surge of 10.7 GW that rose then fell back to zero in about 13 hours. Which the GB grid infrastructure, dispatchable power generators, interconnectors, etc. just had to suck up and cope.
Peak solar power occurred at 13:00 on 20/04/23. At that time, Demand was 22,170 MW. In other words, solar briefly satisfied nearly half of GB demand.
Depending on how hard the wind was blowing, that may have resulted in curtailment of excess wind. (Is that how it works, does Solar power get first refusal? DKDC.)
You don’t have to extrapolate this situation too far before you are curtailing more and more of this ‘free’ power. Which currently costs us a lot.
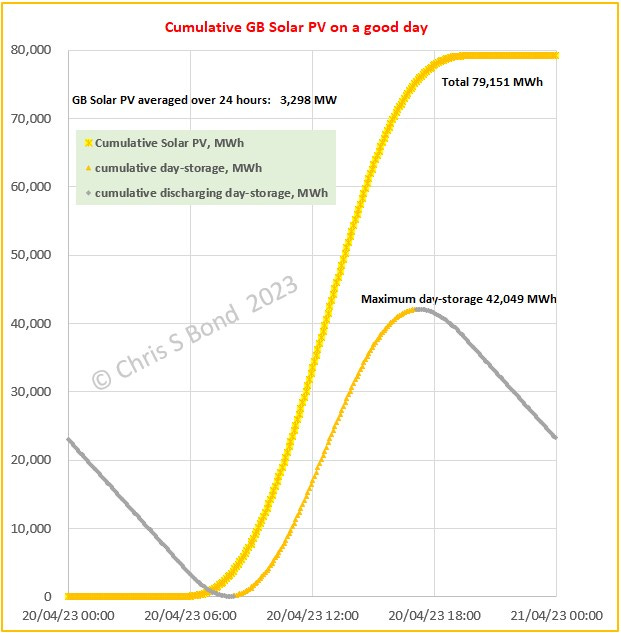
What was the total quantity of Solar electricity accumulated on 20th April? Add them all up and you get 79,151 MWh. Averaged over 24 hours, on that sunny day GB Solar PV was 3,298 MW. (Instantaneous load factor 3,298 MW / 13,965 MW = 23.6%)
Now what *could* the situation have been had our ‘leaders’ had the foresight to insist on performance criteria for Solar PV facilities. Not just “You’ll get what you get in the daytime and zero at night and the rest of the grid will just have to cope somehow”. Instead, “It must produce steady power output throughout each 24 hours and not overload either local or wide-area grid.”
Then GB would already have enormous energy storage to damp down the massive power spikes from Solar:
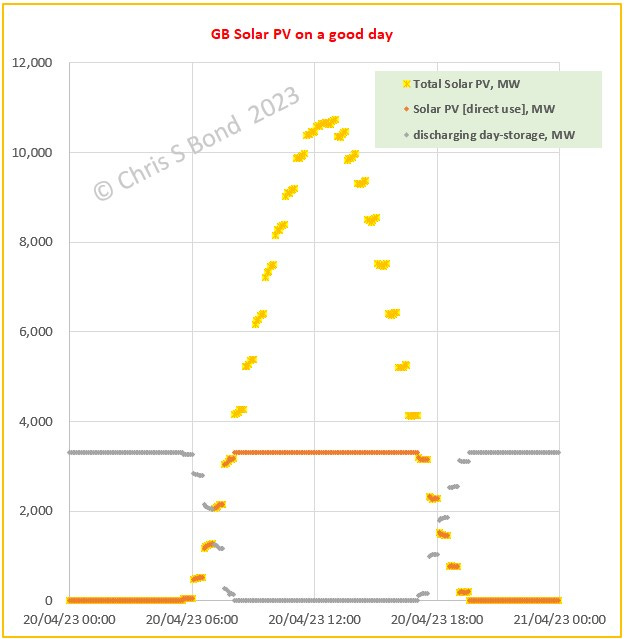
Cumulatively for the whole of GB this looks like this:
Scaling the above whole-of-GB numbers to a new 100 MWp Solar facility:
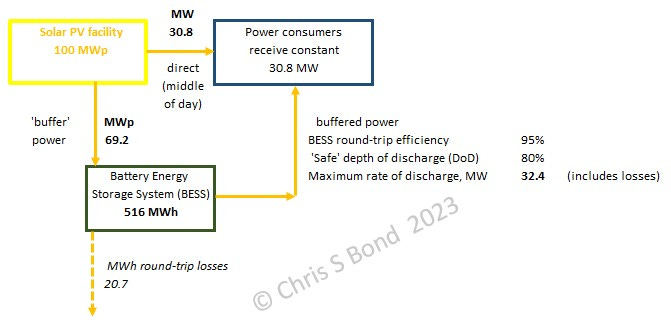
The power supplied to consumers is kept constant over each 24-hour period.
The grid loads and variability are greatly reduced.
Overall curtailment would be reduced.
Improvements in battery technology4 would be stimulated.
Of course, this doesn’t address Wind’s variability or intermittency. But Wind is far more variable over much longer timescales. Solar power is inherently up and down every 24 hours, hence is ‘easier’ to smooth.
Conclusions
Better performance criteria are required for Solar PV facilities. Any new Solar facility should be designed as a system required to produce steady power output throughout each 24 hours. Unless it produces consistent smoothed power it should not receive consent / funding.
As battery technology is improved, battery capacity should be added to existing Solar facilities to smooth their outputs.
Disclaimer: Opinions expressed are solely my own.
This material is not peer-reviewed. This is why I’ve stopped believing it would do any good anyway.
I am against #GroupThink.
Your feedback via polite factual comments / reasoned arguments welcome.
I called them ‘correction factors’ in my 23 Dec ‘22 post, but considering that Gridwatch data is not fully reconciled - nor claims to be - I think ‘adjustment factors’ is a fairer description.
Gridwatch records a set of GB power flows every 5 minutes. Hence to a close-enough approximation GB energy quantity (MWh) is obtained by multiplying each power flow (MW) by 5/60 (h). Add all the MWhs together and you get energy per day, per month, per year, etc.
With any power grid, supply must equal demand every minute of every day (i.e. 60/24/365) otherwise the power grid operator will have to take action to keep the grid balanced. That action can take the form of disconnecting demand in the area of a supply shortage (for example the GB power system disruption on 9 August 2019) or of curtailing generation in the area of over-supply. Either is expensive. Taken to an extreme, systemic shortfall generation results in the regime known as loadshedding in South Africa - routine even in the capital Johannesburg.
I put *capacity* of renewable sources within asterisks to remind readers that the measured actual ‘load factors’ of GB’s entire fleets of wind and solar PV through the last five years are small to moderate percentages of the nominal numbers, per DUKES 6.3
Maybe these guys are on to something: “Why Rust Is the Future of Very Cheap Batteries”
I took a look at the latest plans for Cleve Hill. They estimate the solar farm at 373MW peak, and the battery is 150MW output, 700MWh of storage (though these figures are less certain). They have taken out a CFD under Allocation Round 4 covering 110MW of the solar capacity at a price that indexes currently to £56.99/MWh. I had forgotten that the major substation they will link to also serves the London Array wind farm, so they will be in a position to bid for wind surpluses to fill the battery in winter when solar output is low.
I found a local rooftop solar installation with excellent detailed historical data recorded here:
https://www.sunnyportal.com/Templates/PublicPageOverview.aspx?page=9ae1951a-36a3-439b-8e09-06697d5d1452&plant=71b0b704-3255-4883-82cf-26fb78a5e0ca&splang=en-US
It's located outside Rochester, just a few miles away, and gives an excellent idea of the likely performance of the solar park. You can look at individual days to see how a weather front can dramatically change the output in the space of a few minutes. You can see how variable output is from one day to the next within a month, and look at the monthly seasonality and compare the annual performance back to 2015. These variations limit the extent to which the battery can be used profitably as a solar store.
The battery is designed to take less than half the maximum solar output as a charge rate. Indeed, it's only a little bit bigger than the capacity contracted to CFD. The way the CFD works, if there is a general solar surplus that pushes prices down on sunny summer days, is that consumers get to pay the subsidy for the MWh generated from the 110MW of CFD capacity, which can be used to charge the battery. So from the consumer point of view the cost of charging the battery in £56.99/MWh, but the battery gets its supply at somewhere close to zero cost. The battery then gets to sell the output in the evening when prices are rather higher, covering the losses in the round trip. Its interest is to discharge at the best prices it can, not to maintain any even flow. In winter solar output is low, and in fact not sufficient to charge the battery fully. However, it may still make sense to divert all the output to the battery (whose input capacity can easily handle the low input), and then discharge it at premium prices in the evening rush hour which will be enough to draw down the stored energy as much as is wise. The battery economics are quite complicated, especially if you include the potential for other sources and providing grid ancillary services in the mix. But the optimum economics are going to be some way away from the idea of creating an even flow of output.
If you forced solar to come with storage you wouldn't have much solar, especially if you demanded even flow across a day. If you wanted even flow across the year there would definitely be none, because interseasonal storage is prohibitively expensive. 4 hour duration storage (MWh holding capacity divided by MW of maximum output) has challenging economics: it's what they're putting in at the giant solar farm Cleve Hill near Faversham, where the storage might have a secondary role in supporting stabilisation of interconnector flows from BritNed and NEMO if they trip out.
It's much cheaper to curtail. Trouble is, curtailment tends only to apply to commercial ventures. There are difficulties with organising curtailment for domestic rooftop solar, including ensuring that it doesn't result in energy build-up that leads to house fires. You can see the effect on a typical summer day in South Australia (where excess solar drives grid prices negative)
https://i0.wp.com/wattsupwiththat.com/wp-content/uploads/2023/05/SA-Gen-5-Jan-23-1684966578.2893.png
Batteries don't really figure as a solution. The fact that rooftop solar doesn't see the negative prices is the start of the problem.