

Western Australia Reality
I look at the data for a sunny region in Australia with grand ideas about being a Solar superpower

If this post is too long for your email client, click the graphic at the top of the email to transfer to the Substack post. In any case some charts may not be fully legible: in Substack you should be able to zoom any chart by clicking on it.
Also, a note on energy units in this post: the openNEM data is in GWh and is recorded daily. Power flows in GW are *on average* the day’s energy in GWh / 24h. For convenience, where I refer to ‘power’ I’m likely to mean ‘the day’s energy in GWh averaged out across 24h’.
Summary
On LinkedIn recently we were told that “Rooftop solar will soon eliminate grid demand in Western Australia”. I guess it depends on your definition of “soon”, but really?
So I downloaded the last ~year’s worth of data for Western Australia (WA) from the Australian National Electricity Market (openNEM) website and picked through the actual numbers.
The total Demand for WA over that interval was 21,800 GWh, of which
19% was supplied by [total Solar] = [rooftop + utility] Solar and 16½% was supplied by Wind (plus ¼% was supplied by discharging batteries).
The rest was mostly supplied by Black Coal (30%) and Gas (nearly 34%), so that claim that grid demand in WA would soon be eliminated by rooftop Solar seems farfetched.
Assuming future power Demand across WA is 1.10 times current values and simply extrapolating from recorded to future quantities of [total] Solar and Wind, I find the lights could be kept on continuously in Western Australia with:
[total Solar] multiplier = Wind multiplier = 3.4: LDES Capacity 2,000 GWh = 2,000,000 MWh = ~ 600 times California’s biggest battery to date (Cbbtd *);
plus 19 GWh of dispatchable (fossil) power; or[total] Solar multiplier = Wind multiplier = 3.7: LDES Capacity 1,400 GWh = 1,400,000 MWh = ~ 400 times Cbbtd;
plus 12 GWh of dispatchable (fossil) power; or[total] Solar multiplier = Wind multiplier = 4.6: LDES Capacity 200 GWh = 200,000 MWh = ~ 60 times Cbbtd;
plus 13 GWh of dispatchable (fossil) power; or[total] Solar multiplier = Wind multiplier = 6.2: LDES Capacity 70 GWh =
70,000 MWh = ~ 20 times Cbbtd;
plus 10 GWh of dispatchable (fossil) power
I conclude, Western Australia, that you are a very long way from eliminating grid demand with your Solar, rooftop or otherwise.
*Note: my use of California’s biggest battery to date (Cbbtd) is for convenience / brevity. In the body of the post I give some alternative size comparators.
Introduction
On LinkedIn recently we were told that “Rooftop solar will soon eliminate grid demand in Western Australia” - see Figure 1. With the rather different message in the subtext: “AEMO now expects midday operational demand to fall below zero as early as 2026-27, …” I’m no expert on power systems, but isn’t “eliminate grid demand” a very different thing from “midday operational demand to fall below zero”?
Figure 1: WA According to the Headline:
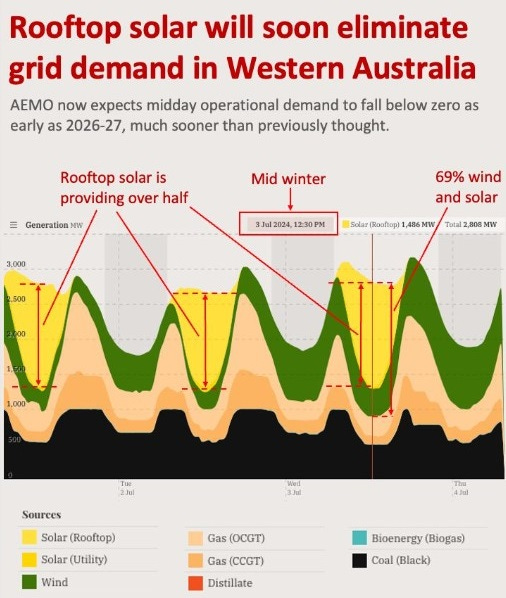
The original post also informed us that “WA is unique because it has no interconnection to other states or grids.” That makes sense, because WA is at the western extreme of the continent of Australia.
Rather than swallow the headline messages uncritically, for this post I downloaded the last year’s worth of data for Western Australia from the Australian openNEM website. The data resolution is poor: daily intervals is the best currently available1. Also, I didn’t find a way to change the dates of the 1-year display / data download, so only the last 370 days of complete data (from 04/07/2023 through 07/07/2024) feature here2
Note dd/mm/yyyy date format is used throughout this post.
Figure 2: Western Australia Power Data to 04 July 2024:
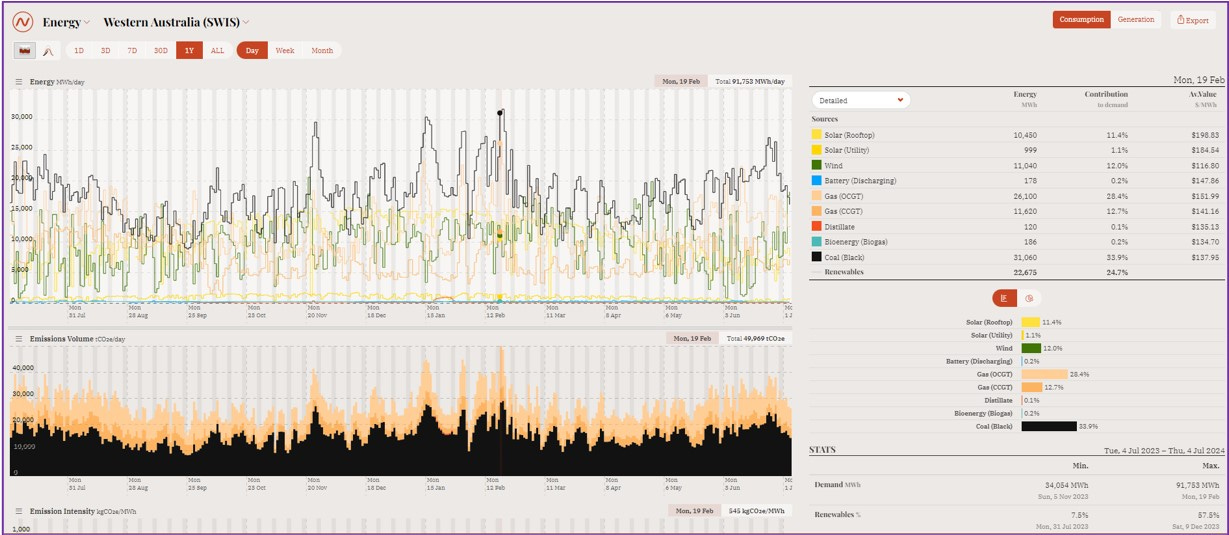
Of course, when you present data recorded only once per day, as in Figure 2, you mostly obscure the fact that, even in a sunny region such as WA, Solar power falls to zero every night. Despite this sleight of hand: you can see in the upper chart there are several instances along the ~12 months where WA Solar (combined rooftop + utility) fell to very low values.
Another feature of the NEM presentation is that Demand is merely implied (because it is inherently equal to the sum of all sources of generation each and every day to ensure the WA grid remains balanced): in Figure 2 only the various sources of WA electricity supply are plotted.
I think it is much clearer to illustrate the scale of the difficulty of ‘decarbonisation’ of a grid to have the Demand explicitly plotted against the generation sources you hope will replace dirty dirty fossils. So for each day’s data I added up all the generated GWh to derive that day’s Demand. I also added together the utility and rooftop Solar to derive a single [total Solar] value for each day. These parameters, plus the recorded Wind GWh/d, are plotted in Figure 3.
Figure 3: Western Australia Actual Demand, Wind & [total Solar]:
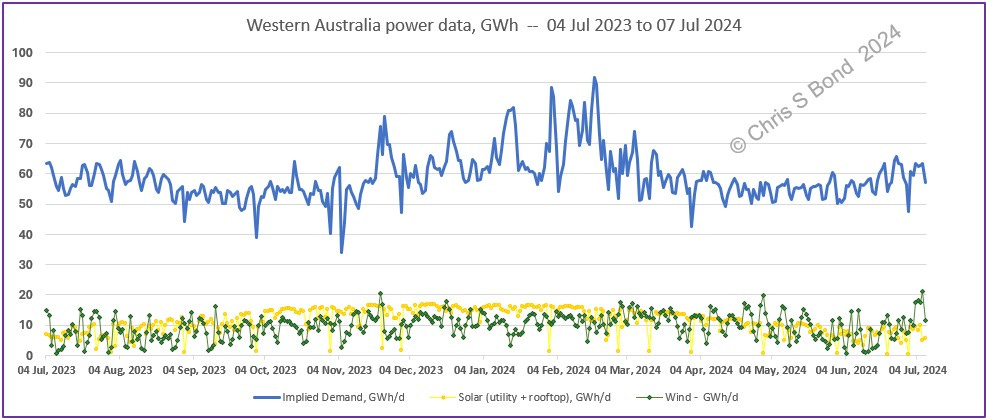
Figure 3 clearly shows:
- the large gap between Demand and ‘renewable’ generation sources of WA power;
- the numerous instances where [total Solar] was much lower than usual;
- the distinctly random variation of Wind power across WA
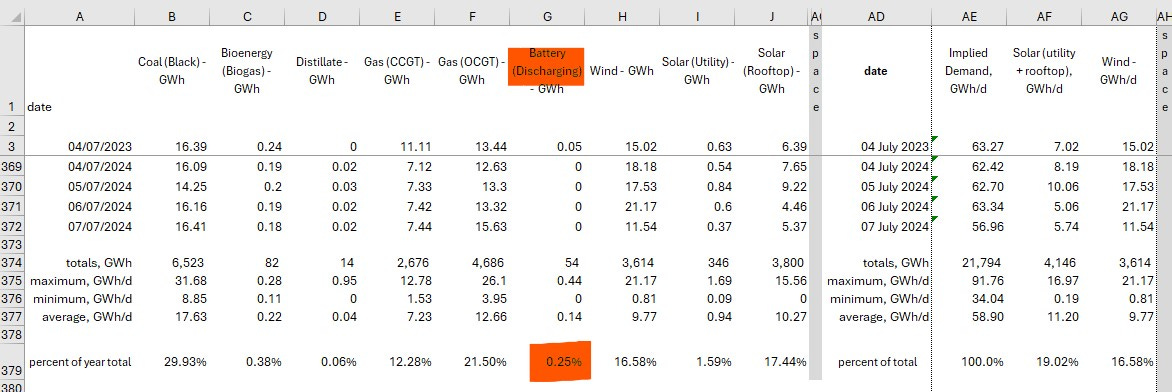
Simply by summing the columns of data i.e. the totals for the ~year, we can establish the relative contributions of the various sources of WA power, see Table 1.
Table 1: Relative Contributions of the Various Sources of WA Power:
The overall energy balance across that ~year indicates just how much more Wind plus Solar is necessary on average as shown in Tables 2:
Tables 2: Multiples of Wind + Solar to ≥ Satisfy WA Future Demand:


Note that over this recent interval, [total Solar] contributed 19.0% and Wind 16.6% to satisfying Demand on average. In other words, they contributed roughly equally to the annual total. Just why do people appear to be all-in for Solar alone? Wind has the major advantage that there is at least a chance that it will keep blowing and contributing throughout the night, unlike Solar. For this reason I use the same multiplier for both forms of ‘clean’ generation in future WA.
Looking at the Tables 2 results in sequence:
Just to satisfy WA’s existing Demand on average over that ~1 year there would have needed to be 2.809 times Solar (utility + rooftop) + 2.809 times Wind
Allowing WA Demand to increase by factor 1.100 while everything is electrified3, [total Solar] and Wind would each have to be increased by multiplier 3.089 to just achieve energy balance across the interval
With Demand factor 1.100, to achieve 20% surplus across the interval requires [total Solar] and Wind multipliers = 3.707
With Demand factor 1.100, to achieve 50% surplus across the interval requires [total Solar] and Wind multipliers = 4.634… note the maximum GWh/d from [total Solar] is 78.6 GWh, and for Wind is 98.1 GWh, compared with maximum current Demand of 91.8 GWh/d.
With Demand factor 1.100, to achieve 100% surplus across the interval requires [total Solar] and Wind multipliers = 6.179... note again the maximum [total Solar] ~105 GWh/d and Wind ~130 GWh/d power flows that may need to be transmitted within WA for this scenario to be achievable.
For some detail of what scenarios 3-5 represent, see Figures 4.
Figures 4: Future WA Scenarios with 1.1 x Current Demand:


Leaving aside for the moment whether WA grid capacity would be sufficient to cope (it wouldn’t), how likely would that be to keep the lights on day by day? For that we need to look at the daily power balances, answering for each 24h interval:
- Would that day’s Demand be at least satisfied by future {[total Solar] + Wind}?
- If yes, we’ll assume that potential surplus is curtailed / constrained.
- If no, there would have to be a reliable controllable source of power to make up the shortfall… or else people or businesses in WA would have to reduce their Demand and / or their lights would go out. See Figures 5 for the summary results.
Figures 5: Future WA, [Potential] Surplus / Shortfalls:


Currently the vast majority of that [potential] surplus generation would have to be curtailed because we know from Table 1 that batteries currently can only cope with around 0.25% of annual Demand. So currently all the grey plots represent different degrees of wasted capital expenditure, while the red plots show when either fossils would have to step in or the lights would go out. (Remember also that, with only daily data resolution, there may be other intervals of hours of shortfall within some days which cannot be revealed in this analysis.)
Of course, to avoid wasting all that capital expenditure, WA may want to capture some or all of that surplus generation in energy storage (or even ‘green’ hydrogen production), so that benefit could be gained from it in times of Shortfall. Step forward long duration energy storage (LDES) of whatever form you like (if you can find a form that works at sufficient scale and doesn’t currently bankrupt you or the Earth).
My methodology as plotted in Figures 6 only credits LDES with power to ‘charge up’ when there is surplus ‘green’ power. This logic is summarised in Table 3:
Table 3: ‘Green’ LDES Logic:
1 IF there is surplus [future Wind + future Solar]
2 AND there is unused energy storage capacity in future LDES
3 THEN that future LDES can be scheduled to receive and store ‘green’ energy (thereby reducing the amount of energy that has to be curtailed)
4 UNTIL (at maximum) the future LDES becomes ‘full’
SO
5 WHEN there is a shortfall of [future Wind + future Solar]
6 AND there is ‘charged-up’ future ‘green’ LDES
7 THEN we could get back up to 70% [1] of the energy stored in the LDES (thereby
reducing the shortfall of energy) by scheduling the LDES as additional generation
8 UNTIL (at minimum) the LDES becomes ‘empty’ [2]
[1] based on assumed average round-trip efficiency (RTE) of a mixture of battery storage and other technologies yet to be invented;
[2] The operating range of LDES needs to remain within constraints on e.g. depth of discharge (DOD) which will probably depend on its technology. I’ll work with net storage capacity and assume we remain within such constraints, whatever the technology mix.
I assume no limits on charge / discharge cycles or other aspects of LDES operation: if there is capacity to be charged, or stored ‘green’ energy to be discharged, then my analysis uses it.
Of course, no power grid can separate ‘green’ from other colour electrons. Table 3 logic defines the energy accounting / grid operator capacity dispatching controls necessary to ensure ‘green’ power remains clear ‘green’. The economic incentives to muddy the greenness will be immense. I submit that the same logic would have to be applied to the supply of power to a ‘green’ hydrogen electrolysis facility, otherwise the hydrogen produced would less than ‘clean green’.
Figures 6: WA with LDES for each Scenario from Figures 5:


Summarising Figures 6 results, which all assume future power Demand across WA is 1.10 times current power:
For average 10% surplus {total Solar + Wind}:
[total Solar] multiplier = 3.398; Wind multiplier = 3.398
LDES Capacity GWh: 2,000 [2,000,000 MWh]
Initial LDES GWh assumed to = this year-end LDES GWh: 1,108
total Shortfall with LDES, GWh -19;
reduction in Shortfall due to operation of LDES, GWh: 2,072 = reduction in fossil-generated power
total Curtailed when LDES is Full, GWh: 1,528
reduction in Curtailment due to operation of LDES, GWh: 2,960
For context, 2,000,000 MWh =
~ 600 times California’s biggest battery to date; or
~ 67 million EVs with half their 60 kWh capacity dedicated to support of the WA grid;
or over 200 times the Dinorwyg pumped hydro facility in Wales2, UK; or
~ 8,000 of the 250 MWh liquid air energy storage (LAES) facilities being trialled…
or any combination / permutation of those and other LDES technologies yet to be commercialised… but note that for a substantial part of the year the LDES would remain full and hence hardly earning any revenue…
For average 20% surplus {total Solar + Wind}:
[total] Solar multiplier = 3.707; Wind multiplier = 3.707
LDES Capacity GWh: 1,400 [1,400,000 MWh]
Initial LDES GWh assumed to = this year-end LDES GWh: 786
total Shortfall with LDES, GWh -12;
reduction in Shortfall due to operation of LDES, GWh: 1,154 = reduction in fossil-generated power
total Curtailed when LDES is Full, GWh: 4,145
reduction in Curtailment due to operation of LDES, GWh: 2,206For average 50% surplus {total Solar + Wind}:
[total] Solar multiplier = 4.634; Wind multiplier = 4.634
LDES Capacity GWh: 200 [200,000 MWh]
Initial LDES GWh assumed to = this year-end LDES GWh: 200
total Shortfall with LDES, GWh -13;
reduction in Shortfall due to operation of LDES, GWh: 701 = reduction in fossil-generated power
total Curtailed when LDES is Full, GWh: 11,700
reduction in Curtailment due to operation of LDES, GWh: 1,001For average 100% surplus {total Solar + Wind}:
[total] Solar multiplier = 6.179; Wind multiplier = 6.179
LDES Capacity GWh: 70 [70,000 MWh]
Initial LDES GWh assumed to = this year-end LDES GWh: 70
total Shortfall with LDES, GWh -10;
reduction in Shortfall due to operation of LDES, GWh: 261 = reduction in fossil-generated power
total Curtailed when LDES is Full, GWh: 23,870
reduction in Curtailment due to operation of LDES, GWh: 373
Note that the problem of the LDES remaining full and hence earning little revenue gets worse with each option.
Conclusion
Western Australia, you are a very long way from eliminating grid demand with your Solar, rooftop or otherwise.
Postscript
I have just seen this simulation on a 100% wind, solar, and battery (plus some hydrogen production) system for SWIS, Western Australia post on LinkedIn. The author, Bengt J. Olsson, says it is in accordance with the "expected" scenario (WEM/ESOO) for WA in approximately 10 years from now. Which should be reasonably comparable with my analysis, I think.
Compare and contrast, as they used to say in school.
Copyright © 2024 Chris S Bond
Disclaimer: Opinions expressed are solely my own.
This material is not peer-reviewed.
I am against #GroupThink.
Your feedback via polite factual comments / reasoned arguments welcome.
The website has a note: “Western Australia (SWIS) is currently in transition to the SCED market and 5-minute intervals. OpenNEM is working to support the new network and it will be live in the near future.”
I re-downloaded a couple of times after initially doing so to gather data for a few more days, after seeing how the data was shaping up. It doesn’t change the conclusions significantly.
It looks like maximum Demand is driven by summer heat i.e. air conditioning which is already powered by electricity. However, I’ll assume Aussies - at least in WA cities - will be mandated to abandon their utes for EVs, thereby adding to electricity Demand while reducing gasoline & diesel fuel use for mobility.
Useful analysis - this is genuinely a live discussion here in WA, with an enormous media, government & general "elite opinion" push to have everyone believe exactly the sort of nonsense you pull apart here. There is a very large take-up of rooftop solar in Perth because of the huge subsidies and the instinctive WA feel that "it's sunny here a lot", so it must be right. Simple, obvious, wrong. The same "feeling" has supported a solar hot water business that's always been problematic, particularly on whole of life costs. And the relatively short life of these systems will start to come home to roost in the next 5-10 years, before all the network problems are solved but after a lot of money has been spent.
Nice, would be interesting to compare to South Australia which is much further along the RE path (around 70% IIRC).