

California Dreaming
Never mind the hype, ignore the laws that have been passed, just look at reality as revealed by the data

Summary
California - the Golden State - has ‘ambitious’ plans to achieve net zero carbon by 2045. How likely is it that this can be achieved across just the power sector in the next 22 years?
To develop a view, I manually ‘stitched together’ two collections of data from 14 days in September 2022 (when there were multiple “Demand response event[s]”) and from the first half of February 2023. Together these reveal puzzles to which (if I were a resident in CA) I would want to know the answers.
I then apply the methodology I have applied to understand GB power production to California. I used real CAISO data and extrapolated non-fossil sources of power according to the ‘ambitious’ plan (and beyond) to see if the fossil power can thereby be displaced. It cannot.
Therefore, I think the answer to my question is: not very likely at all.
Introduction
On November 16, 2022 the Governor of California released the “World’s First Plan to Achieve Net Zero Carbon Pollution” by 2045. This is fleshed out in the California Air Resources Board’s 2022 SCOPING PLAN FOR ACHIEVING CARBON NEUTRALITY - all 297 pages of it. In it, Bills/Executive Orders establishing targets abound: apparently, just pass a law and reality is changed. Lots of reliance on hydrogen (mainly ‘blue’ and ‘green’)1 And so on, and on, with little reference to real measured data.
I’m writing about California’s power system because a few weeks ago I was directed to the website of CAISO2 to see for myself how close (according to my commenter) the state already is in its endeavours to eliminate fossil fuels from its power generation system. Specifically, I was directed here to marvel at all the renewables.
The link opens on the dashboard of Supply and renewables AS OF [time].
Figure 1 shows the screengrab from March 16 because it displays significant amounts of renewable power… unlike the situation most nights, but more on that later.
Figure 1 - the CAISO dashboard of 08:15 on March 16, 2023
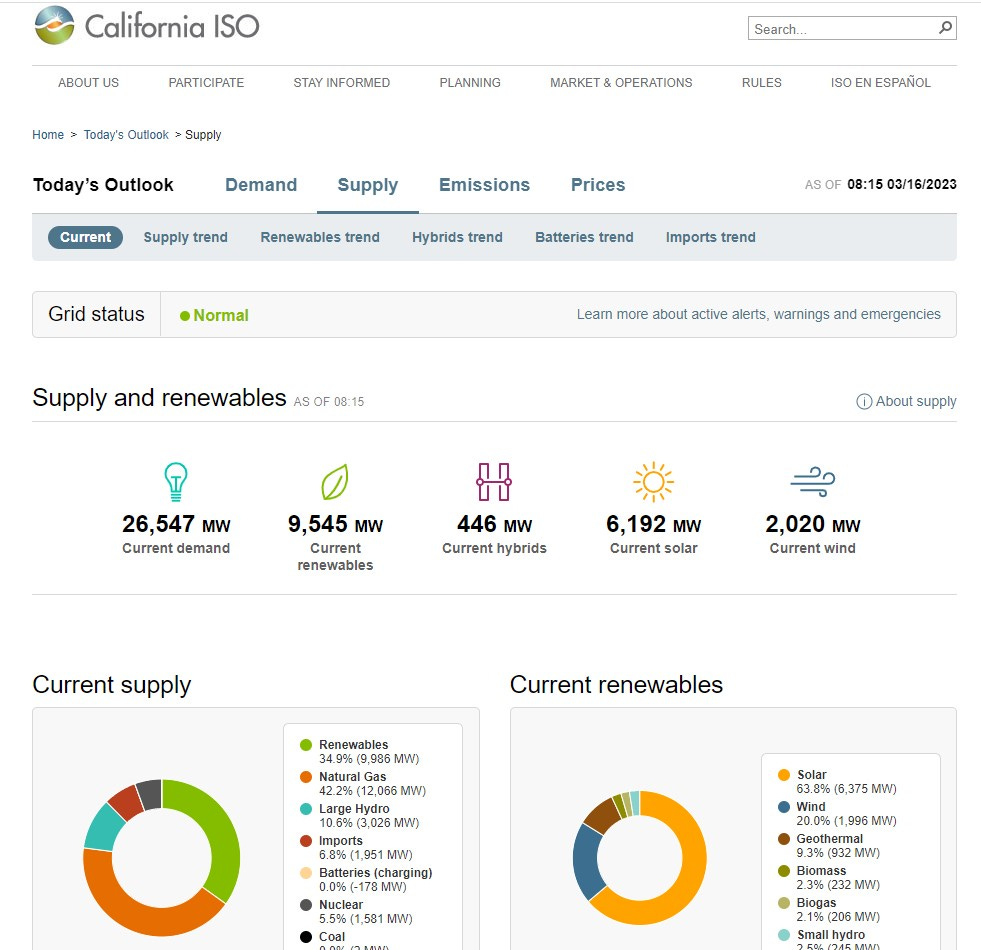
Note how the visual emphasis is almost equally on ‘Current renewables’ despite them being (in this instance) barely one third of total supply. Maybe this is what fooled my commenter. I went digging for more data, and found it scattered hither and yon.
The California ISO presents data one day at a time, and in a fragmented format. Each day’s data is recorded at 5-minute intervals and can be downloaded in comma-separated variable (.csv) format suitable to load into Excel - great! Except, not so great: Demand data is separate from Supply data, and the separate Renewables trend data is needed to get separate values for Wind and Solar PV. Therefore, to even begin to get a full picture for one day, you need to download 3 separate .csv files. This is insufficient to develop an informed view - I think you need to see the patterns over multiple days to begin to understand how the system is working.
I originally intended to chart a couple of complete months of data. But just 14 days of one month requires download and compilation of 42 files. To look at data from two different months, I had to go through the whole process twice. So I settled for two 14-day periods of data. (Incidentally California ISO, the way you present your data sucks, big time!)
The other problem I encountered was finding the worst-case or extreme set of data. To be able to solve a problem, don’t you need to know how big it is? I chanced upon the early September 2022 daily charts showing red “Demand response event” indicators when demand was unusually high. Hence I selected the first two weeks in September 2022 as an example of extreme demand circumstances with which a fossil-free CA grid will have to contend. By contrast, data from the first half of February 2023 (when I started this analysis) shows low-stress system operation.
Together these sets of data and plots reveal that California is a long way from operating a fossil-free power grid.
Major Parameters
The most-variable largest Suppliers keeping the lights on in California, are:
Solar PV; Wind; Natural Gas; and Imports.
Any grid will only remain stable if supply = demand every minute of the day, hence it is critical to understand Demand also.
(Out of interest I summed the Supplies in each interval to compare with that interval’s Demand. Curiously, the Sum of Supplies did not = Demand in any interval in either of the two-week periods. Huh?)
Chart A - 01-14 Sep ‘22 main variables - including “Demand response event” days
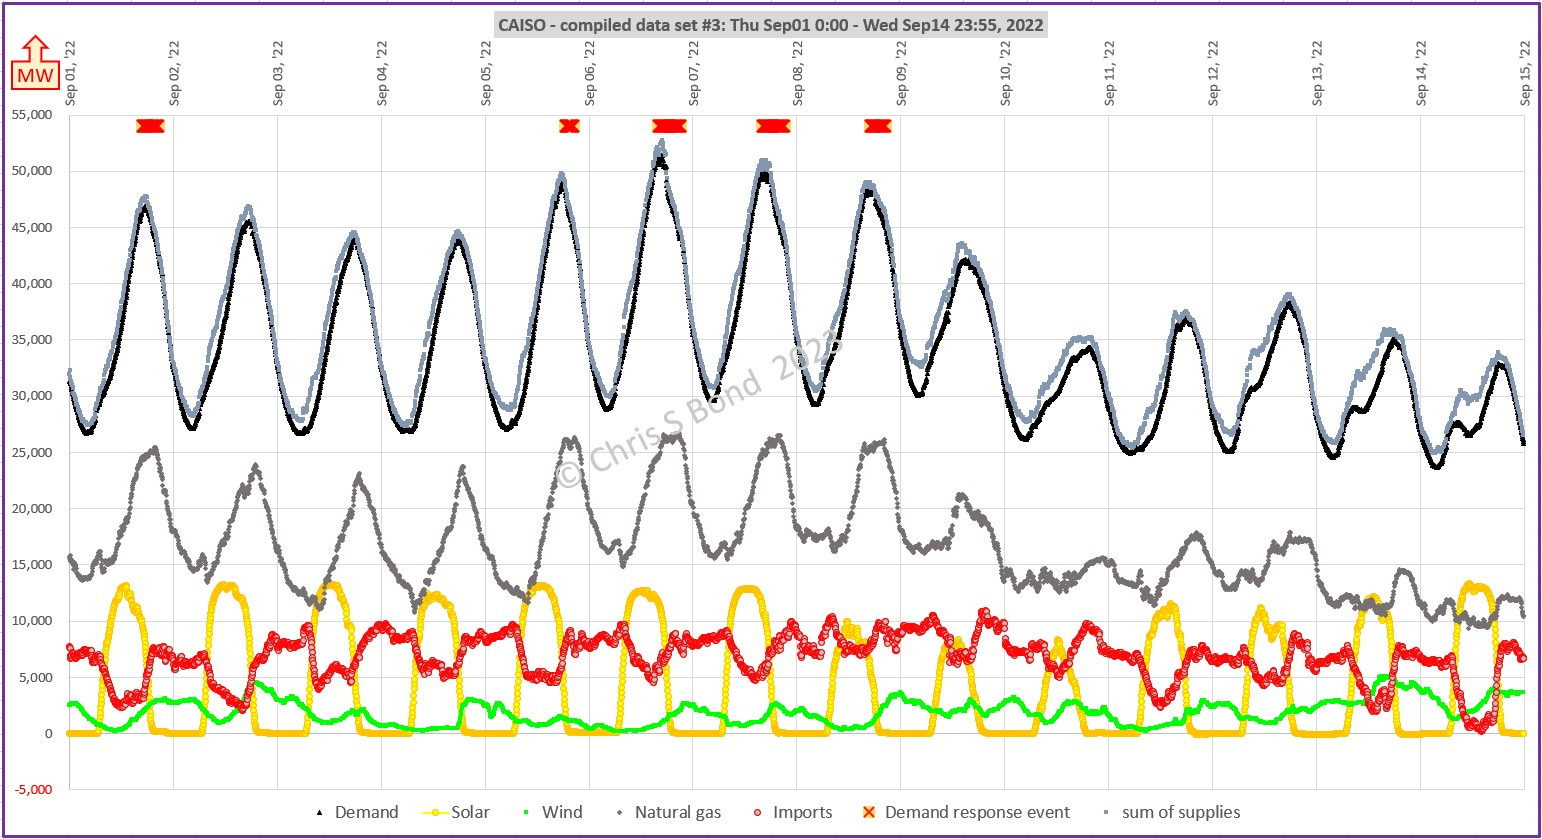
Demand peaked at 51,426 MW3 at 4:55pm on Sep06. At that time solar PV was 10,250 MW and falling. By 6:45pm solar PV had fallen below 1,000 MW while demand remained at over 47,000 MW. That pattern was repeated each of the “Demand response event” days, see Chart A1 below.
Gas peaked at around 26,000 MW on each of Sep05, Sep06, Sep07 and Sep08, and barely fell below 10,000 MW the entire period.
Solar PV varied every day between a minimum of -54 MW and maximum 13,349 MW on 14Sep'22 at 11:15. (On the two least sunny days, Solar PV maxed out at around 8,300 MW on 09Sep'22 at 13:15 and 8,400 MW on 10Sep'22 at 12:15.)
Imports were mainly between 5,000 and 10,000 MW across the period
Wind varied fairly randomly between 155 MW minimum and 5,113 MW maximum.
Weekends (Sep 03-04, Sep 10-11) are barely distinguishable from weekdays.
CA’s lights were kept on by burning a LOT of gas plus being a parasite on its neighbouring states.
Sum of supplies closely tracked Demand until Sep10, when the two plots diverged a little. The delta between the two was never zero.
Chart A1 - 05-08 Sep ‘22 - four “Demand response event” days
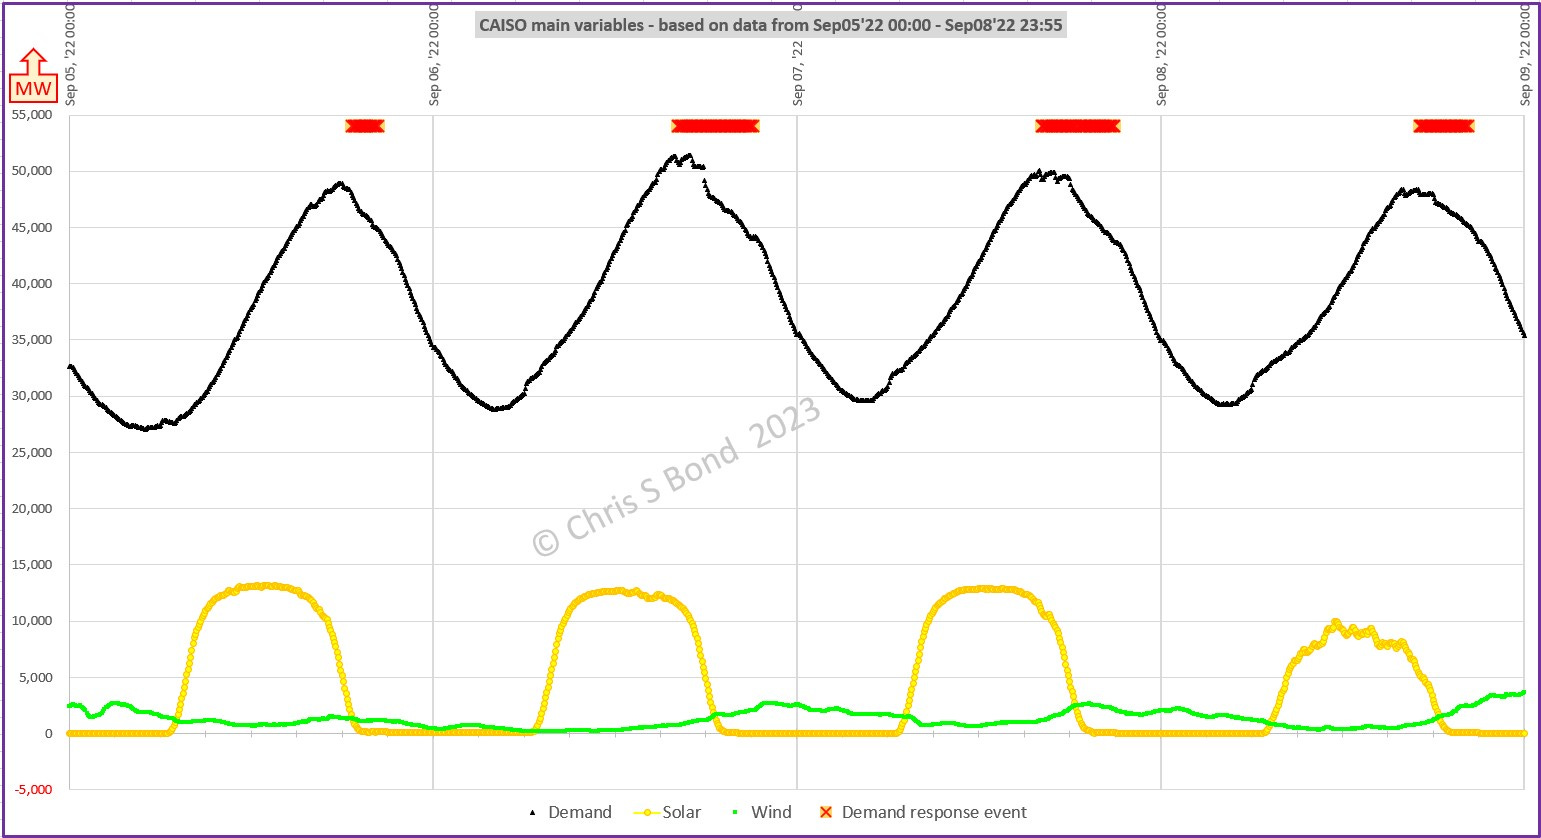
Peak availability of Solar PV comes before peak Demand each day, while Demand remains high (~30,000 MW plus) every night. Wind hardly contributes.
Compare and contrast Chart A with Chart B for the far less challenging two weeks at the start of February 2023.
Chart B - 01-14 Feb ‘23 main variables
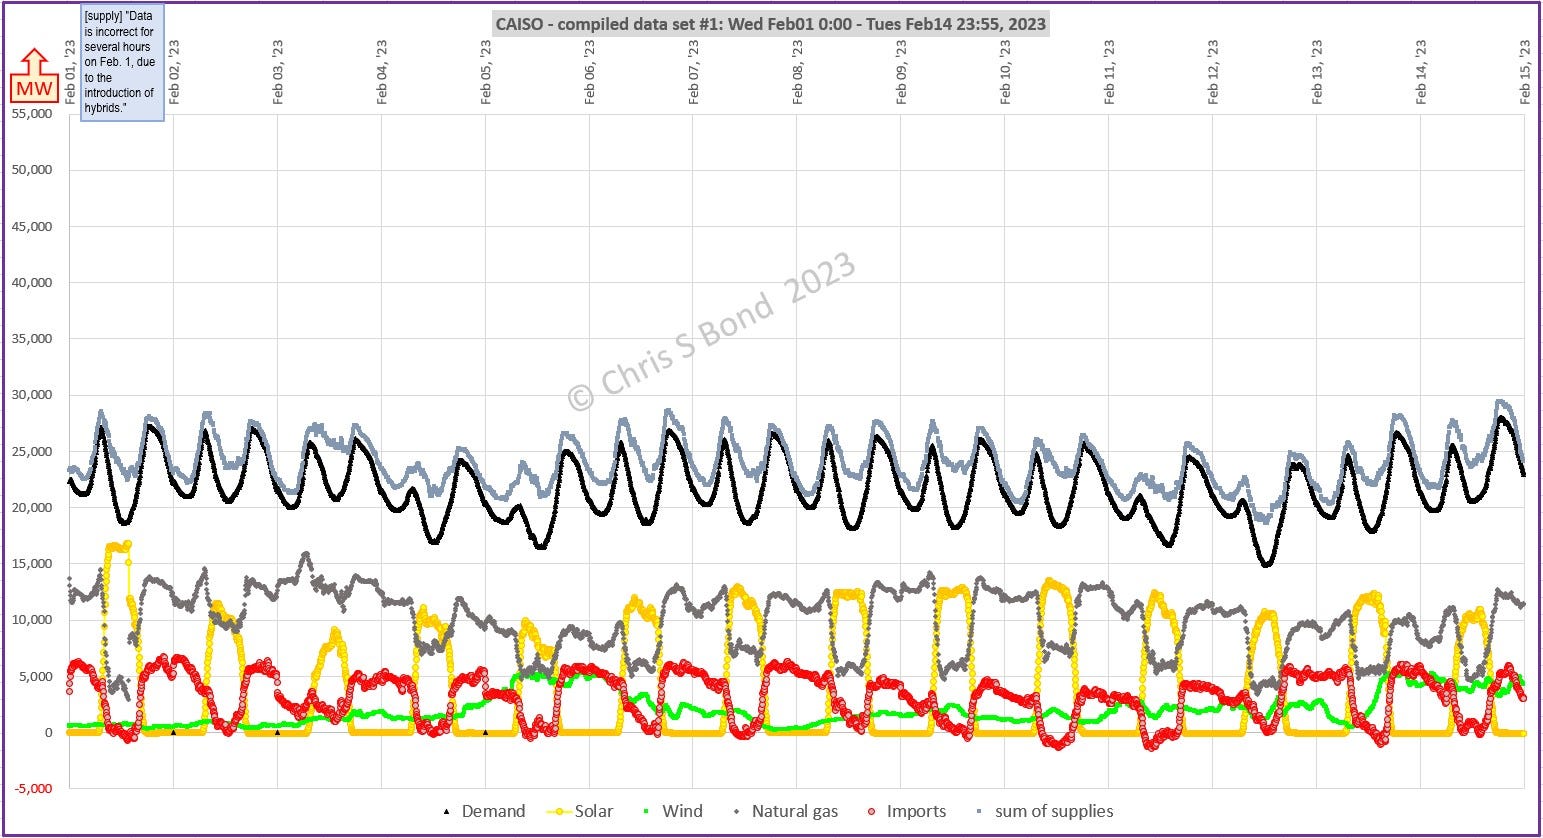
The vertical axis is deliberately kept the same in Charts A and B to allow clearer comparison. As indicated on Chart B, the CAISO Supply download page noted “Data is incorrect for several hours on Feb. 1, due to the introduction of hybrids4.”
Feb 04-05 and Feb11-12 were weekends, which show significant differences in the demand plot.
Even at times of low Demand, when the sun is not shining, Gas and Imports keep CA running. When the sun *is* shining, CA backs out those ‘imports’ to the extent that sometimes CA exports electrical power.
Wind (the green line) across this timescale does what wind does: varies randomly between 227MW to 5,405MW.
The plots of Sum of supplies (upper grey plot) and Demand (upper black plot) are distinctly separate, sometimes widely so. Where does the difference = ‘missing energy’ go?
Other observations
Batteries’ charge / discharge cycles span more than 4 hours every day. Received wisdom says the limit for Li ion batteries is 4 hours. Are these not Li-ion?
Nuclear is low-carbon and near-constant, yet CA ideology does not recognise its value when attempting to reduce carbon intensity of power generation. In this analysis I take the opposite view and count Nuclear as fossil-free.
Geothermal + Biomass + Biogas + Small hydro together are near-constant and are [assumed to be] low-carbon. Coal and Other are minimal / zero.
01-14Sep ‘22, batteries supplied a cumulative total of nearly 39,000 MWh. They apparently created energy, which is Impossible. Therefore the battery data in that timespan are highly suspect.
10-14Feb’23, batteries consumed a cumulative total of nearly 13,000 MWh, which is at least qualitatively what one would expect.
Imports
From the California Government Energy website, the mix of fuel used to generate power imports is as shown in Figure 2:
Figure 2 - fossil content of CA imported power
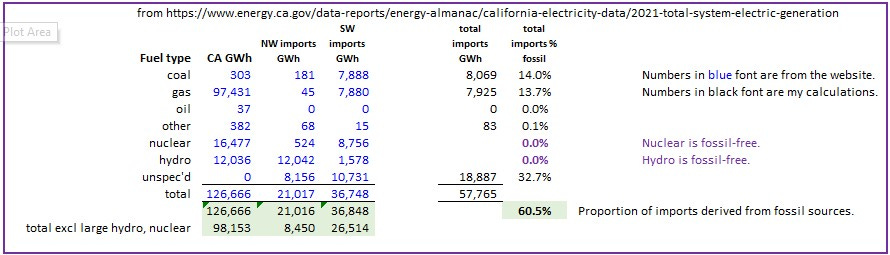
Therefore, to eliminate fossil energy sources from imports, CA must substitute non-fossil sources equal to 60% of imports. Hence in my analysis I disallow 60% of Imports to account for CA’s intention to fully eliminate fossil power sources.
Methodology
To achieve ‘decarbonisation’ of a power grid, all fossil sources of power need to be replaced by non-fossil sources. Supply must = demand 60/24/365 otherwise the lights go out. That is the essence of the problem which we must address honestly and openly.
Therefore, for each set of actual data I evaluated:
Demand - [power from non-fossil sources] = [power from fossil generation]
Then I multiplied each non-fossil source by a factor corresponding to the ‘ambitious plan’ to see if fossil power is displaced under that plan scenario.
For added reality I allowed for Demand to increase (because increased electrification is being strongly incentivised), making the ‘decarbonisation’ target even tougher, natch. The base case is shown in Chart C.
Chart C - 01-14 Sep ‘22 - the fossil sources to be displaced
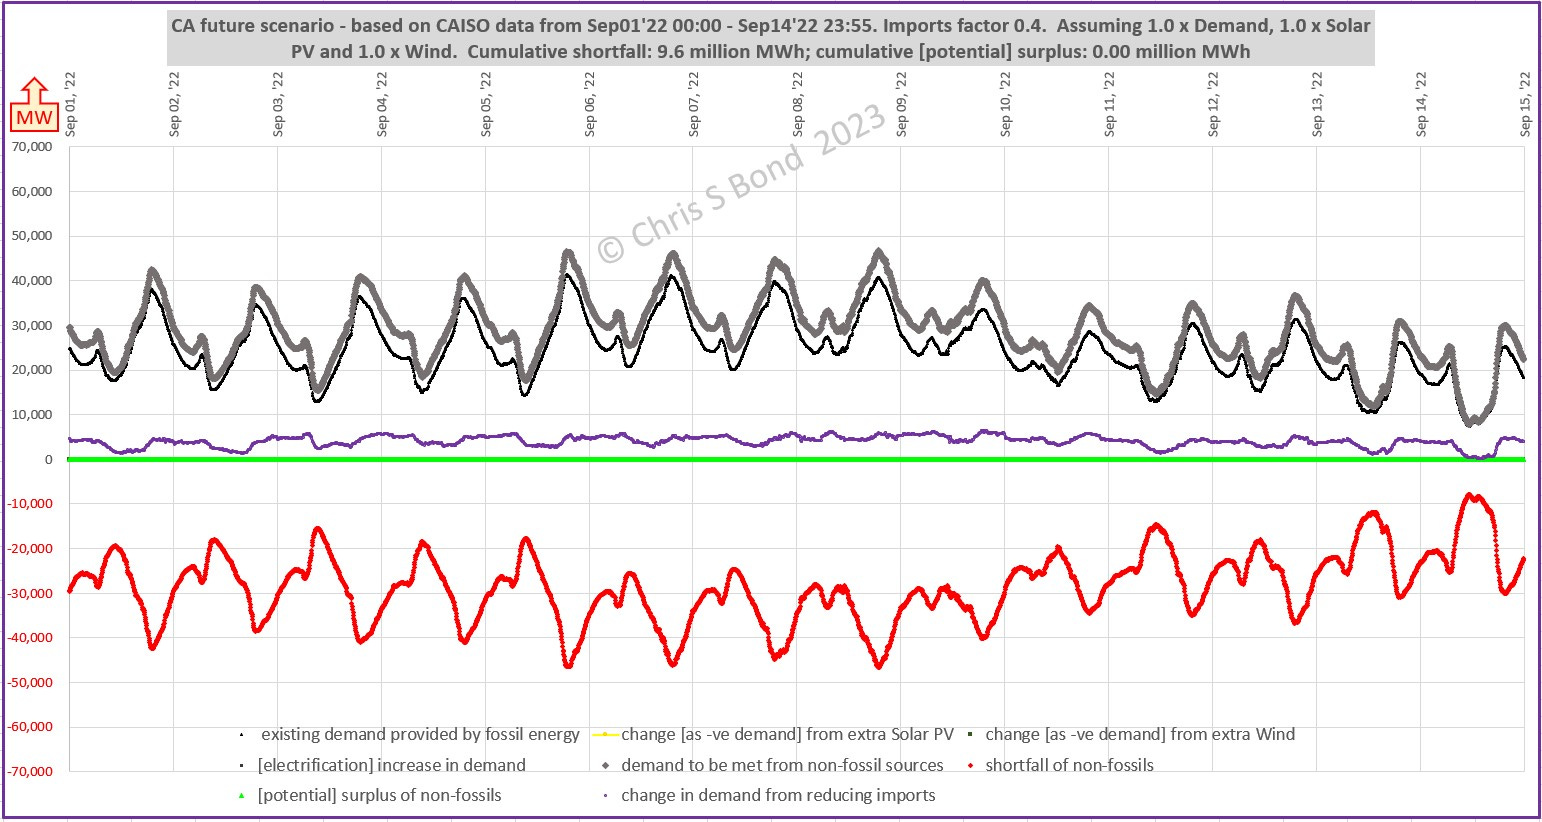
The purple plot shows the disallowed fossil component of imported energy. The red plot shows the shortfall of non-fossil energy, accumulating to 9.6 million MWh across this 14-day period.
The ‘Ambitious’ Future Scenario
The ‘ambitious plan’ includes (p9): “The scale of transition includes adding four times the solar and wind capacity by 2045…” on the non-fossil supply side, as well as “… about 1,700 times the amount of current hydrogen supply.” Leaving aside the hydrogen for the moment, and just looking at the scenario with 4 times Solar PV and 4 times Wind [4 times (Solar PV + Wind) would be less, but is that what the plan means?] Chart D shows the result.
Chart D - 01-14 Sep ‘22 - 4 times Solar PV + 4 times Wind
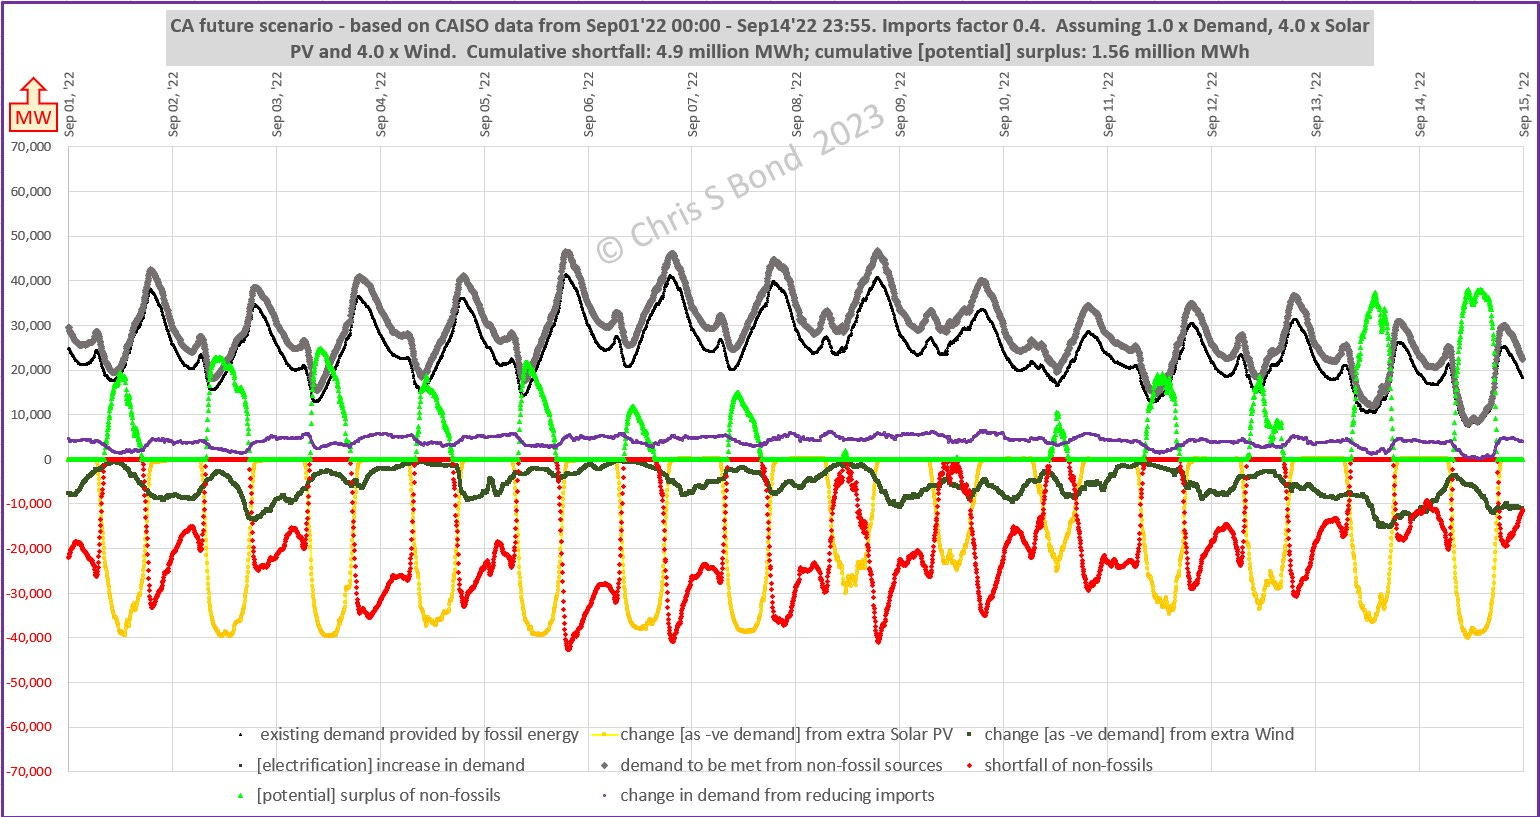
The red plot shows the shortfall on non-fossil energy, accumulating to 4.9 million MWh across this 14-day period, while the green plot shows the potential surplus fossil-free energy. This can only be captured and used if there is sufficiently flexible[*1] reliable[*2] additional demand to absorb it.
*1 Flexible - look at the green plot for Sep14 - zero to maximum about 38,000 MW in ~3 hours then back to zero again in ~3 hours later in the day.
*2 Reliable - because unless the grid operator can rely on that additional demand the surplus would have to be constrained to avoid unbalancing the grid.
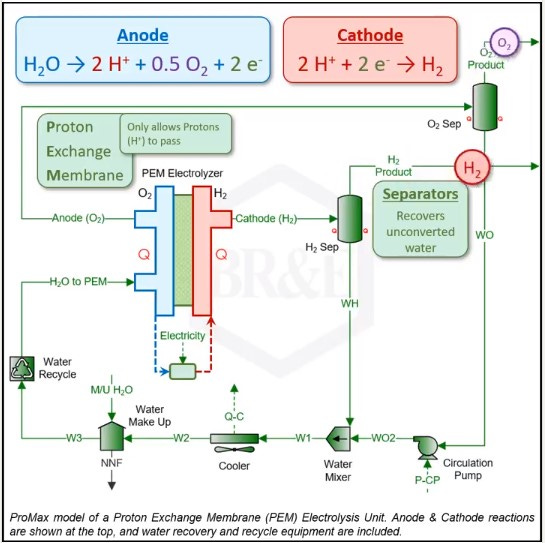
Could multiple trains of the electrolyser example shown in Figure 3 satisfy those requirements? Honest question.
Figure 3 - an example electrolyser system
And anyway, a plan that heavily relies on hydrogen without accounting for all the problems caused or made worse by using hydrogen? Paul Martin’s post of March 16 2023 “HYDROGEN TO REPLACE NATURAL GAS – BY THE NUMBERS” should be your essential reading before you allow your ideology to be your only guide.
Battery or Pumped Storage
Batteries can react very rapidly to act as flexible, reliable, additional demand. But look at the magnitude of the numbers involved here. In the scenario with Demand as-is and 4 x Solar PV and 4 x Wind, the total surplus energy to be stored between 14Sep'22 7:55 and 14Sep'22 18:00 (10 hours in the peak surplus period) is 310,231 MWh at peak rates of 38,117 MW. Tesla claims 10GWh+ of deployed Commercial Energy storage Worldwide. Just CA needs around 30 times that to avoid constraining it.
In any case, are batteries the best most cost-effective answer?
An alternative is pumped storage, which is tried and tested technology at grid-scale, but takes up a lot of land area and has geographical requirements (large bodies of water at very different elevations but physically close to each other). Round-trip efficiency of major pumped storage is around 75%. The same machines are used to pump the water up the hill as are used to generate the power when water is flowing down, so their MW power capacity is the same in either direction.
For example, Coire Glas in the Scottish Highlands is the UK’s newest proposed pumped energy storage scheme with a price-tag of £1.5bn (USD 1.84 billion as of Mar 22, 2023). Its power capacity would be 1.5GW i.e. 1,500 MW and its storage capacity would be 30GWh (30,000 MWh). Its developer SSE says “it hopes to make a final investment decision next year. If it goes ahead, completion is expected in 2031.” (Projects like this are rarely delivered on time or on budget.)
To avoid constraining the surplus renewable power in the ‘ambitious plan’ future scenario, therefore, California would need multiple Coire Glas-size projects:
In terms of power capacity: 38,117 MW / 1,500 MW = 25 times;
In terms of energy storage capacity: 310,231 MWh / 30,000 MWh = 10 times.
Or consider Nant de Drance in Switzerland. Capacity 900 MW, storage 20 million kWh (20,000 MWh); construction took 14 years; investment more than CHF 2 billion (USD 2.16 billion). California would need 42 times that for power capacity; 16 times for energy storage capacity.
Or, we’re back to storing the surplus energy chemically… by making ‘green’ hydrogen…
Conclusion: California *is still* dreaming
Disclaimer: Opinions expressed are solely my own.
This material is not peer-reviewed.
This is why I’ve stopped believing it would do any good anyway.
I am also against #GroupThink.
I welcome your feedback via polite factual comments / reasoned arguments.
Despite a lot of hydrogen being key to the scoping plan, and hydrogen itself having high global warming potential, hydrogen itself is not included in the ‘Emissions Data That Inform the Scoping Plan’ section. Making it an uninformed scoping plan.
CAISO, the California Independent System Operator, “maintains reliability on one of the largest and most modern power grids in the world, and operates a transparent, accessible wholesale energy market.”
CAISO’s “2022 Summer Loads and Resources Assessment” report in Table 7 ‘2022 Peak Demand Forecast Compared to 2021’ suggests the 1-in-10 demand to be 51,469 MW, which was (near as dammit) the actual demand on Sep06 2022. Climate change already? Or failure to keep up with increased electrical demand which is heavily incentivised at State and Federal levels? The resources assessment is mute on this point.
“Hybrids
A hybrid is a mixed-fuel resource with one resource ID at a single point of interconnection. The megawatts from hybrid solar, wind and battery components are included in their respective fuel types in the Renewables and Supply trend charts.”
That’s the CAISO website ‘information’ for ‘hybrids’. I’m none the wiser after reading it.
Well, you've certainly popped that balloon, Chris. Good work.
These "path to net zero" claims by supposedly respectable authorities, that can and will never be achieved in practice, are preposterous and completely risible. It's hard to know what to put it down to - are they being naive, disingenuous or brazenly mendacious?