

Hydrogen? The £64B Question
Could we produce hydrogen from surplus renewable energy? Yes, but not easily or cheaply.

Summary
In my post of 03 January ‘23 and again in this post I show that surplus renewable power *has* to be constrained to allow grid operator National Grid ESO to maintain control over the grid. In other words, there can NOT be ‘surplus renewable energy’ unless something drastically changes, on GB’s or anyone else’s grid.
Logically, we can only capture excess renewable energy in quantities relevant to keeping our economy powered:
- when there is indeed a surplus of renewable power;
- *and* by providing immense flexible *and* reliable additional Demand to make use of surplus renewable power.
Battery technology is not currently up to this task without bankrupting us and/or the planet. Storing surplus renewable power as chemical energy (for example using hydrogen as an energy vector) is technically possible.
Exactly *how* might we generate enough ‘green’ hydrogen from surplus renewable power to actually make a difference to anything? In this post I explore some of the issues that jump out at me.
And having gone through the whole post and seen where the data has taken me, I’m beginning to suspect this is a $64T (as in trillion) question.
Same Basis as Previously
I use real data collected by Gridwatch because too much can be hidden in complex models. I use the records of real power flows generated/used/interconnected for the whole of Great Britain and simply extrapolate to get an idea of where HM Gov’s energy plans might lead.
As I explained in my 23 December post, I am now applying adjustment factors1 to the wind and solar PV power data as recorded by Gridwatch. I continue to use the same units: mega-watts (MW) for power flows and mega-watt hours (MWh) for quantities of energy. Supply must balance demand2 across the grid every minute of every day.
The Grid Stability Limit
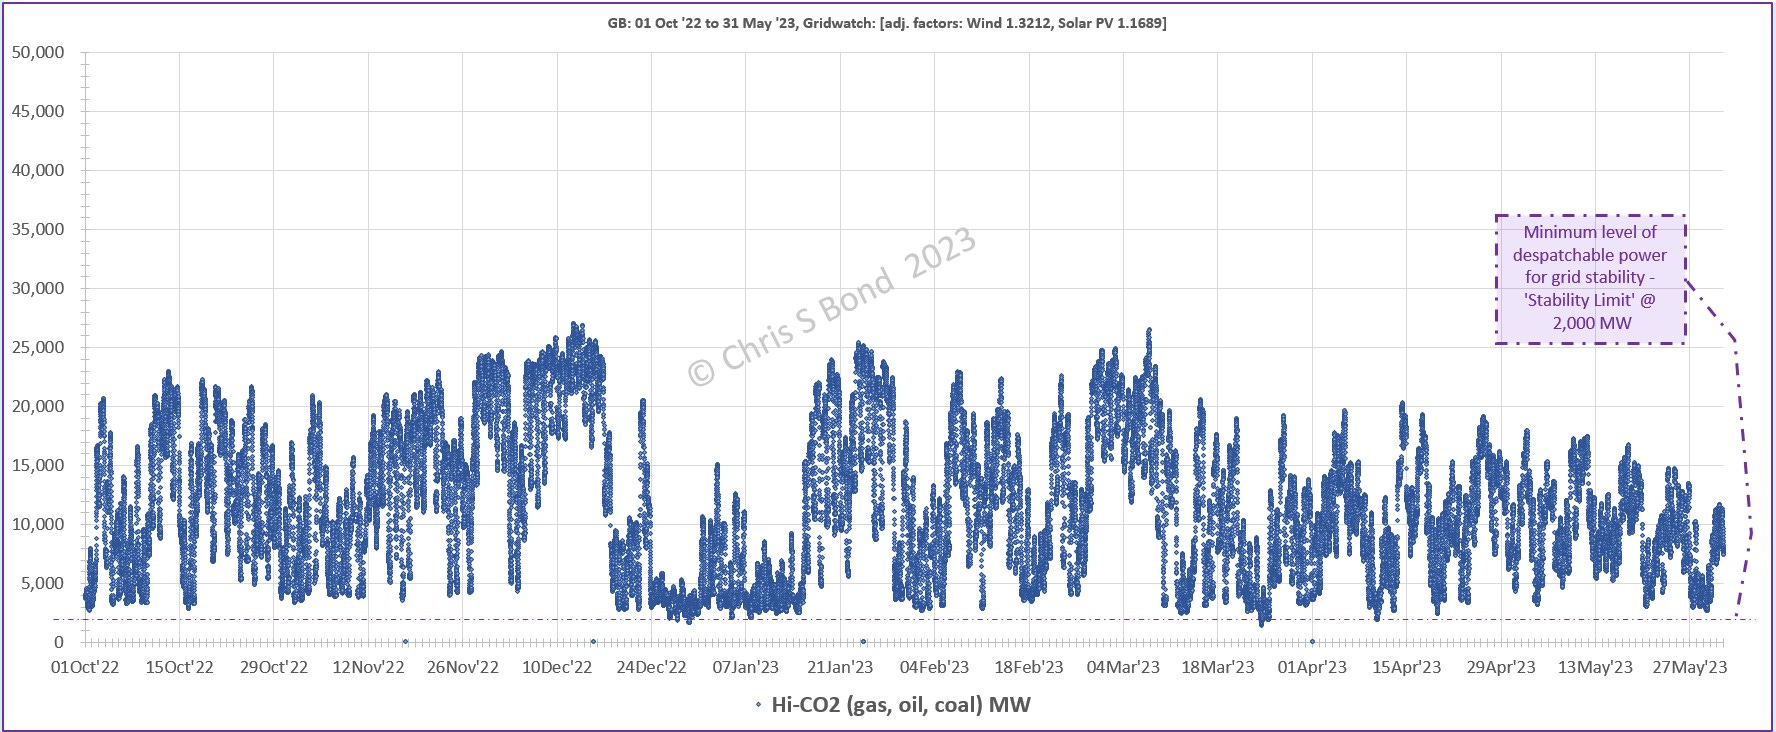
Great Britain’s power grid is controlled to maintain stability - as are all power grids. Currently this means that controllable ‘dispatchable’ power generation using mainly natural gas fuel is maintained above ~2,000 MW by National Grid ESO. If the wind is blowing too perfectly and/or the sun is shining too brightly when Demand is low, NG ESO issues instructions to some renewables generators to constrain their outputs. Sometimes, I’m told, NG ESO begs other countries to take excess GB power via interconnectors and pays handsomely for the service. The results of NG ESO actions can be seen if you plot the sum of [high-CO2] dispatchable power. The level rarely drops below 2,000 MW, so that’s what I’ve called the “Stability Limit”.
Chart 1: Demonstration of GB’s Grid Stability Limit
To see the consequences of destabilising a grid, consider Pakistan.
This means that Demand has to be increased *flexibly* and *reliably* otherwise we can never capture any surplus and/or extra renewable generation.
Current GB
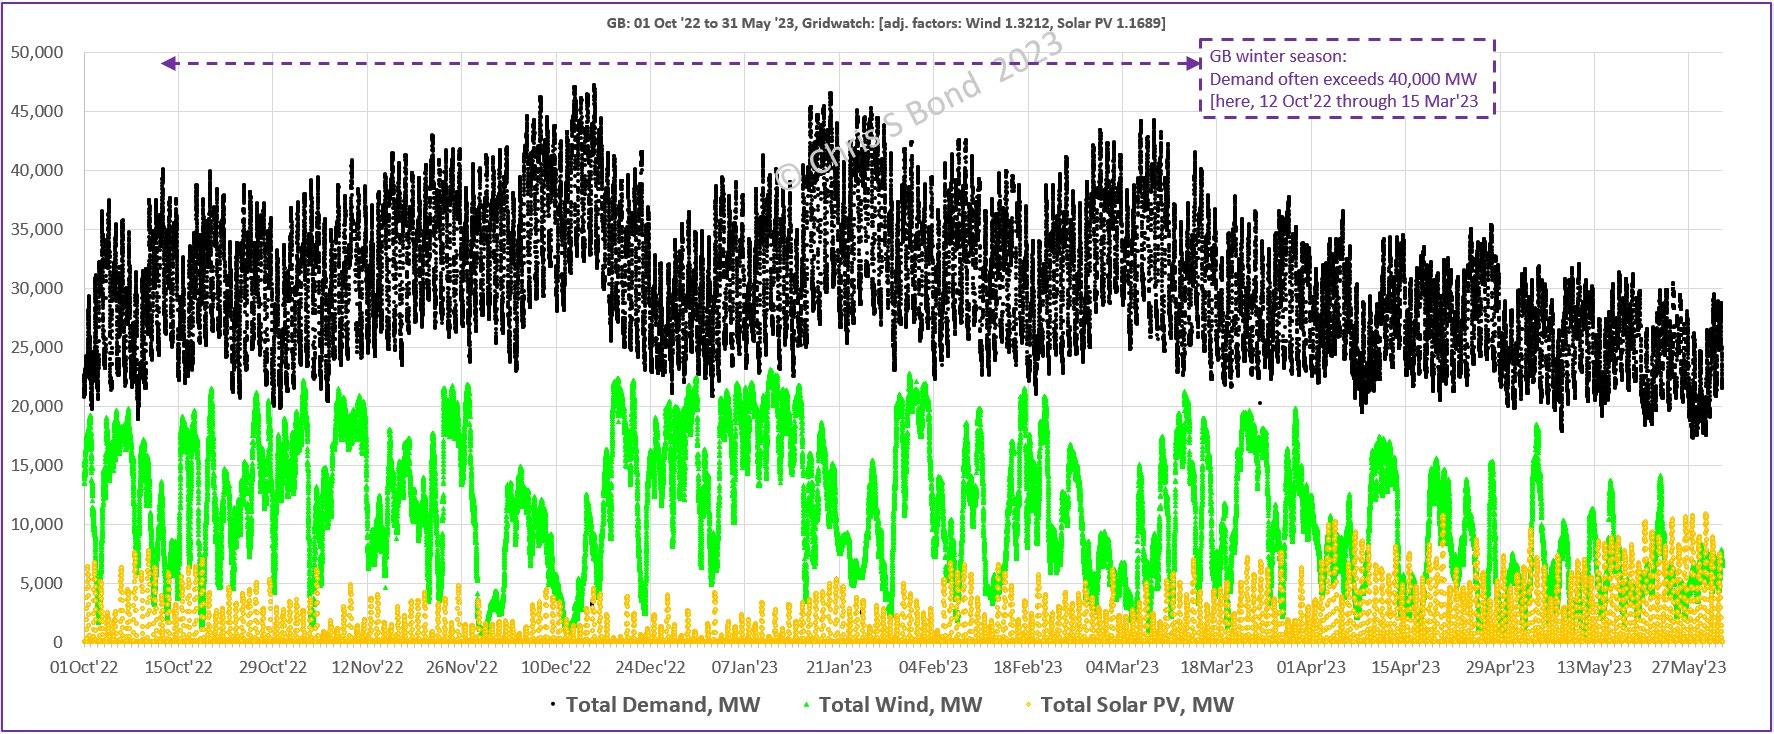
I downloaded Gridwatch data for 01 October 2022 through 31 May 2023, applied the adjustment factors to Wind and Solar PV, and plotted the results. The shockingly-long ‘Christmas-New Year’ low-Demand season coincided with strong Winds (and almost no Solar coz midwinter) leading to the long period of minimal dispatchable power visible in the above chart. Just prior to that in mid-December there was little wind and we burnt an awful lot of gas to keep the lights on and people from freezing. Ditto late January… and so on.
Chart 2: GB Demand, Wind and Solar, 01 Oct ‘22 through 31 May ‘23
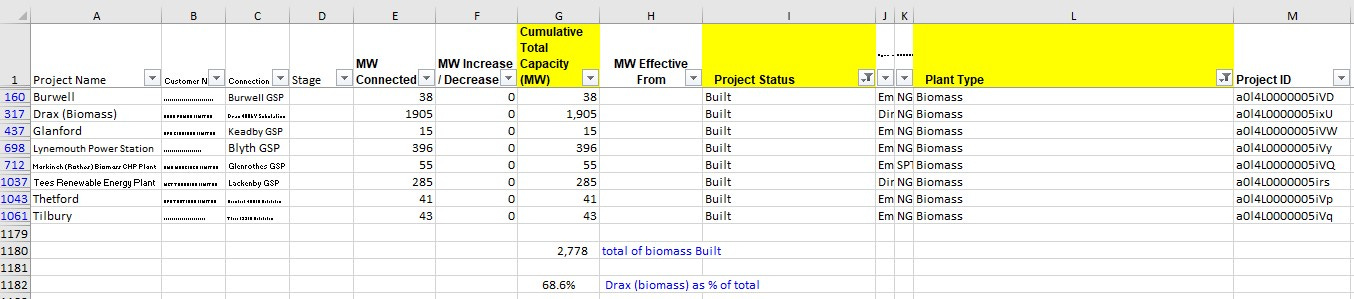
The whole idea behind ‘net zero’ is to displace fossil / high-CO2 sources of power generation with ‘clean’ low-CO2 sources like Wind, Solar PV and Nuclear. The high-CO2 sources are Gas, Coal (rarely used), and Oil (very rarely used). In many people’s opinion including mine, the mass burning of ‘biomass’ (imported wood chips) at Drax is also high-CO2. Of the registered ‘biomass’ generators sucking in ‘green’ credits, Drax is 68.6% - see below. Therefore in my analysis, 68.6% of ‘biomass’ is high-CO2 and needs to be displaced by low-CO2 power sources.
Table 1: Registered ‘Biomass’ Installations, GB
Of course, until GB and other countries honestly account for embedded emissions in imports, we will continue to de-industrialise to the benefit of other countries. But that’s a complete whole other story apparently too complex for our ‘leaders’ to grasp, so they’ll continue to pursue policies that reduce CO2-only in-territory emissions that incentivise our economic decline.
Future GB
To show what the future might hold, let us assume that we proceed with HM Gov’s ‘plan’ to increase wind *capacity*3 by a factor of around 5 by around 2030-ish, while also allowing solar PV *capacity* to double. Over roughly the same time-scale we apparently should expect electrification of home heating (via heat pumps) and of transport (electric cars, buses & trucks) to increase demand for electricity. McKinsey in their February 10, 2022 | Article predict electricity demand to be 1.56 times higher.
Based on 01 October 2022 through 31 May 2023 actual weather we get Chart 3.
Chart 3: Extrapolated Future GB, Based on Actual Weather 01 Oct ‘22 through 31 May ‘23
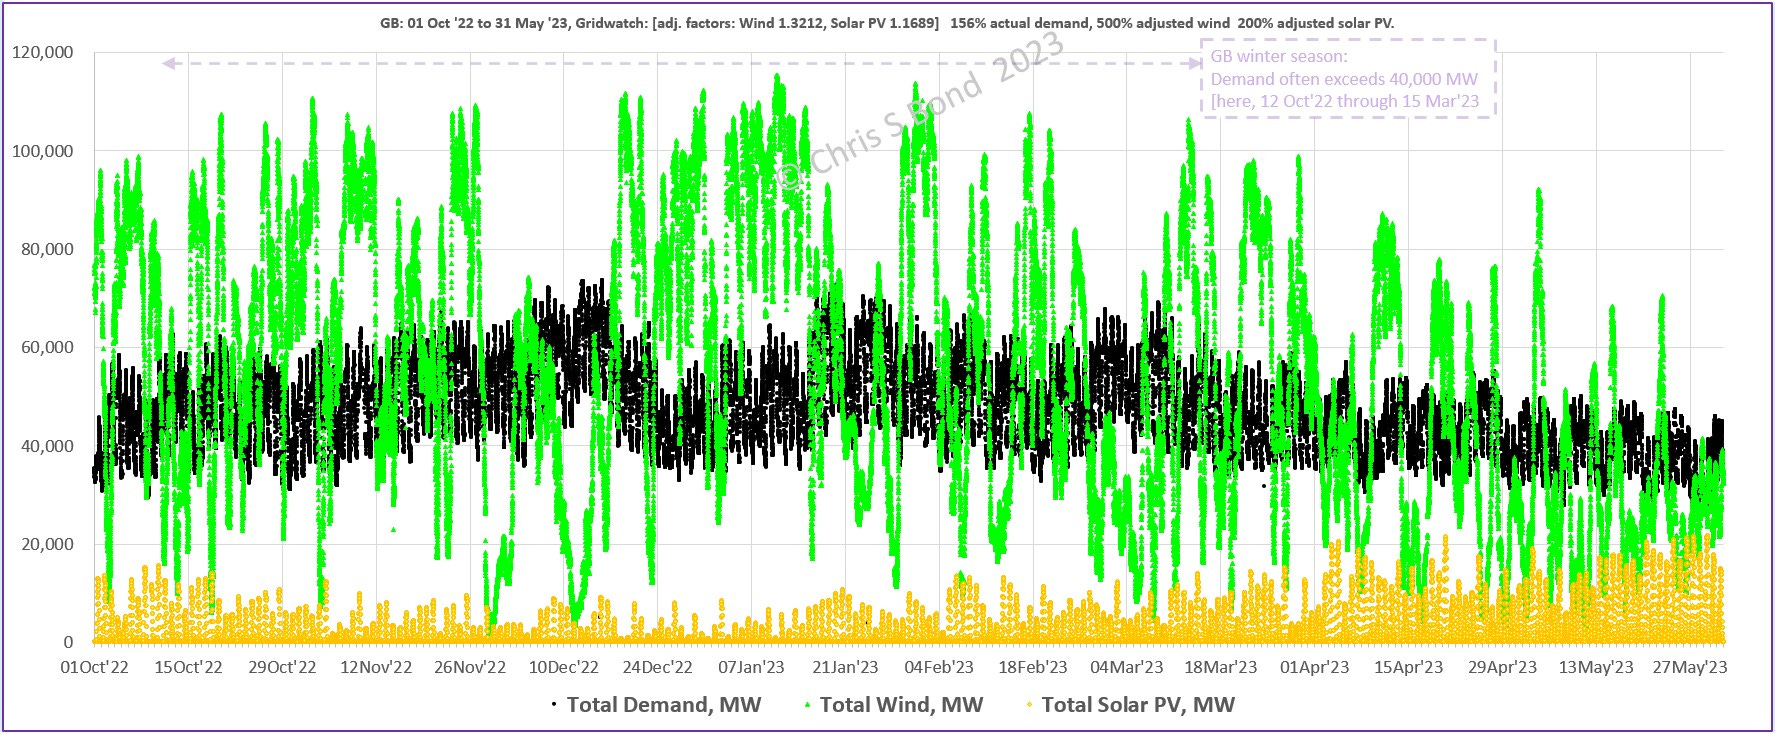
Wind obviously dominates Future GB’s power generation with Solar PV lagging far behind in the winter when we need power the most. What does this achieve in terms of instantaneously displacing high-CO2 generation? The plot of Demand - [low-CO2 power] reveals all:
Chart 4: Future GB - Shortfall / [Potential] Power Surplus Plot:
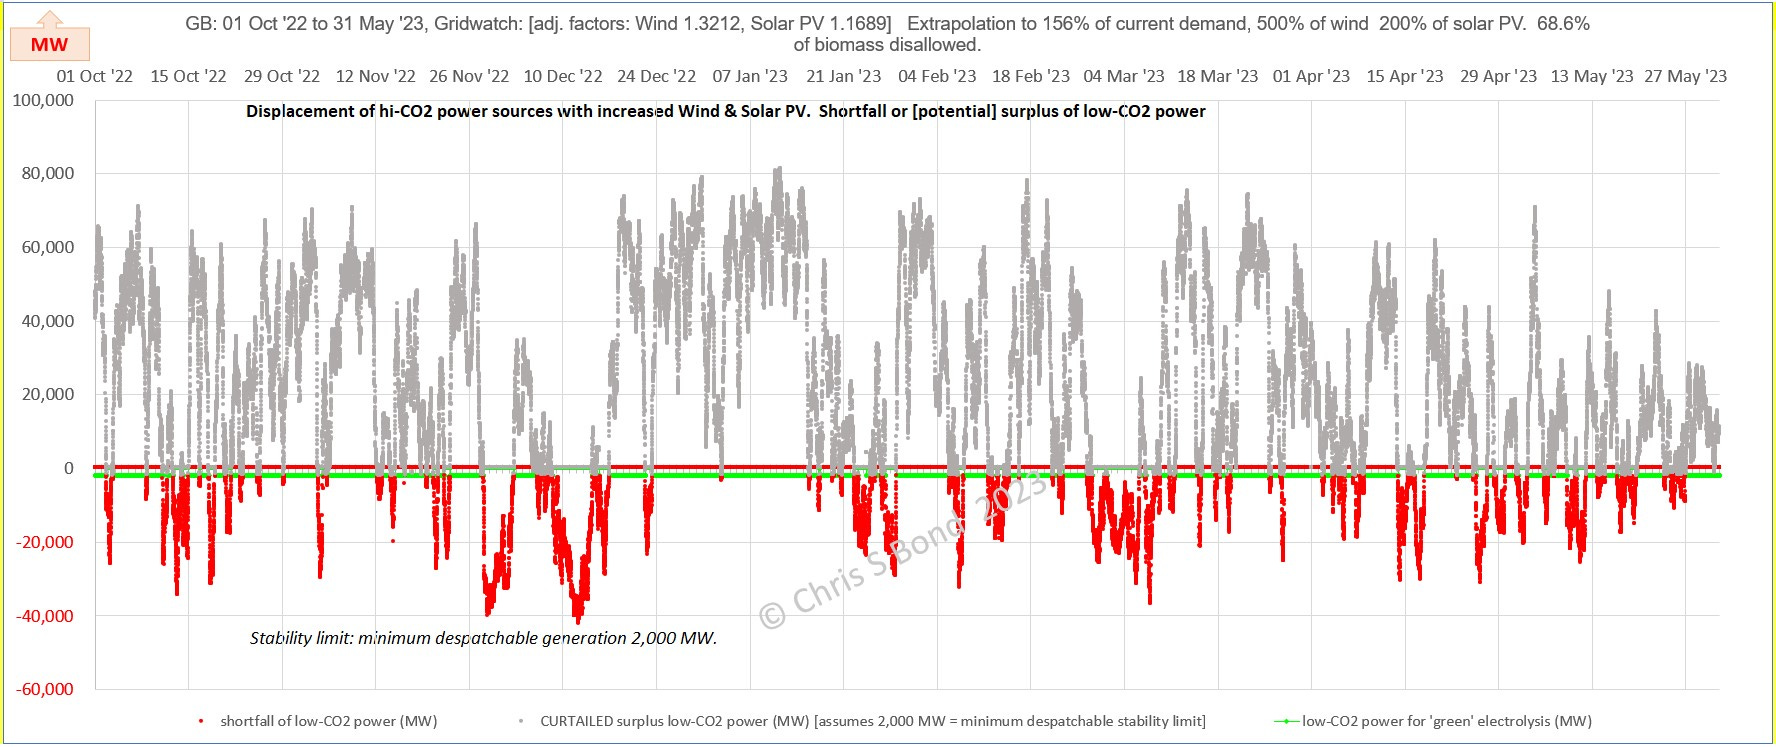
All the grey spikes show potential surplus renewable energy in 2035. All the red spikes below the axis show where there would still be shortfalls of renewable power generation despite the forests of new windmills and acres of new solar PV installation we will have (might have) installed by around 2035.
What would we need to be able to make use of that potential surplus? Additional reliable, flexible Demand capable of receiving at least a proportion of the up to 80,000 MW power flows.
Let’s start small. Let’s add 20,000 MW of Demand which we’ll design to be both reliable and flexible so that NG ESO can safely allocate surplus low-CO2 power to it. That ‘small’ extra Demand is equal to about half of GB’s current total Demand, but we’ve got to dream big-ish.
Chart 5: Future GB - Shortfall / [Potential] Power Surplus Plot with 20 GW Extra Demand:
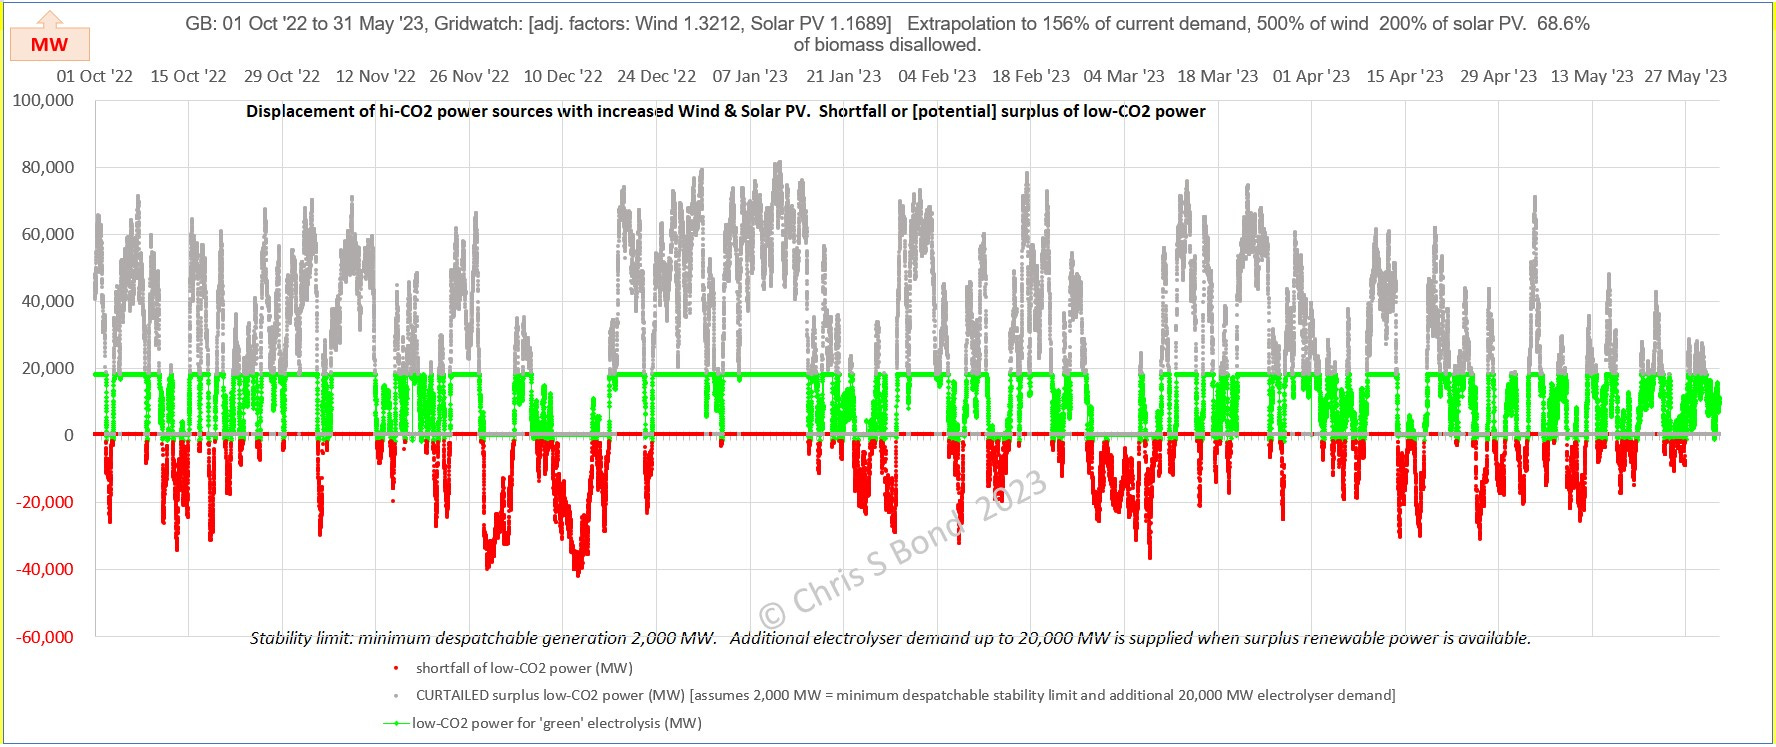
The green band represents the extra power we can capture using our additional Demand. The grey spikes represent the surplus we would still need to constrain. The red shortfalls still remain - mainly in winter when we need reliable power the most, but even in Spring and early Summer when Solar PV cannot make up for low Wind.
Additional Reliable Flexible Demand
What quantities of energy are we looking at in the scenario outlined above for Future GB with 20,000 MW of extra Demand? The cumulative energy plot tells us:
Chart 6: Future GB - Cumulative Power Plot:
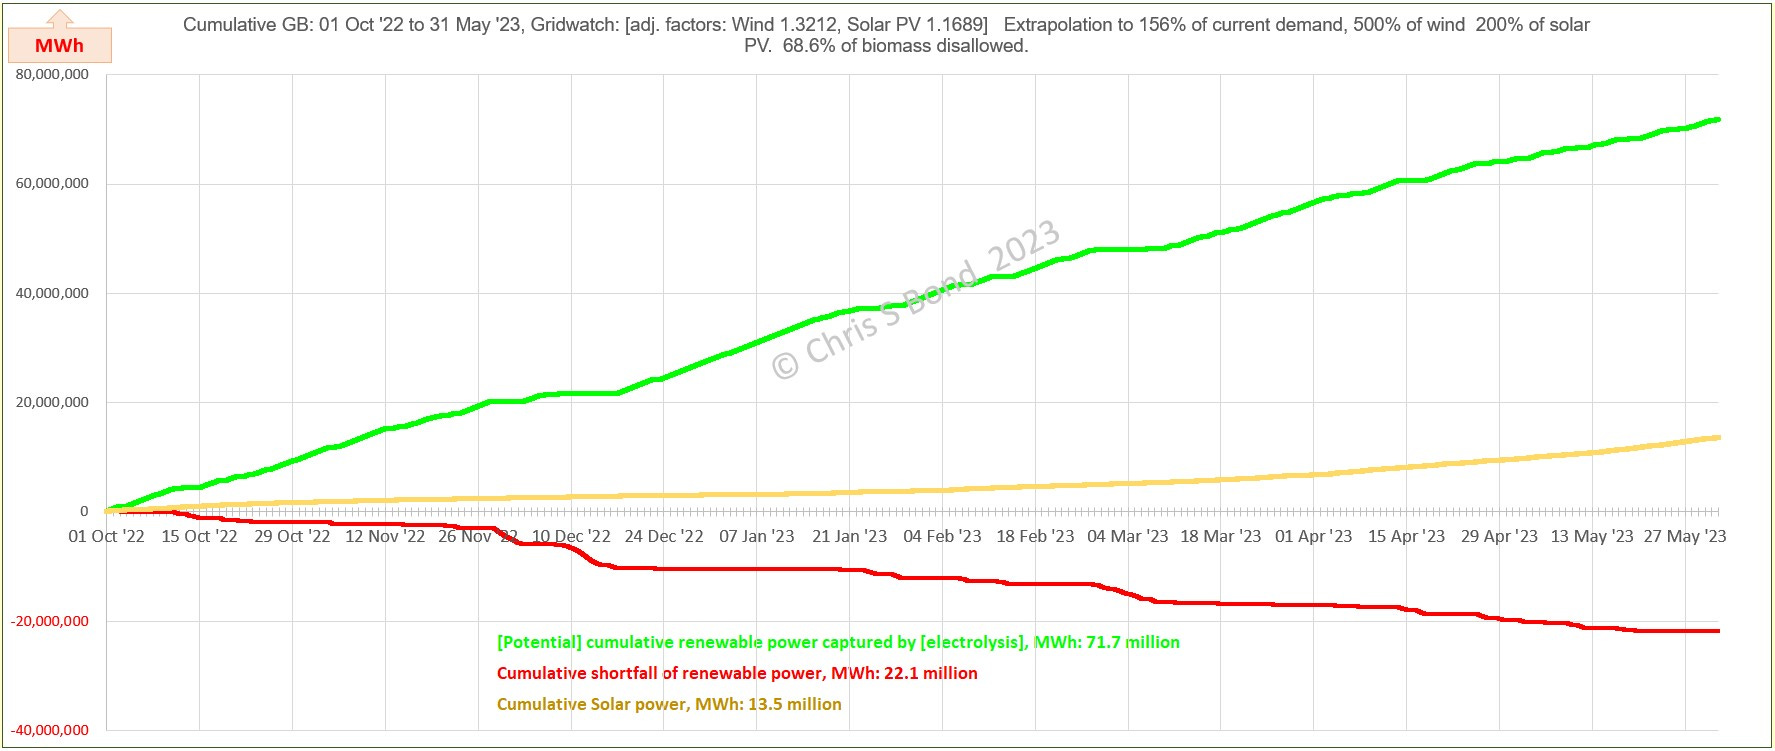
Remember that the enormous additional power generated from the Wind farms and Solar PV facilities (see P.S. note) would have to be conducted via reinforced power grids from sources to Demands. This in addition to the extra infrastructure needed to provide the extra Demand. All to capture 72 million MWh extra while leaving 22 million MWh still provided by high-CO2 dispatchable generators. What could the extra Demand look like?
Electrolyser Systems
If the additional demand was provided by electrolysers they (and all their associated process equipment, see Figure 1, Figure 2) would be operating intermittently if they only operated on surplus low-CO2 energy. Any process like this is better and more efficiently operated continuously at steady state.
Figure 1: Alkaline Electrolyser Plant - with H2 Storage (and Leaks)
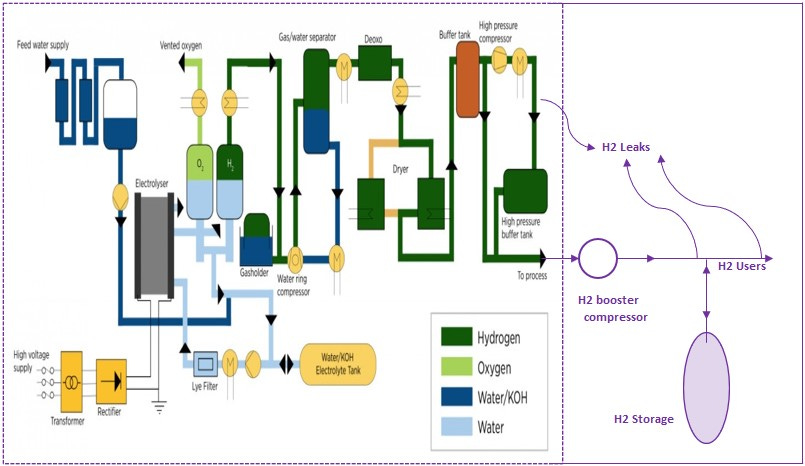
Figure 2: PEM Electrolyser Plant - with H2 Storage (and Leaks)
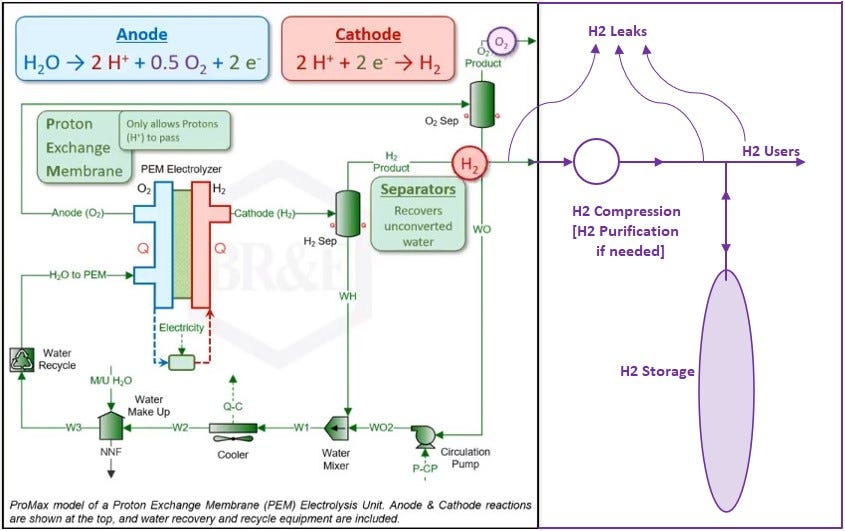
Hydrogen is both a tiny molecule that tends to escape, and has significant global warming potential. Hence the significance of including leaks in these graphics.
What might an electrolyser look like? The large capacity high-pressure alkaline electrolyser in Figure 3 was recently announced. It is has a diameter of 2m and is rated for a current of 5.5 MW at which it should produce 100 kg of pure hydrogen per hour. Yes, you read that correctly: per hour.
Figure 3: (Claimed) World’s Largest Alkaline Electrolyser
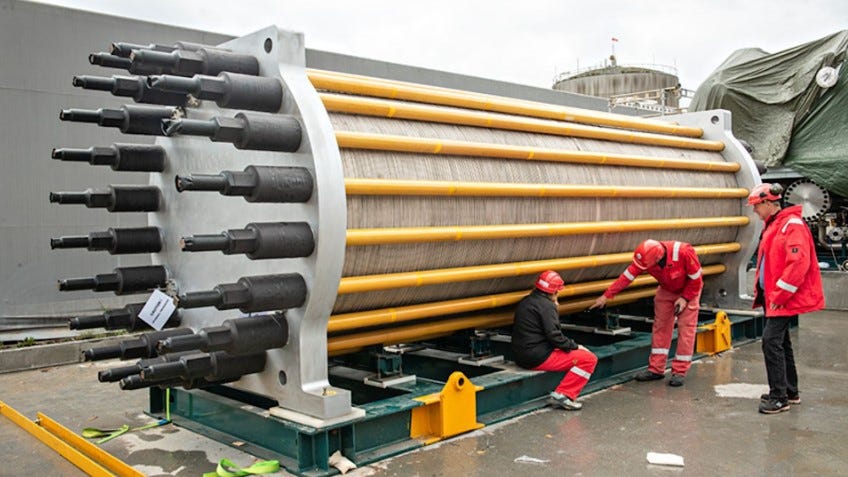
So, in order to capture 20,000 MW of additional Demand, GB would need ~4,000 of these beasts, plus all the associated kit. Hmmm. “HydrogenPro’s new electrolyser plant in Tianjin, China, is now in full operation. The factory has already produced its first electrolysers and can deliver one 5.5MW electrolyser per week going forward.” One per week, that’s 4,000 weeks of production… Oh, dear!
But at least that’s pure green hydrogen, right? Yes, but surely the temptation would be to run that very expensive system 24/7 on whatever power was available and then claim it’s green hydrogen. The financial incentives to do so would be enormous.
But no doubt a whole new industry of certification authorities with their attendant bureaucracies would spring up to provide 100% reliable verification of the greenness of the hydrogen molecules. Maybe that’s where some of the new ‘green’ jobs we’ve been promised will come from.
Almost the end.
P.S. Solar Utilities
As I posted in late May, I think we should design additional Solar PV separately and systematically because its generation profile is largely predictable. Enormous spikes of solar power flood the grid every sunny day, generating more problems than they should. If we planned new solar facilities as solar utilities complete with their own battery systems to level out the power they supply to the grid, the spikes are around one third the magnitude. For a real example, look at what the data shows us for
29 May ‘23, a long sunny day. An ‘unbuffered’ 100 MWp solar facility would produce 100 MW in the middle of the day and nothing in the night. A ‘buffered’ solar utility with 510 MWh of battery energy storage as sketched below would produce 33 MW continuously for 24 hours.
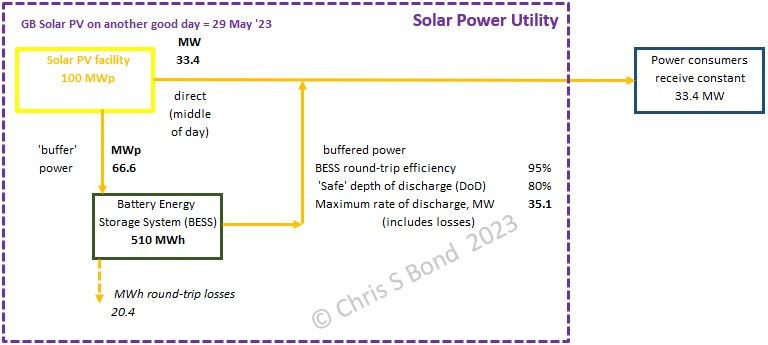
Technically, maybe that’s possible. But at 2½ times the storage capacity of “Europe's biggest battery storage system” at Cottingham, presumably for 2½ times Cottingham’s £80 million cost, it’s going to be far from cheap.
Incidentally, the WEF post about Cottingham says: “It can store enough energy to power around 300,000 homes for two hours, says Harmony Energy…” These are Tesla “Megapacks”. What limits them to two hours? Imagine a Tesla car: “it’s got 400 mile range but you need to use that up in two hours…” What would happen if you charged then discharged the Cottingham Tesla “Megapacks” over 24 hours?
P.P.S. What Colour Hydrogen?
I’ll nail my hydrogen colours to the mast. With current technology, I believe the only truly ‘green’ hydrogen is that produced by electrolysers running on surplus renewable electricity. I do *not* think that deriving hydrogen from fossil feedstock will solve the issue of rising CO2 in the atmosphere, for reasons I set out here. Continuing to use fossil fuels also prolongs fugitive methane emissions from extraction / processing / transport.
P.P.P.S. Costs of Constraints
I found an old Drax post stating how much Wind energy had been constrained (they call it ‘curtailed’) in Great Britain just in 2020 and 2021:
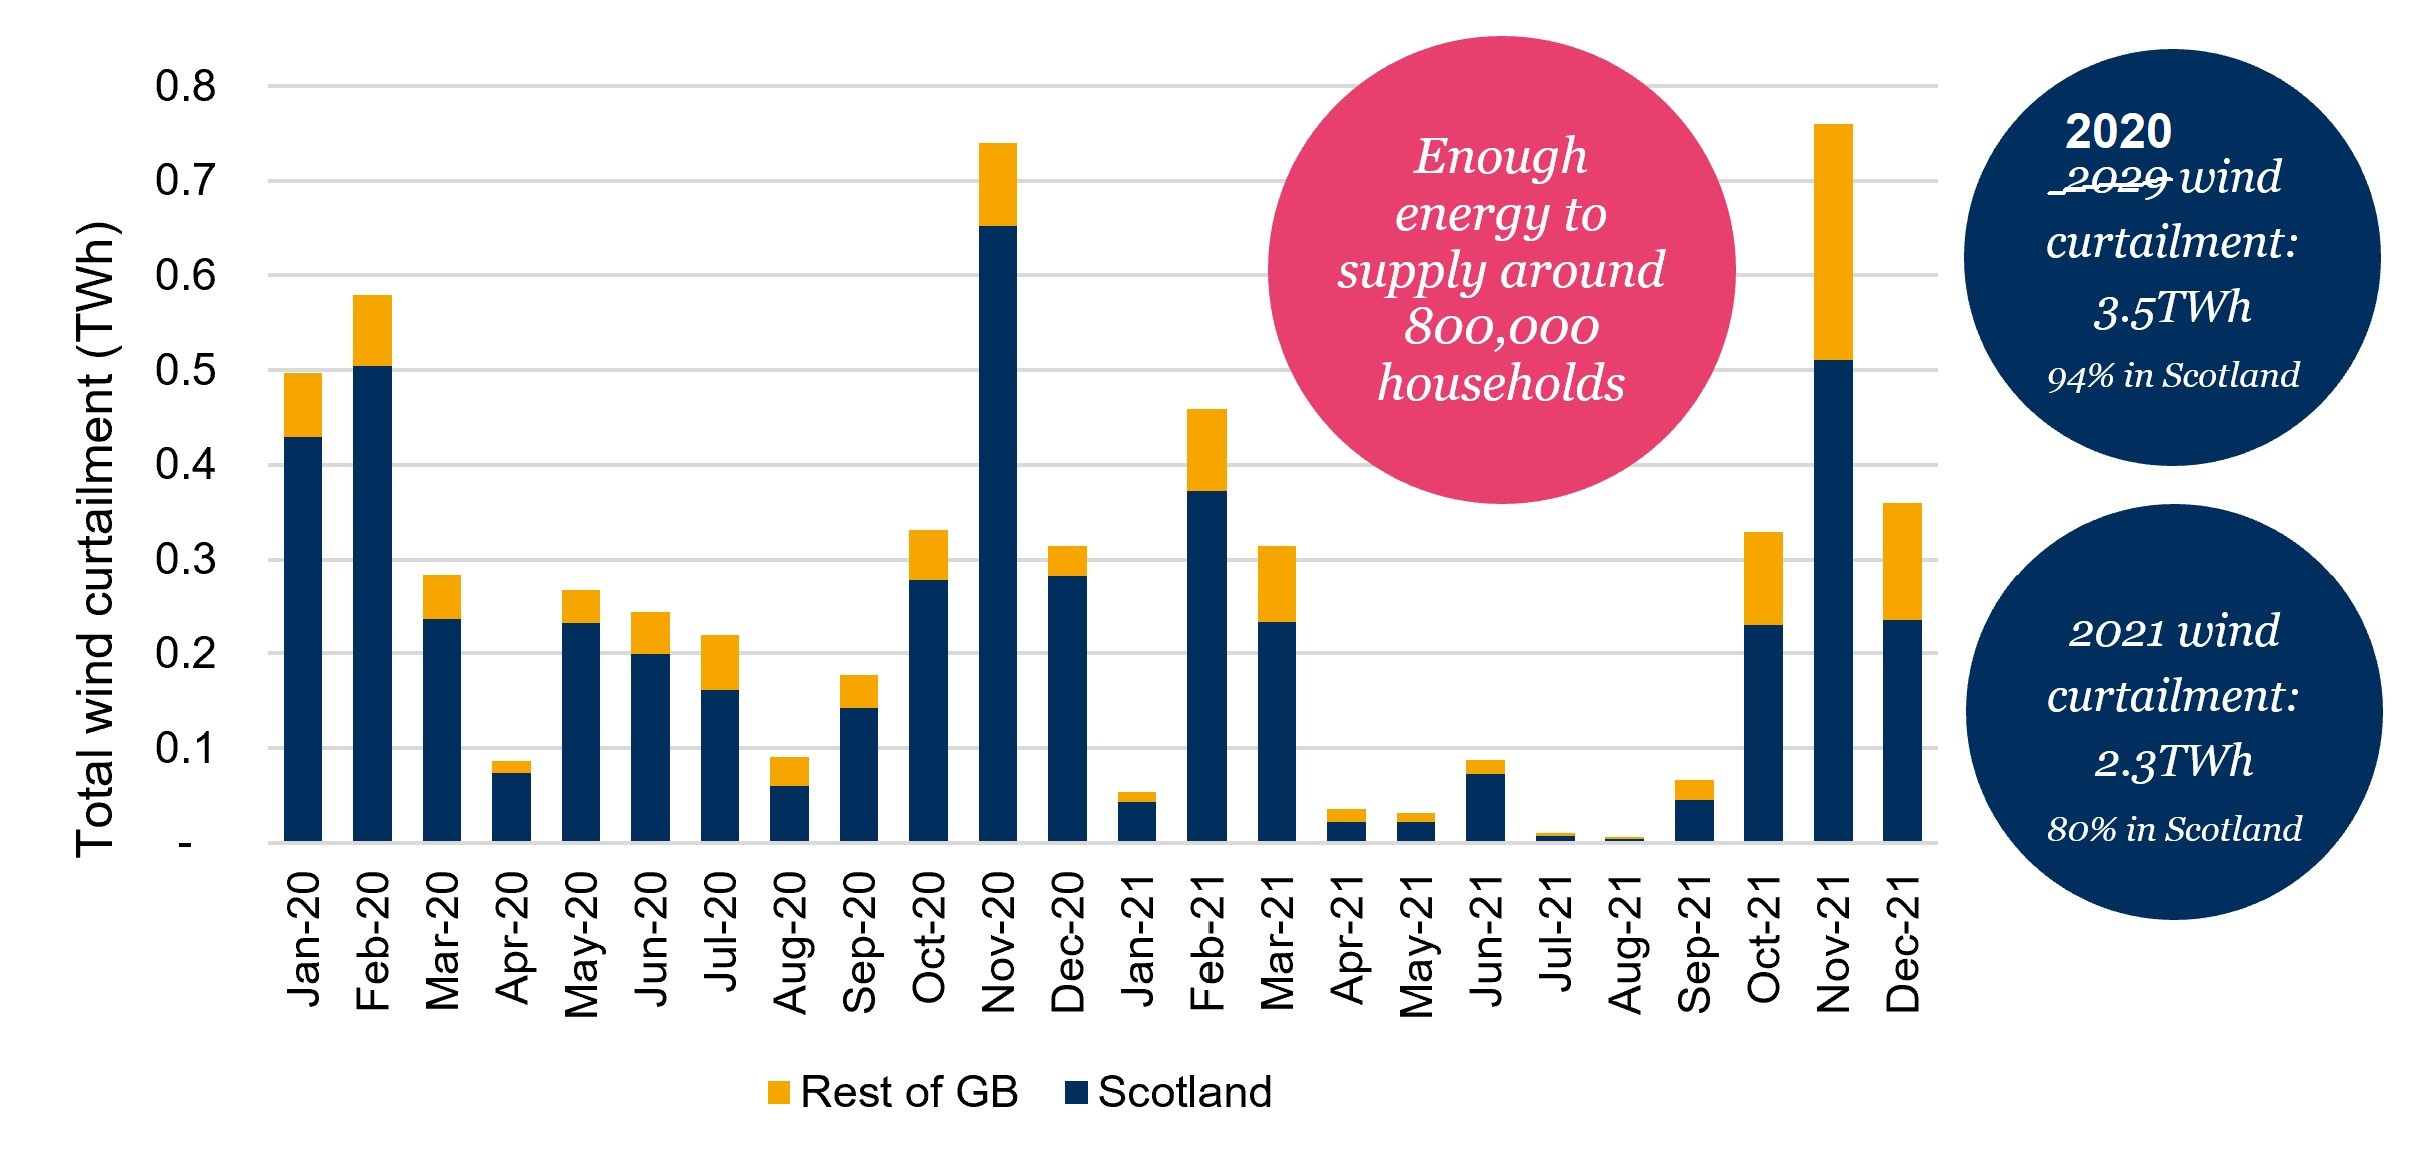
We know that the hills of Scotland have been festooned with windmills, and the waters around Scotland are especially blessed4 with lots of wind *on average*. It appears the thinking around some of these wind farms has not been very 'joined up'. Locally installing wind *capacity* but not bothering to consider the system needed to conduct the generated power - when the wind is blowing just right - to where it's consumed seems very short-sighted.
Drax also translated the constrained electricity into costs imposed on UK bill-payers because of this lack of joined-up thinking:
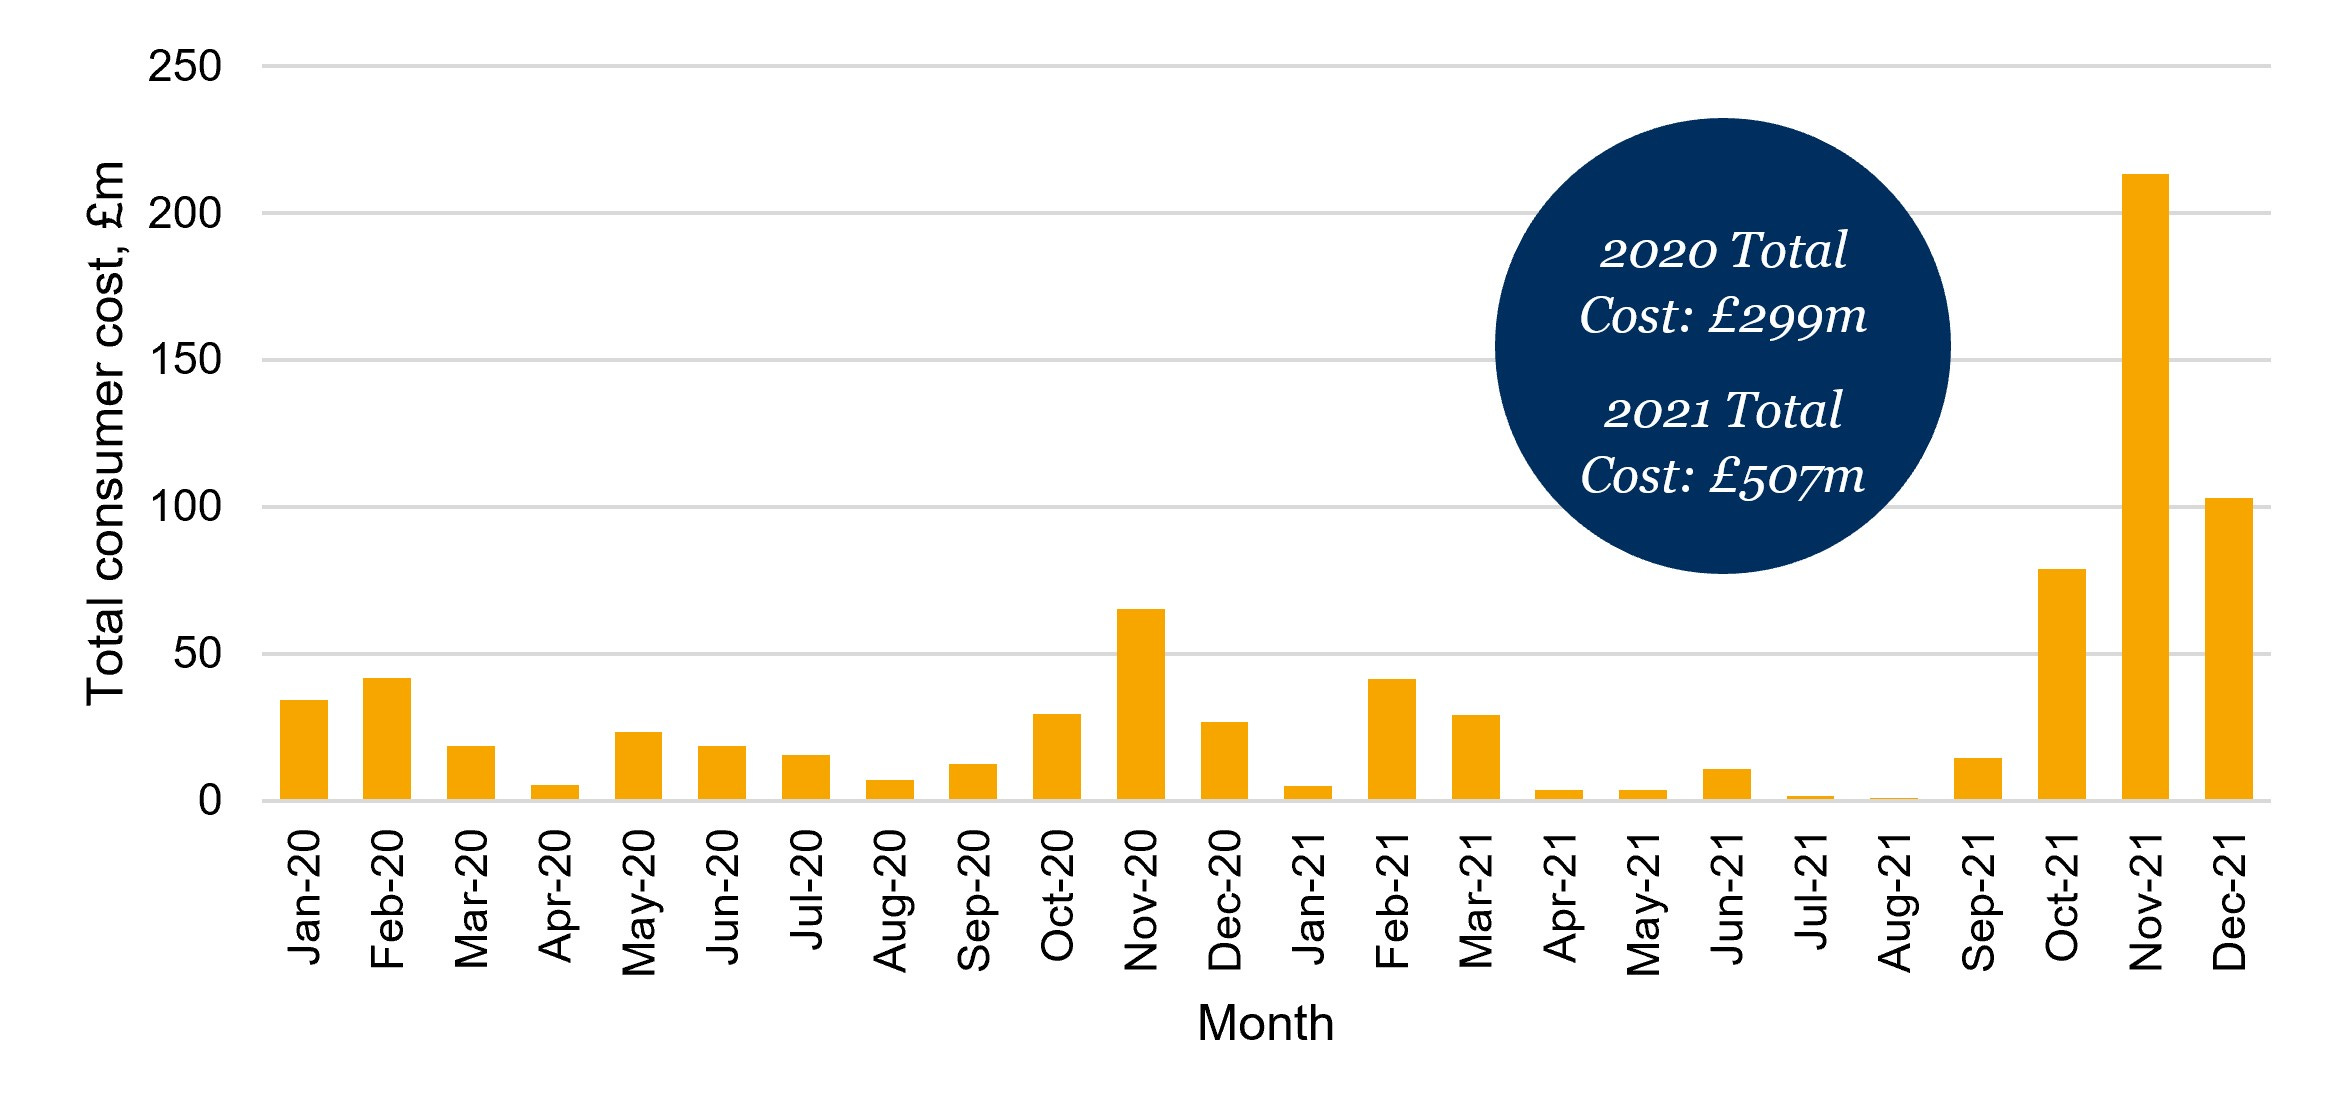
In two years, over £800 million paid to generators NOT to generate power. The current system is broken. No wonder our power bills5 have been going ever upwards, even before Putin began waging war on a neighbouring sovereign country.
Disclaimer: Opinions expressed are solely my own.
This material is not peer-reviewed. This is why I’ve stopped believing it would do any good anyway.
I am against #GroupThink.
Your feedback via polite factual comments / reasoned arguments welcome.
I called them ‘correction factors’ in my 23 Dec ‘22 post, but considering that Gridwatch data is not fully reconciled - nor claims to be - I think ‘adjustment factors’ is a fairer description.
Gridwatch records a set of GB power flows every 5 minutes. Hence to a close-enough approximation, GB energy quantity (MWh) is power flow (MW) x 5/60 (h). Add these MWhs together and you get MWh energy per day, per month, per year, etc.
Power grids must be kept in balance to close tolerances, meaning that supply must equal demand every minute of every day everywhere on the grid. If that balance is lost, the grid operator has to take action, for example by disconnecting demand in the area of the supply shortage (example: the GB power system disruption of 9 August 2019). Alternatively, over-supply of generation has to be curtailed, which is expensive - see the P.P.P.S.
At the extreme with chronic under-supply (for whatever reason), you’ll tend to end up with economy-destroying loadshedding as in South Africa.
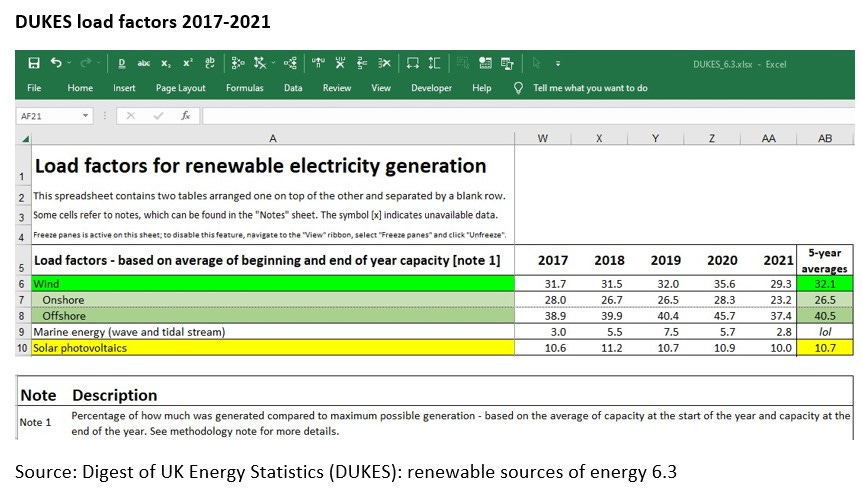
I put *capacity* of renewable sources within asterisks to remind readers that the measured actual ‘load factors’ of GB’s entire fleets of wind and solar PV through the last five years are small to moderate percentages of the nominal numbers:
If you work offshore Scotland you probably regard this as a mixed blessing.
In case you’re wondering: I’m currently paying 32.59624 p/kWh for my domestic electricity, which as of 06 June ‘23 GBP:USD conversion rate is 40.45 US c/kWh.
This is another brilliant article, Chris. An exposé using easy to follow analysis of the utter futility of pursuing the 100% renewables path to 'net zero'/eliminating fossil fuel usage. It is, almost literally, "tilting at windmills".
I will have to re-read several times to get comfortable with some of the maths and science but I have already linked to this article on other social media I follow.
Amazing that the 'no nonsense', pragmatic analysis falls on someone like you, doing this non-professionally, when it should really be taken up by officially sponsored and supported engineering/science researchers in industry or academia.
Massive respect for your commitment to truth and integrity. Thank you.
I found this podcast was quite interesting.
https://www.buzzsprout.com/257968?client_source=large_player&iframe=true&referrer=https://www.buzzsprout.com/257968.js?container_id=buzzsprout-large-player&player=large#
It discusses the recent spate of negative wholesale electricity prices in Europe caused by surplus solar generation and the prospect for a lot more surplus, and how it varies between countries. There is discussion of the need to curtail subsidies for surplus production, but no realisation that this means there would need to be higher prices for useful output to compensate. Also a rather bland assumption that variable demand (when you charge your EV) plus green hydrogen will solve it without looking at what that would take. The $64bn question you rightly ask. There is also an arrogant assumption that nuclear should give way to solar with no justification. They are still way behind the curve in their thinking.