

Labour's Climate 'Mission'
Extrapolating from 2023 data says it's impossible

Introduction
Revisions from original post are marked [rev 1]
I was prompted by some correspondence with John B to look into the Labour Party’s ‘Missions’, published in February 2023: “These five bold missions will form the backbone of Labour’s election manifesto and will drive forward a Labour government.” Fair enough, Labour are widely predicted to form the next HM Gov
I’m most interested in their Mission to “Switch on Great British Energy”. Specifically, what this mission involves in terms of the targets for *capacities* of Wind and Solar PV generation - summarised in Figure 1 - and whether these will keep our lights on.
Figure 1: Labour Mission Climate
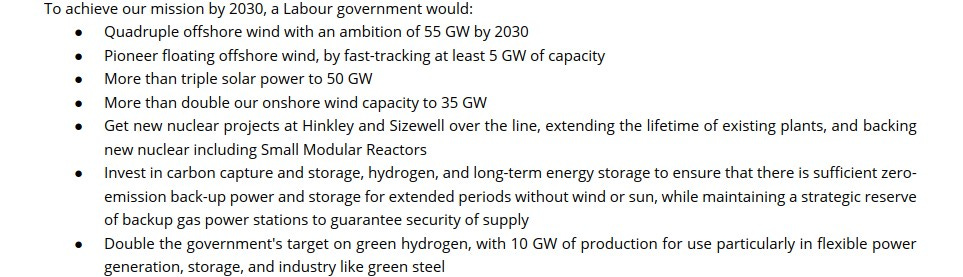
I interpret the first four points to mean the intention is to end up with total generation *capacities* by [the end of] 2030 of:
55,000 MW (fixed) + 5,000 MW (floating) = 60,000 MW Offshore Wind;
35,000 MW Onshore Wind;
50,000 MW of Solar PV
New nuclear may be approved by then, but not built / operating. Extending the lifetime of existing nuclear plants may be possible.
Carbon Capture and Sequestration (CCS)
I assume by ‘storage’ Labour means ‘sequestration’ permanently in underground reservoirs such as depleted oil or gas formations. Because the two operating carbon capture plants inject the captured CO2 into depleted oil reservoirs to increase / enhance oil recovery. Yes, the CO2 is ‘stored’ underground, but it pushes up more oil and hence contributes to further CO2 emissions.
Globally, carbon capture works well (in e.g. gas production & petrochemicals) provided you can simply vent the captured CO2 to atmosphere. For power plants, as soon as you need to store / sequester the captured CO2 the CCS process is parasitic on the plant’s net useful output, reducing it by around 25%. This 14-page .pdf provides an overview of CCS (albeit from 2017).
Retrofitted CCS plants can be eye-wateringly expensive, example Boundary Dam: CAD $1.3 billion for a 110MW power plant. Also, “Captured CO2 from the Boundary Dam project will be pumped underground and sold to the Cenovus oil company for use in priming nearby oil fields, or buried in geological formations.” Boundary Dam continues to operate. SaskPower is coy as to how much CO2 goes to sequestration versus how much is sold to Cenovus.
Petra Nova in Texas has recently re-started operation, but it too sends its CO2 to a depleted oil reservoir to enhance oil recovery.
[In fact, instead of ever more ‘renewables’ and CCS with all its costs and uncertainties, I’m drawn to Roger Pielke Jnr’s suggestion to replace the ~150 biggest CO2-emitting coal plants with nuclear power plants by 2035. That seems far more likely to achieve a 25% reduction in global CO2 emissions from the burning of fossil fuels by 2035.]
Hydrogen
I have doubts around the practicality of capturing surplus intermittent ‘renewable’ power to produce ‘green’ hydrogen. Plus if those H2 molecules trade at premium prices because they are ‘green’, how will society be protected from rip-off merchants selling their ‘black’ or ‘grey’ or ‘blue’ hydrogen for the premium prices?
Long-Term Energy Storage
The holy grail of ‘renewable’ power. This currently does not exist, yet Labour appear wedded to the legislated ‘net zero’ timetable.
Where we are now vs. Labour’s ‘Mission’
Thanks to HM Gov’s Digest of UK Energy Statistics (DUKES) we have a good idea of GB’s current *capacities* of ‘renewable’ generation technologies.
Figure 2: DUKES 6.2 and Labour ‘Mission’ by end 2030
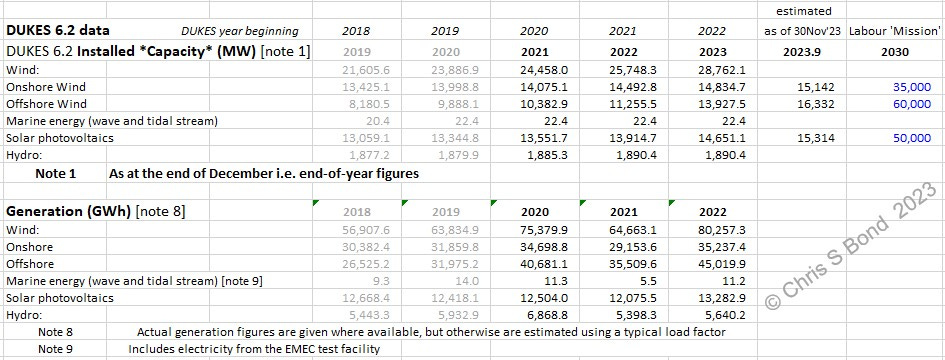
Figure 3: DUKES 6.2 and Labour ‘Mission’ (end 2030) - Plotted
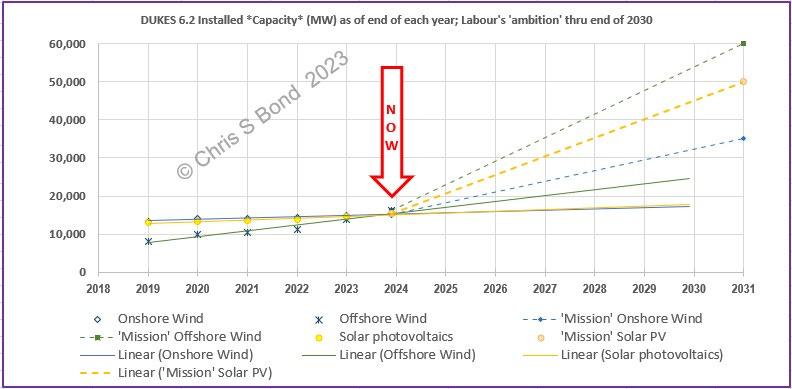
For end-2018 through end-2022, Onshore Wind and Solar PV plots are almost coincident, while Offshore Wind has been building more rapidly. If GB continued adding at the same rate we would follow the solid extrapolated lines. Instead, Labour’s ‘Mission’ requires greatly-accelerated rates of *capacity* addition as indicated by the dashed lines out to end-2030.
How Much More is This?
For my last post Dunkelflaute? Dunkelcobblers! I plotted nearly four years’ of real GB data. For this post I’ll use [rev 1] the 2023 to date set of real data and extrapolate using multiplication factors for Demand and for Wind and Solar PV.
Demand is fairly simple. To allow for increase Demand for electrification of home heating (via heat pumps) and of transport (electric cars, buses & trucks), McKinsey in their February 10, 2022 | Article predict electricity demand to be 1.56 times higher - for simplicity I’ll assume this also by end-2030.
Remembering always that average load factors are not performance guarantees:
- Solar PV efficiency may improve marginally, slightly increasing its effective average load factor: in my estimating I’ve allowed it to increase from 11.2% to 12.2%;
- Onshore Wind turbines may get a bit taller and be sited in better locations, so I’ll allow a 5 points increase in effective load factor, from 26.3% to 31.3%;
- Offshore Wind turbines are predicted to be taller still, so I’ll allow a 10 points increase in Offshore’s effective load factor, from 40.6% to 50.6%.
I suspect some ‘renewables’ proponents will claim higher increases, but I think we need some operational / maintenance / breakdown history for some of these novel / massive structures and machines before we can confidently assume more-optimistic numbers.
Combining the *capacities* and improvements in effectiveness I get the matrix of multipliers shown in the lower area of Figure 4.
[rev 1] Figure 4: Wind and Solar PV Multipliers for the ‘Mission’
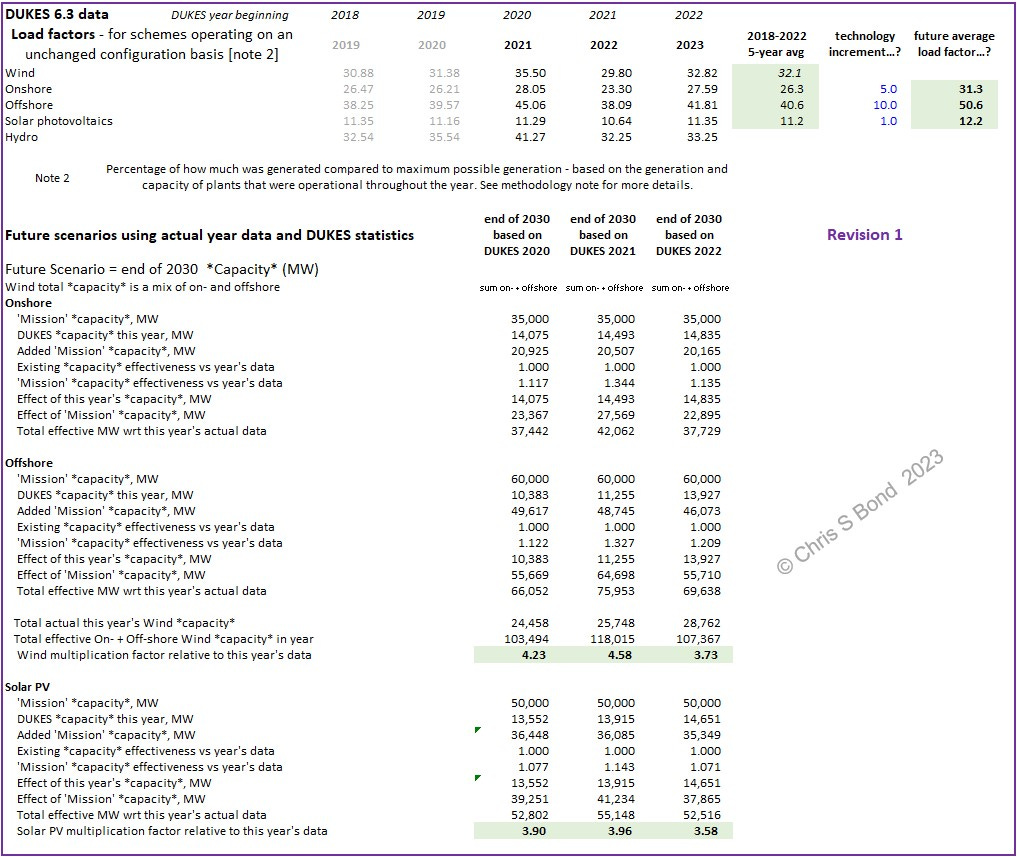
[rev 1] I realised I had messed up the multiplication factors in the original. The revised factors are higher.
Hence the Wind multipliers for predicting end-of-2030 power generation are:
[rev 1] 4.23 with 2020 Gridwatch data
[rev 1] 4.58 with 2021 Gridwatch data
[rev 1] 3.73 with 2022 & with 2023 Gridwatch data to date
And the Solar PV multipliers for predicting end-of-2030 power generation are:
[rev 1] 3.90 with 2020 Gridwatch data
[rev 1] 3.96 with 2021 Gridwatch data
[rev 1] 3.58 with 2022 and with 2023 Gridwatch data to date
[rev 1] Figure 5: End-of-2030 Using 2023 Data
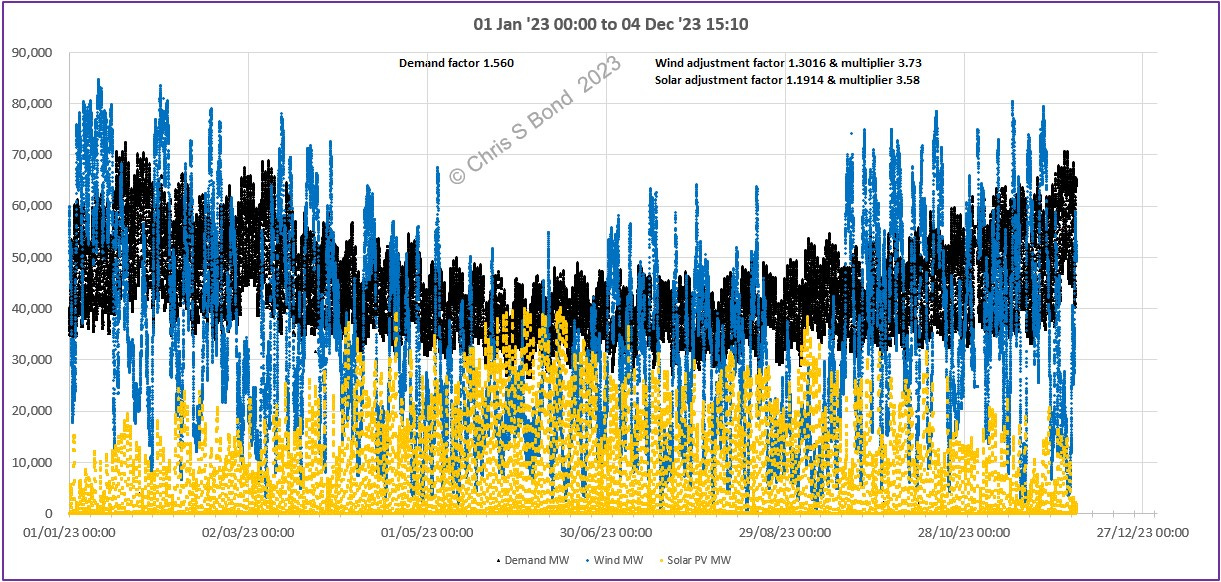
It’s a bit of a confusing mess but clear that in the sunny middle part of the year that massively-boosted Solar PV *capacity* would be sufficient to satisfy the increased Demand some days… never any nights though, absent immense electrical energy storage to time-shift those peaks of up to [rev 1] 40,277 MW on or around 14 June at 13:00. Peak energy in that day is [rev 1] 335,053 MWh i.e. 13,961 MW if averaged over the 24 hours.
Ignoring all the interconnectors, Nuclear power flows, ‘biomass’ and so on to simplify:
If Demand [2030] is less than {Wind [2030] + Solar PV [2030]} there’s a [potential] surplus;
If Demand [2030] is greater than {Wind [2030] + Solar PV [2030]} there’s a shortfall.
[rev 1] Figure 5A: End-of-2030 Using 2023 Data [potential] Surplus or Shortfall
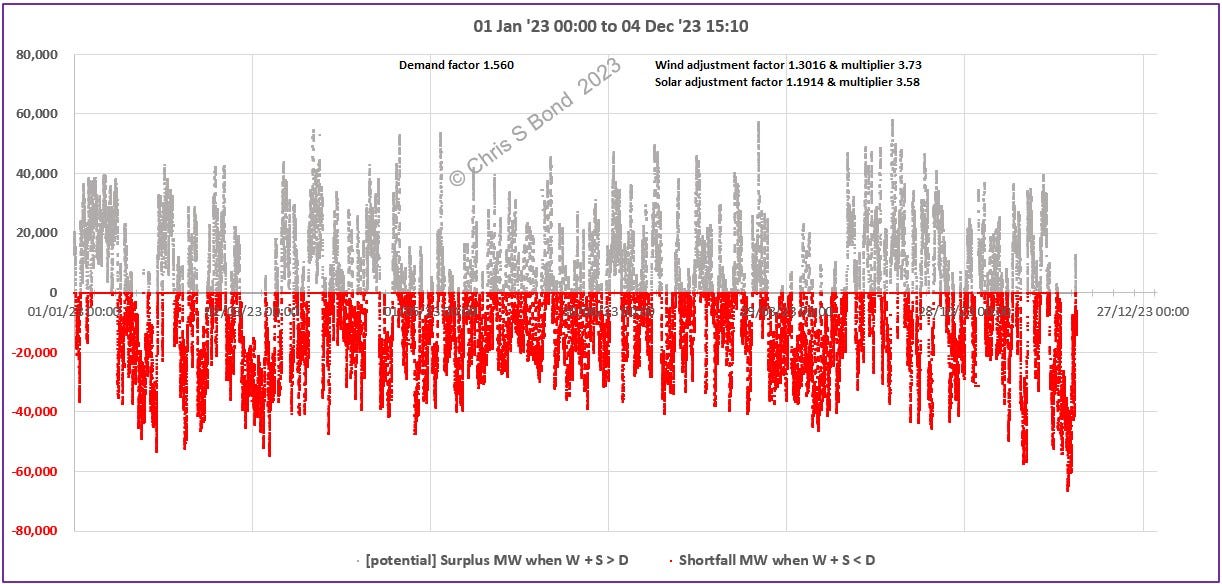
The Surplus is [potential] because currently the grid operator has to constrain excess generation in order to maintain grid frequency control.
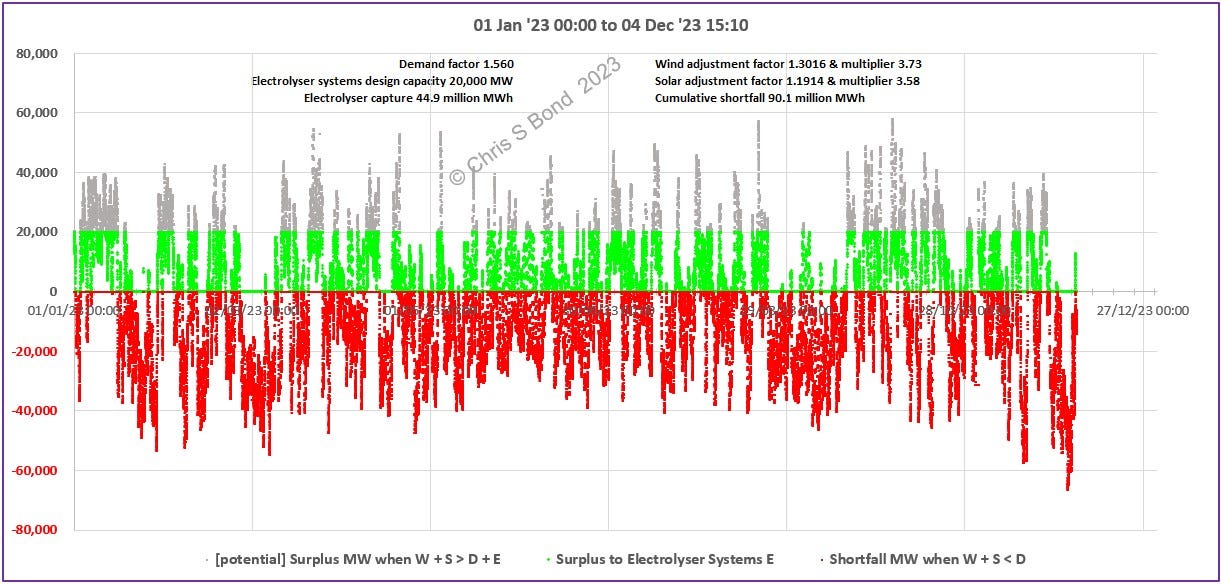
IF by the end of 2030 GB had designed, procured, commissioned and was operating 20,000 MW of electrolyser-based hydrogen plants (double what appears to be the ‘Mission’'s target) to provide additional flexible reliable Demand - then a portion of that Surplus would maybe become productive. Simple addition tells us the total
= [rev 1] 45 million MWh while the cumulative shortfall is [rev 1] 90 million MWh.
[rev 1] Figure 5B: End-of-2030 Using 2023 Data - H2, [potential] Surplus or Shortfall
At what total cost this hydrogen? We currently have no idea, although a November 2023 paper from Ramboll: “Achieving affordable green hydrogen production plants” indicates that hopes of rapid falls in cost as the technology scales are unlikely to be realised. It should also be noted that the Ramboll analysis is confined to the plant itself: additional costs for hydrogen distribution and storage infrastructure will be on top. And always the likelihood of hydrogen leakage (itself having warming potential) means the net benefit of avoided CO2 emission by generating hydrogen will be reduced.
Also, note the sheer magnitude of the shortfalls. Routinely 40,000 to 50,000 MW and occasionally peaking past 60,000 MW. That is the capacity of all the dispatchable reliable backup power generation we’d need to avoid the lights going out. Or significant fractions of that might follow from further destruction of our already-diminished industrial base. (Batteries? I’m not holding my breath.)
Dunkelcobblers Redux
Most people across the UK and Europe will know that over recent days (end of November through 03 December) the wind has been most uncooperative while at the same time temperatures have plummeted and there’s been snow over wide areas further reducing Solar PV’s output. Updating one of the charts (Figure 4A) in my Dunkelcobblers post, we can see the cumulative effect on GB power.
[rev 1] Figure 5C: 13 Nov to 04 Dec 2023
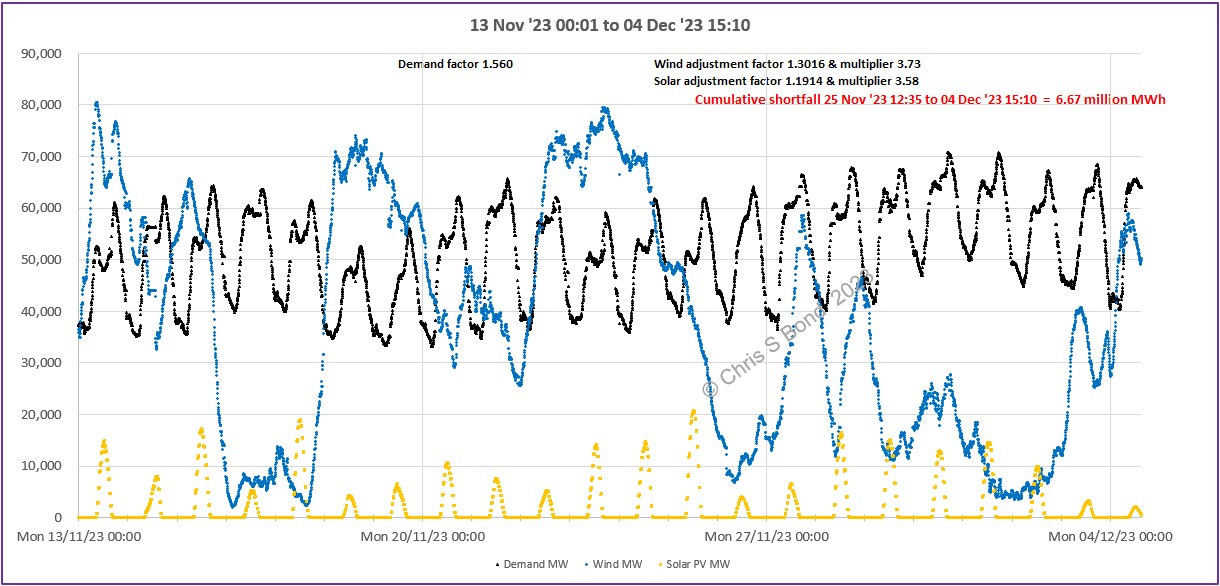
If we were to implement the Labour ‘Mission’ to “Switch on Great British Energy” and if the weather was like this year’s through 2030, this last week would have been fairly disastrous. All that extra Wind and Solar PV would have provided something like 7 million MWh too little electricity over a continuous 8-day period. (Hello again, Royal Society!)
Hydrogen has abysmal round-trip efficiency if it’s used to fire a power station to generate electricity. So that [rev 1] 45 million MWh of surplus energy we managed to capture as ‘green’ hydrogen with all our 20,000 MW of electrolyser plants? That would be largely gone given [rev 1] three or four lulls like we’ve just had.
But Interconnectors!
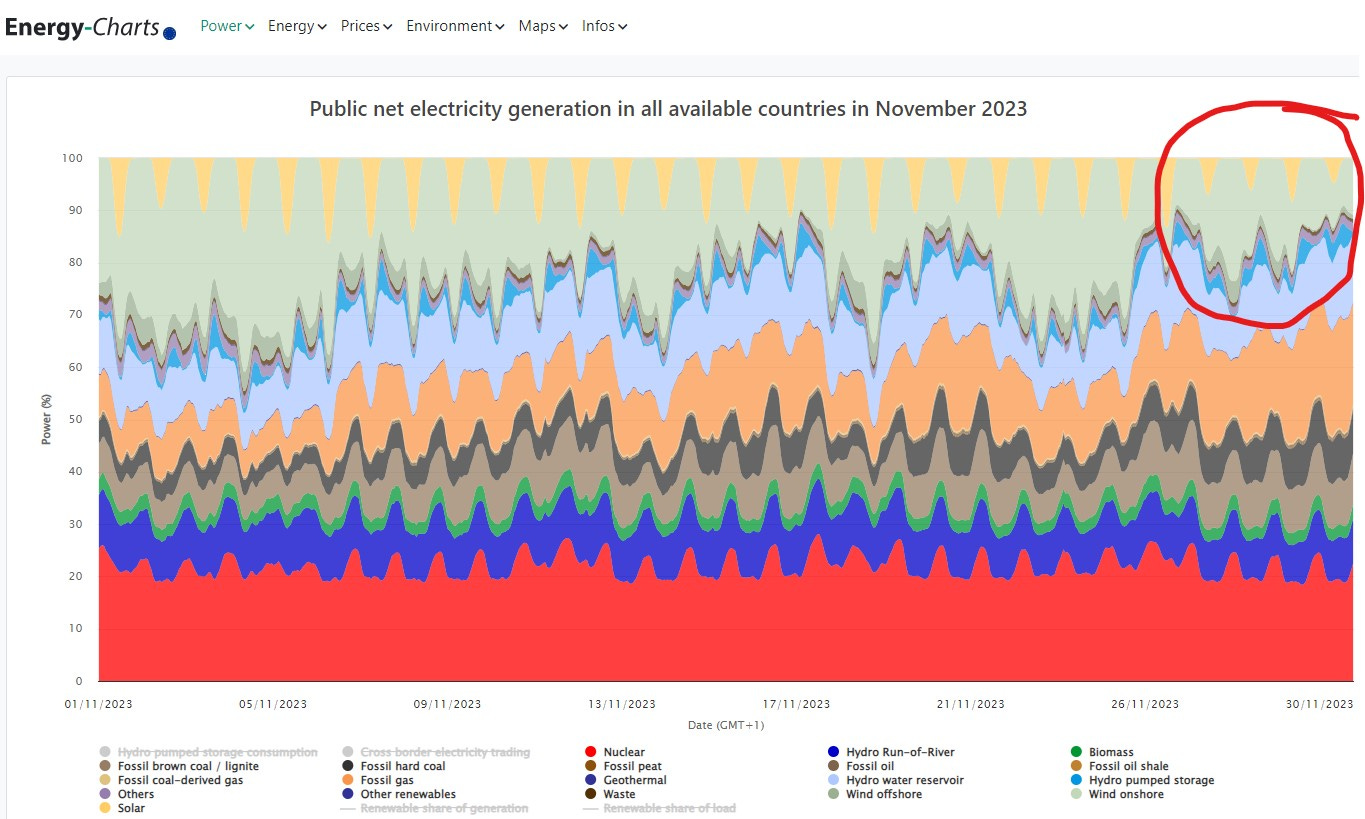
Much of Europe has been having similar low winds (and of course relatively Solar PV) at the same time as us in the UK. Look at the ENTSO chart for percent type of generation for all Europe, below. The pale green Wind onshore dropped to around 10% for those last several days. Everyone is going to want good low-carbon power in the future: we cannot rely on getting it from France’s nuclear fleet and Scandinavia’s hydro fleet forever.
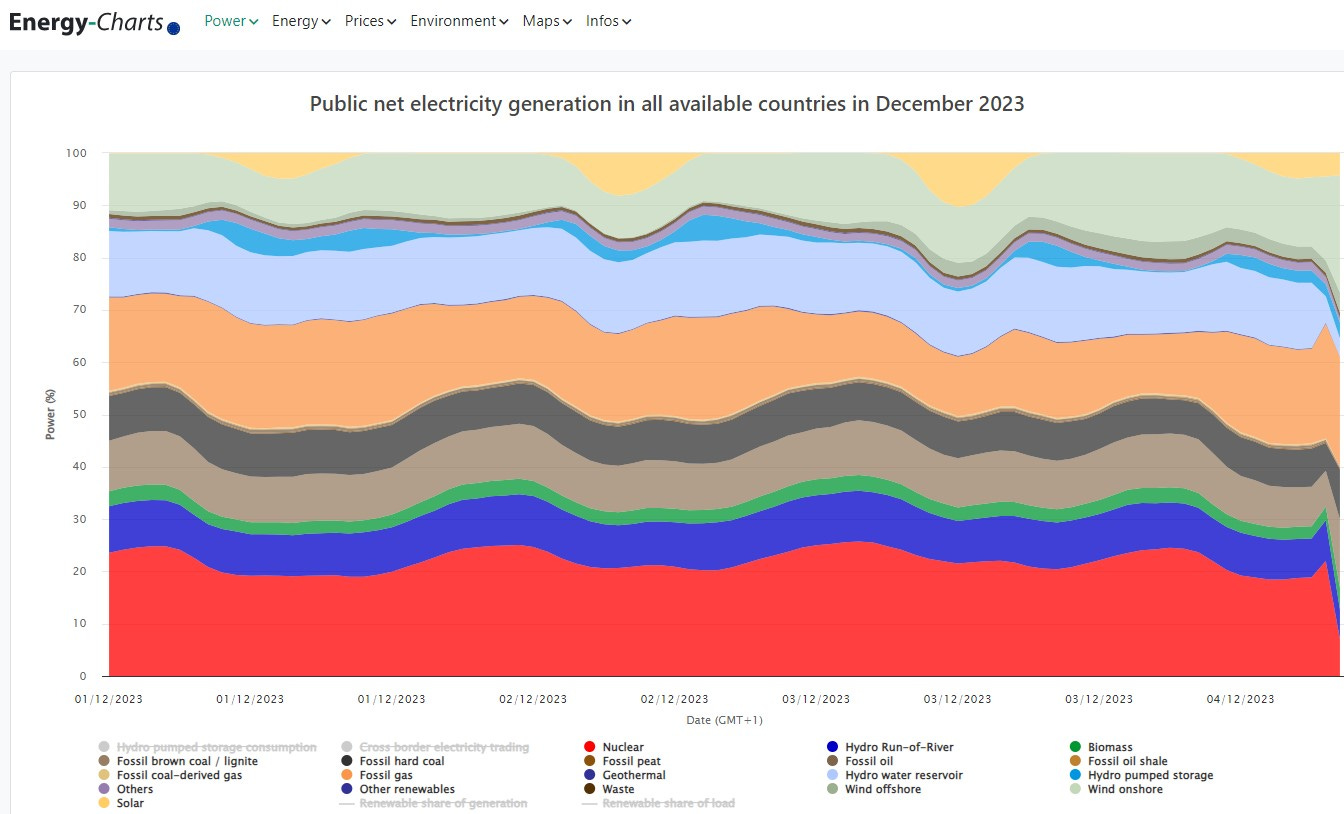
[rev 1] adding the ENTSO chart for the first few days of December 2023.
The lull affecting GB Wind was spread across much of Europe, and the Solar PV contribution was similarly depressed.
Great article starkly shows how flawed Labours mission is although i suspect they will recalibrate it and say their assumption on what the Torys would deliver has not been realised. The other massive flaw with their mission is that it requires a massive reconfiguration of the National Grid with huge amount of new infrastructure needed. Even with the massive build out of the grid in the 50/60's nothing was achieved on the scale now needed. Also in those days it was pretty much 100% supplied by British manufacturers today we massively rely upon imports from our old friends in Europe. And also as you say every country is jumping on this bandwagon so supply chains are going to be squeezed which will drive up prices and elongate deliveries.
What absolutely must happen, unlike coal, is gas has to be kept as prime source of generation for at least another ten years and we need to have robust supply arrangements in place for LNG as well as Norwegian gas.
Another very good analysis.
If I take the weighted average AR3 CfD of the fixed offshore Dogger Bank as £40.96/MWhr at 2012 prices, and the building cost of this 3.6 GW as £9bn according to an October article in the Guardian (9/10) then, if building costs are proportional to the CfD price, which is now £73/MWhr at 2012 prices (AR6), I calculate the cost to build the additional 41 GW of fixed offshore wind alone will be £250bn at 2023 prices.
This figure of course does not include the cost to build the extra onshore wind and solar capacities, nor the floating offshore wind, nor the National Grid and local grid upgrades, nor the CCUS, nor the electrolysers, storage facilities and generators for long-term electricity storage using hydrogen, nor the costs of additional electrification…..
I somehow don’t think the £28bn/year by the end of the next Parliament that Labour has promised to spend is going to cover it.
And what will be the price of our electricity???