Dunkelflaute? Dunkelcobblers!
In this part of the world troublesome Wind lulls happen so frequently they don't deserve a fancy name

Introduction
Today’s topic is Dunkelflaute, which according to an FT article [archive] is “a German term now widely used in the renewable energy sector, is a reasonably regular winter occurrence in northern Europe, accounting for between 150 and 300 hours, according to a recent climatology study.” The term ‘dunkelflaute’ seems to have been widely adopted, and this particular study’s findings seem to be informing debate.
Hmmm, in that study “The underlying data… were generated by the Renewables.ninja tool.” Call me old-fashioned but, rather than rely on opaque output from a ‘ninja’ tool, I prefer to look at charts plotted using real recent publicly-available data. Then I can make my own assessment whether ‘renewables’ can keep the lights on and society functioning 60/24/365 as the proposed energy transition / ‘decarbonisation’ progresses.
Figure A: Study Fig 3 & Climatologists’ Definition of Dunkelflaute

I have doubts that the study’s chosen definition of ‘dunkelflaute’: “… if wind and solar CFs both fall below a specific threshold of 20% during a particular 60 min period, which means both wind and PV power production being lower than 20% of their respective capacities” is sufficient to judge whether the lights will stay on.
I’m boggled at the continuation: “It should be noted that although it can be expected that there is no or little solar power production after sunset and before sunrise, calm nighttime conditions are of significance from the point of view of system balancing, and therefore are included in this climatological analysis.” It takes a group of climatologists to notice it gets dark at night! And that this might affect ‘system balancing’, otherwise known as ‘the lights going out’.
Ever since I began my exploration of ‘renewables’ with my first substack post “UK plc Power Decarbonisation” I’ve been trying to answer the simple question: can we keep the lights on simply by adding more and more Wind and Solar *capacity* per HM Gov’s ‘plan’? Increasingly I’ve found the data for Great Britain (herein) and for the lower 48 states of the US and for ultra-sunny places like California or Texas or Australia says the answer is ‘NO’ absent immense electrical energy storage.
Without immense electrical energy storage, in order to maintain grid frequency control every grid operator has to constrain more and more ‘free’ power generated on good1 days. While on bad days, without immense electrical energy storage that was previously charged during good days, any grid operator has to ask controllable dispatchable fossil generation plants to increase generation. Or hope that the capacity of interconnectors is sufficient and the parties at the other ends of the interconnector can spare some of their power to import sufficient to make up for the shortfall.
Immense electrical energy storage on the scale required - tens of millions of MWh - does not exist.
I continue to boggle that HM Gov’s ‘plan’ (enshrined in law) mandates completion of GB’s ‘decarbonisation’ in a relatively short fixed time-scale despite this key enabling technology not having been developed let alone commercialised at scale.
The Royal Society’s report “Large-scale electricity storage” Issued September 2023 suggests 60-100 TWh (60,000,000 to 100,000,000 MWh) of hydrogen storage will be needed… yet that estimate is based on a flawed evaluation of how many days per year we experience ‘wind drought’. Compare what’s shown in their Table 1 with the charts from just four years of GB data that follow.
Table 1: Weather Stress Events (per the Royal Society) - WRONG
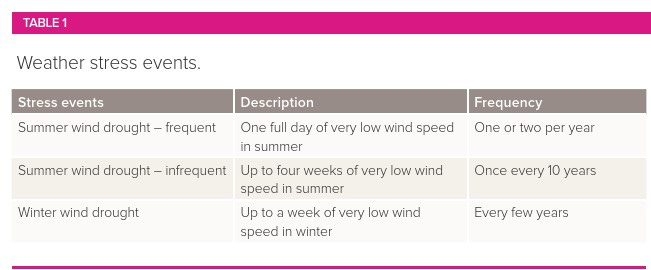
Ah, but I see the Royal Society also made use of Renewables.ninja.
Instead of the nebulous ninja output let’s have a look at real data.
GridWatch is the excellent resource I continue to use, with its data recorded every 5 minutes = 1/12th hour for GB power flows - Demand, generation sources and interconnectors. Summing e.g. Wind powers (MW) for a year then multiplying by 1/12 you get the total in MWh. As before for GB data, I’ve adjusted GridWatch Wind and Solar PV energy flows by reference to the Digest of UK Energy Statistics (DUKES).2
Figure 1: Whole Year 2020
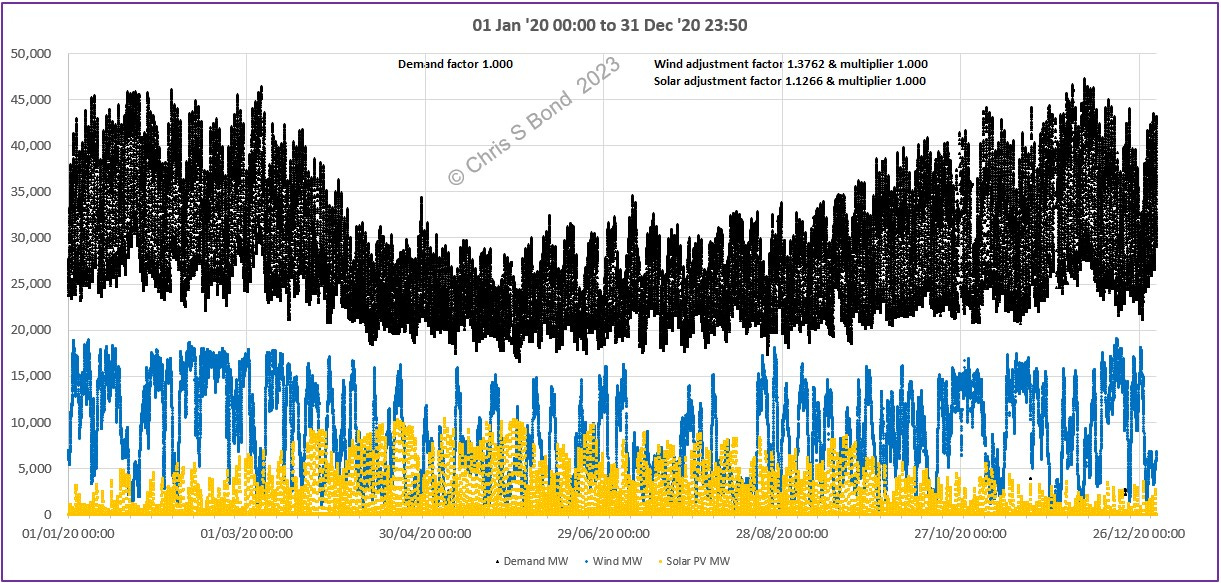
In this part of the globe (50-58° North), Demand is generally highest during the cold months of the year; Solar PV output across the year is like a brontosaurus; and Wind is less generally predictable. As I understand it, HM Gov’s ‘plan’ is to increase Wind *capacity* to 50 GW offshore and ‘as much as we can’ onshore, and to carry on building Solar PV *capacity* because lots of people have loudly shouted that it’s really, really cheap. (As you can see from Figure 1A, Solar PV provides little in winter and anyway it’s zero every long night, which is why I’m not a fan of Solar PV.)
Looking in detail at some of the many, many intervals of low Wind:
Figure 1A: 23 Nov to 31 Dec 2020
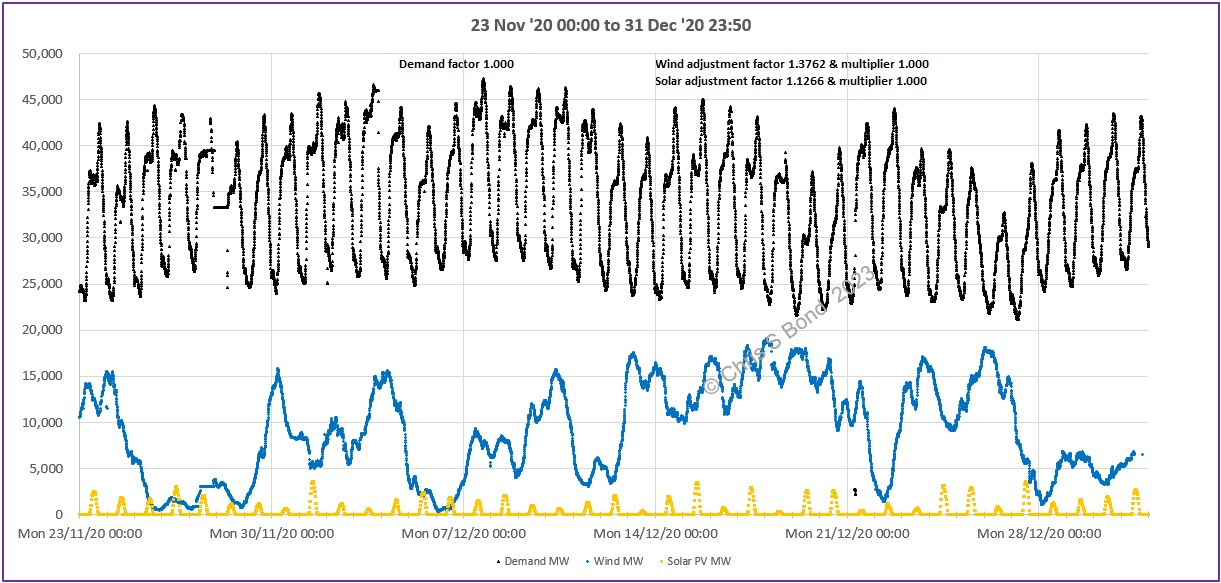
According to DUKES 6.2, by the end of 2020 we had a total of about 24½ GW in total of Wind *capacity*. The ‘plan’ would provide something like three times as much. So eyeballing the above Wind chart, all the time Wind is less than about 10,000 MW, three times that would often fail to match Demand and our lights would go out. There’s a 5½-day interval through Mon 30/11/20; another about 5 days from Mon 07/12/20; a 2-day interval around Sat 12/12/20; another day at Wed 23/12/20; and at least 4 days from Mon 28/12/20 at the end of the month. That’s three winter wind droughts in a month, Royal Soc!"
Figure 1B: 06 July to 20 Aug 2020
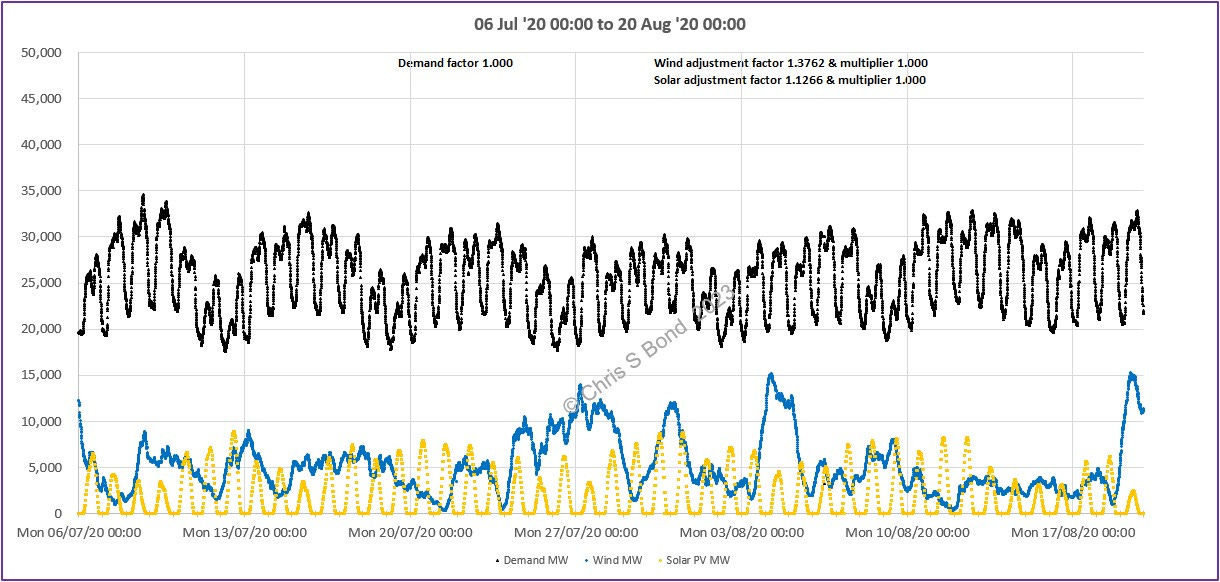
Not ‘dunkel’ in sunny July and August. With lower summer Demand I’ve set the eyeball to 5,000 MW Wind or below. Several intervals of a day or two early on, then about 8 days continuously from Mon 10/08/20. When relying on Wind + Solar PV might work in the daytimes but very unlikely to do so at night.
Figure 1C: 03 Apr to 23 May 2020
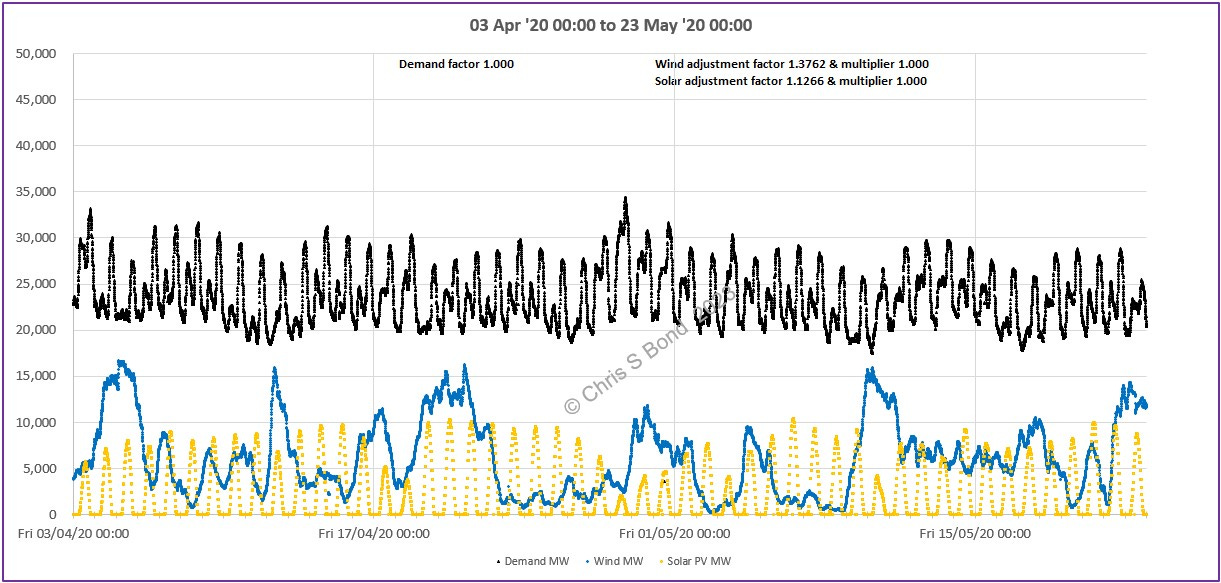
Again, quite a few intervals when relying on Wind + Solar PV might work in the daytimes but very unlikely to do so at night.
Figure 2: Whole Year 2021

Figure 2A: 11 Dec to 31 Dec 2021
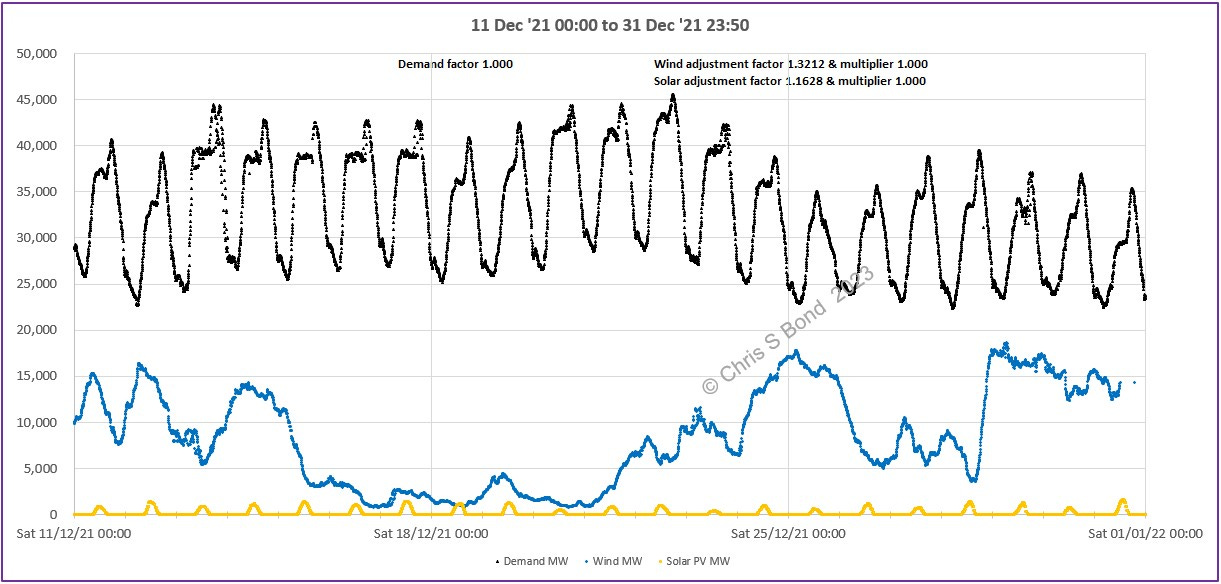
Figure 2B: 12 Aug to 22 Sep 2021
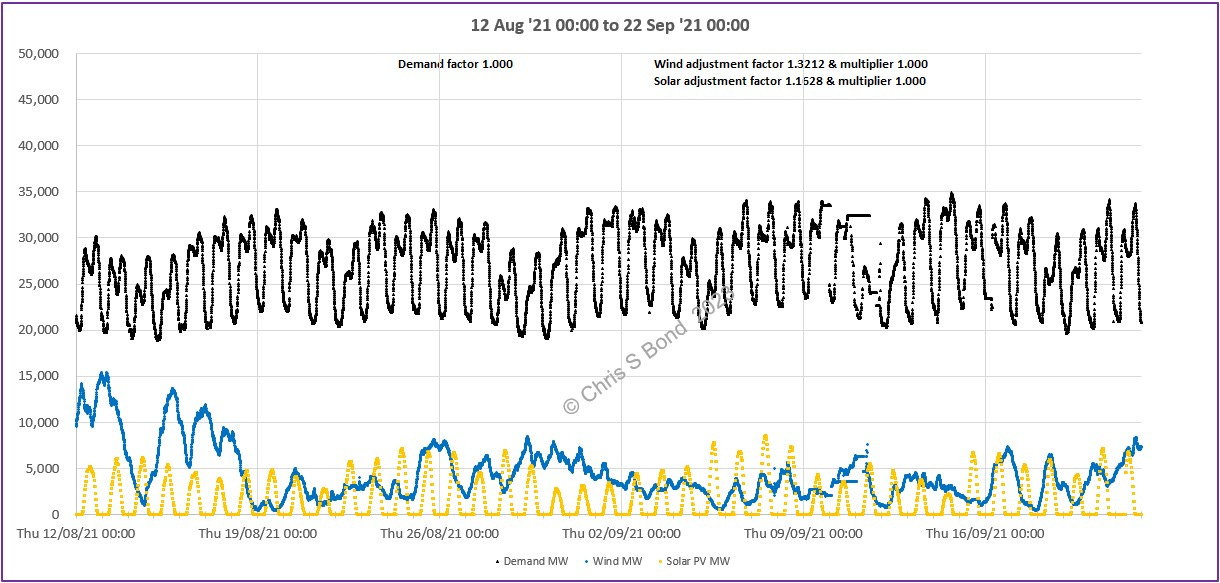
Figure 2C: 08 Apr to 20 May 2021
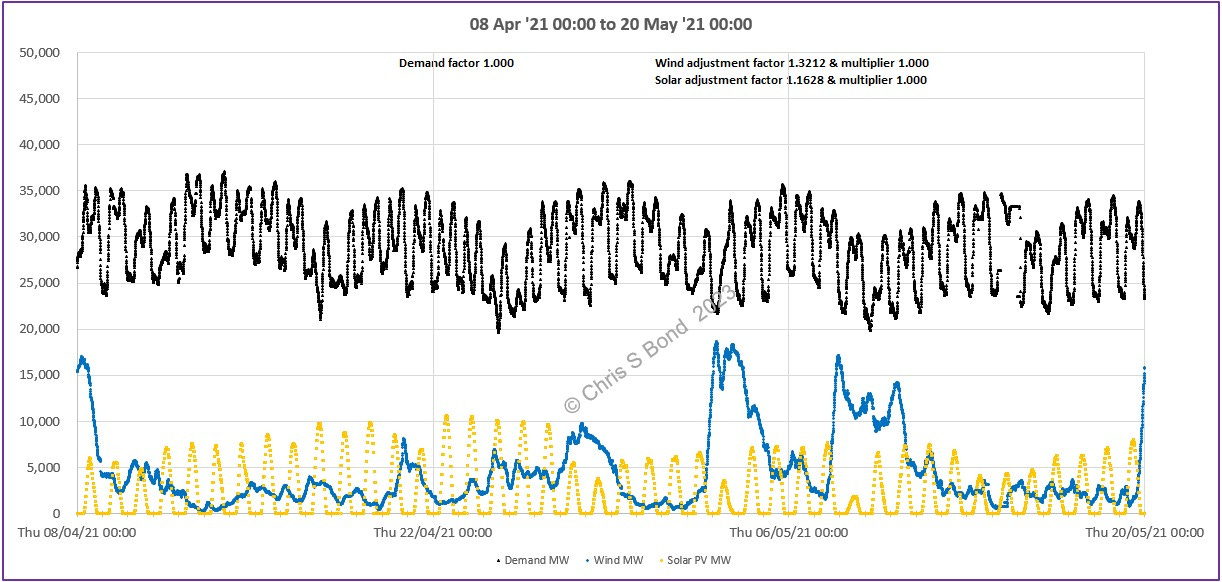
Figure 3: Whole Year 2022
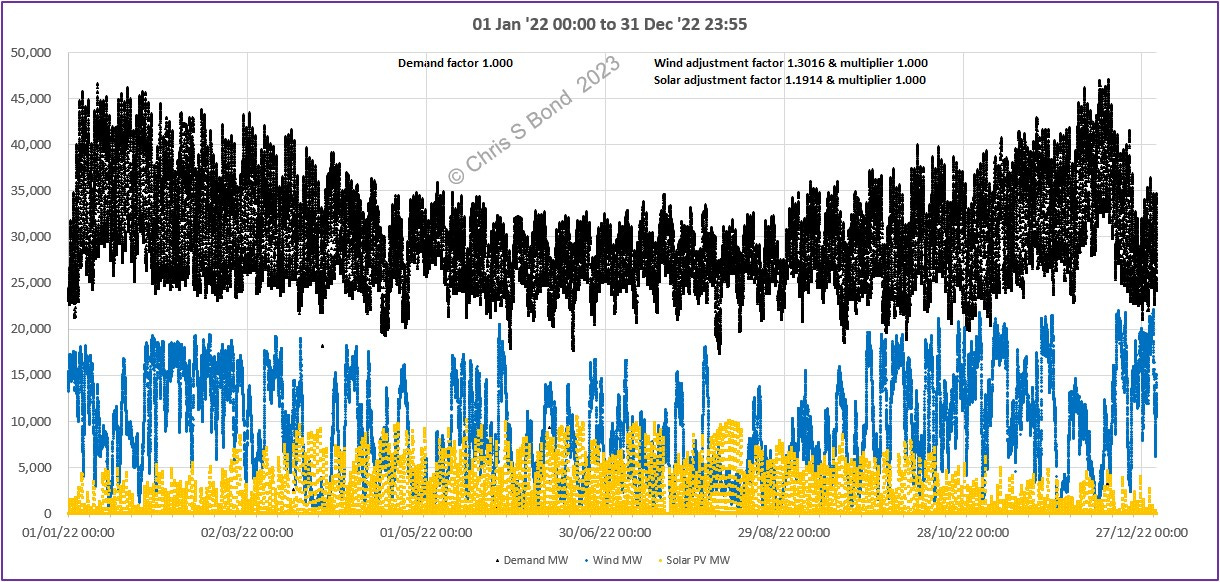
Figure 3A: 23 Nov to 21 Dec 2022
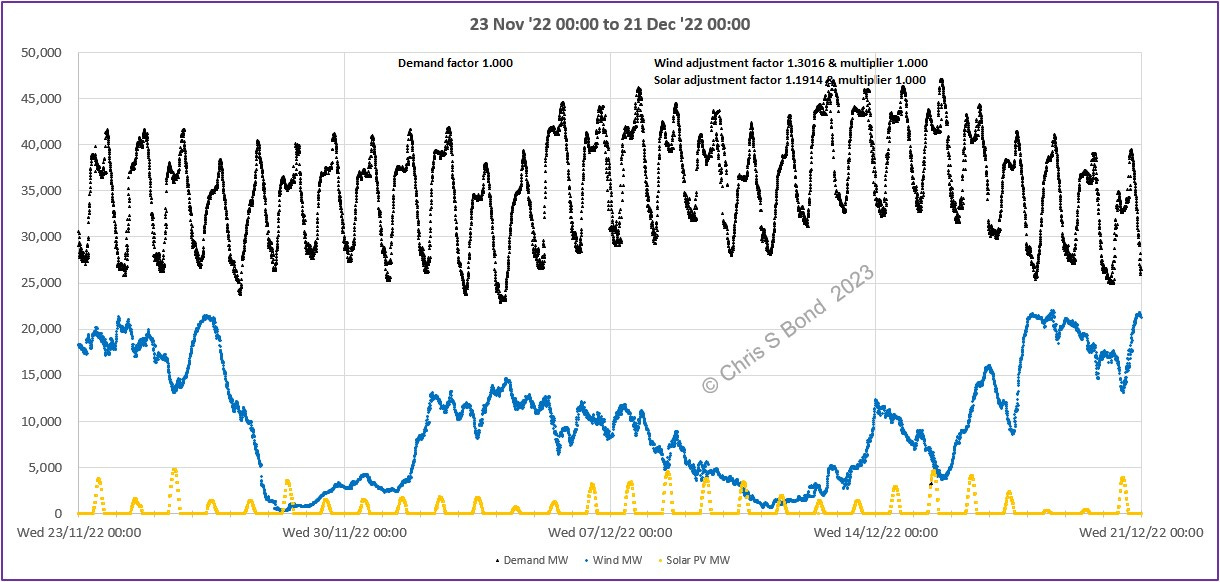
Figure 3B: 24 Jul to 04 Sep 2022
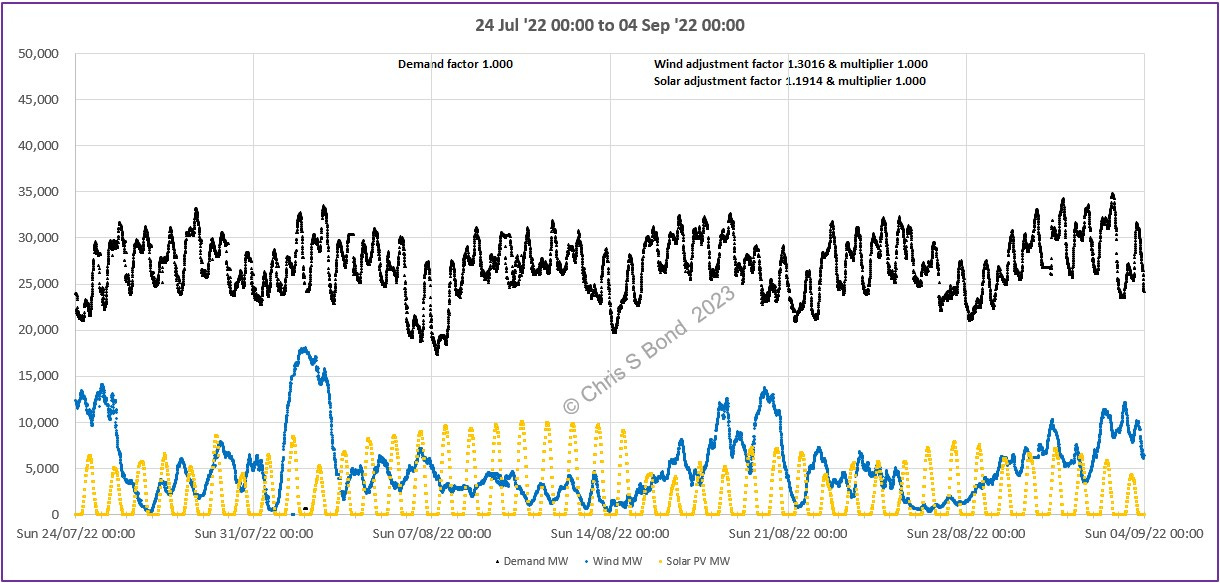
Figure 3C: 22 Feb to 10 May 2022
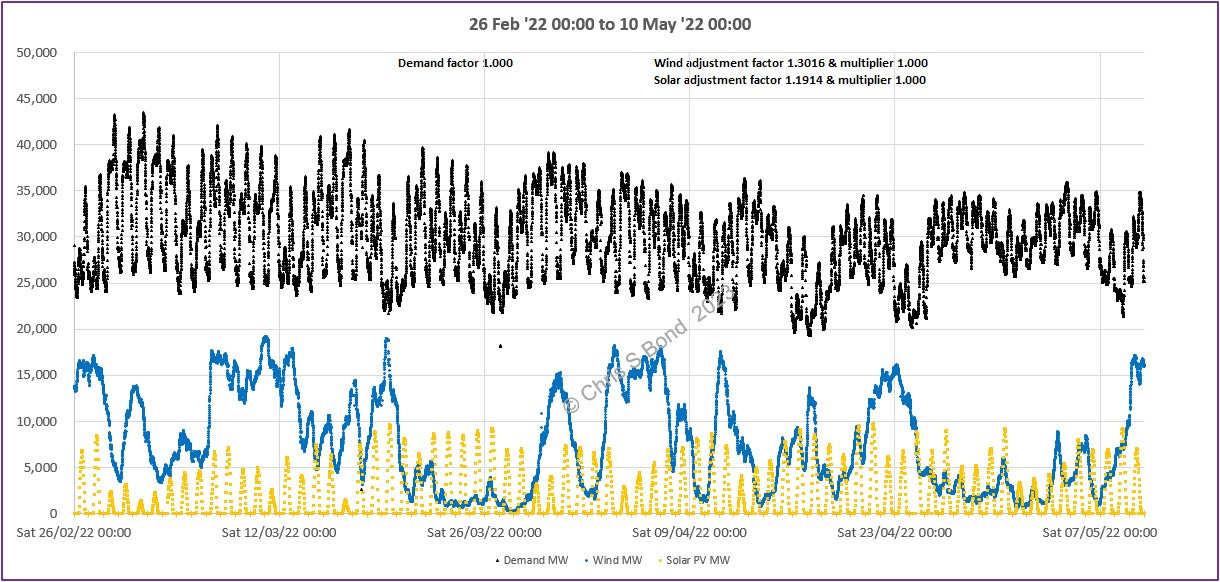
Figure 4: ~90% of Year 2023
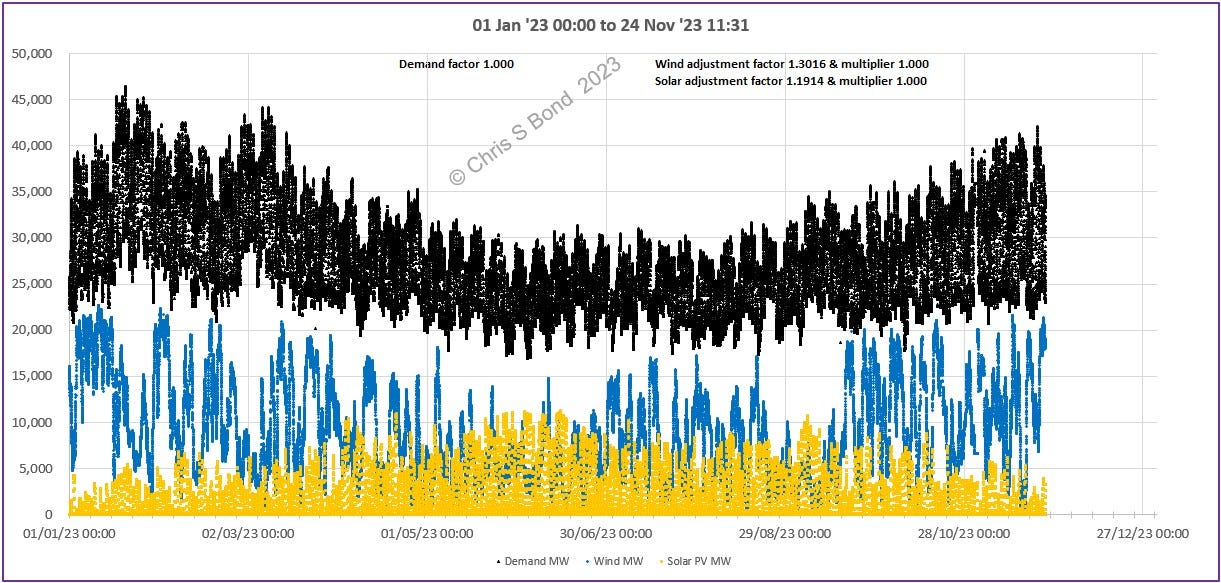
Figure 4A: 13 Nov to 20 Nov 2023
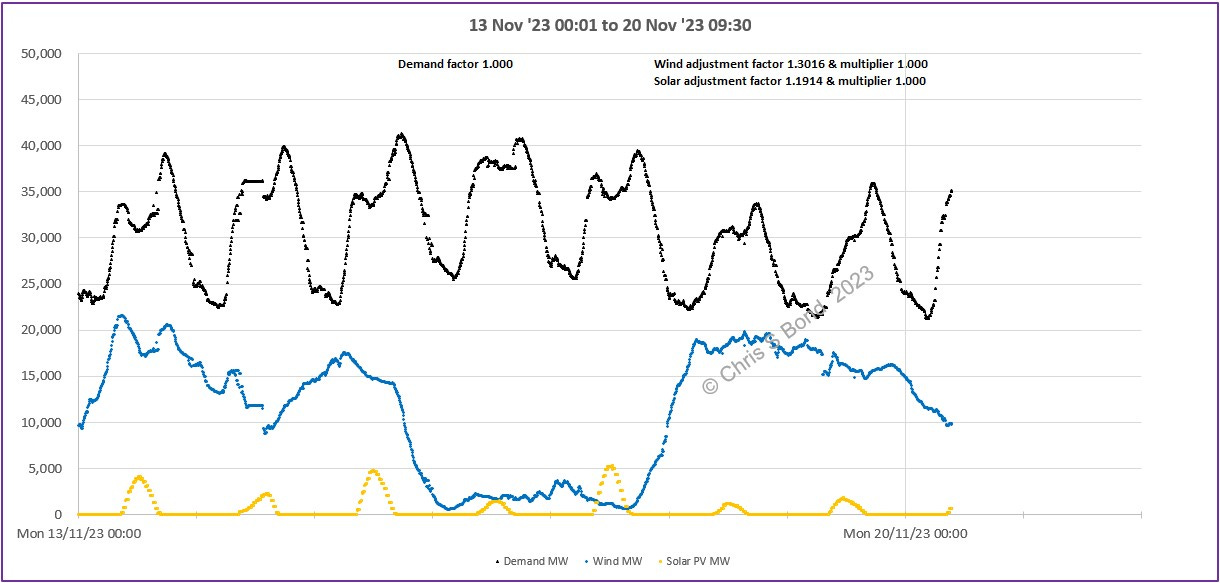
Figure 4B: 18 Aug to 19 Sep 2023
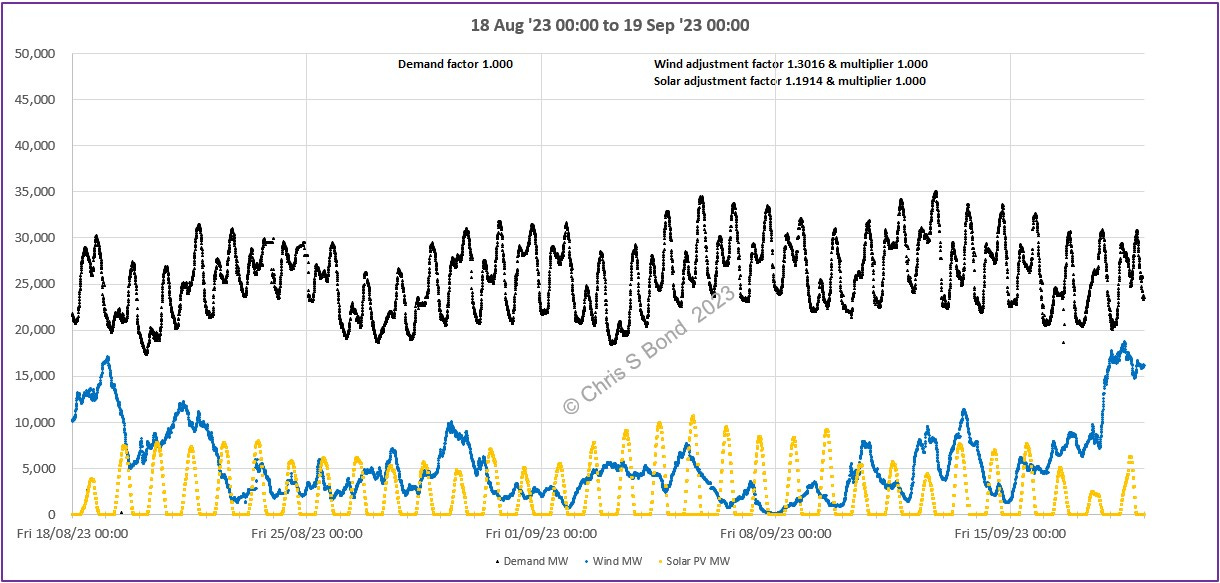
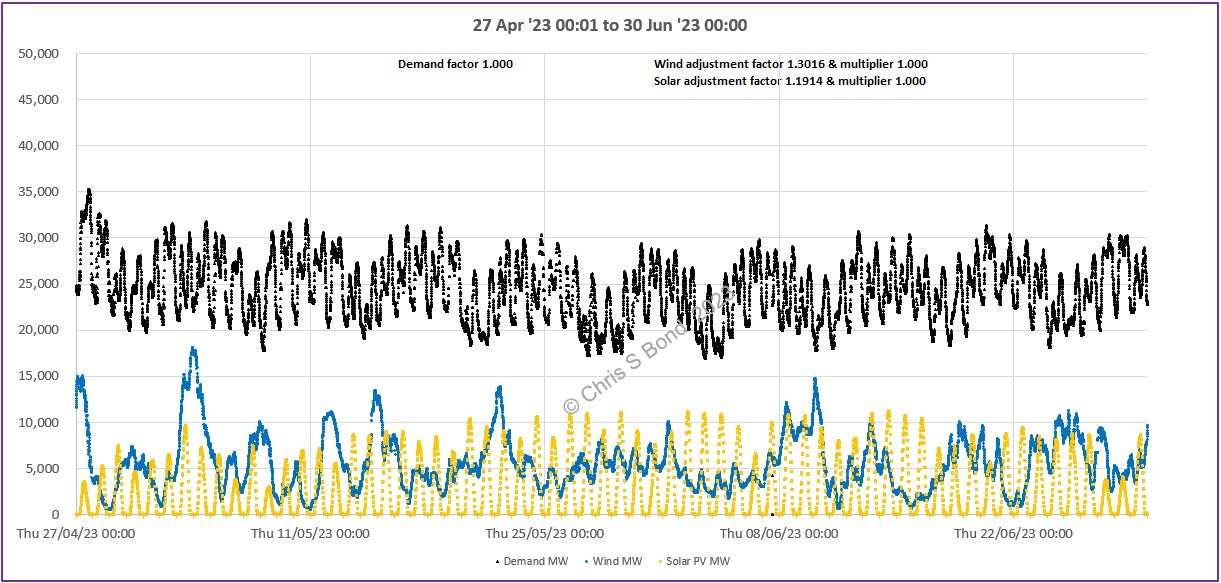
Figure 4C: 27 Apr to 30 Jun 2023
Copyright © 2023 Chris S Bond
Disclaimer: Opinions expressed are solely my own.
This material is not peer-reviewed.
I am against #GroupThink.
Your feedback via polite factual comments / reasoned arguments welcome.
‘Good’ days defined as when the wind is blowing nicely. ‘Bad’ days defined as every night and when the wind does not blow much.
DUKES is the HM Gov record of generators and consumers and is updated each July. If one compares the total MWh from Wind derived from GridWatch to DUKES 6.3 total GWh for the relevant year, there is a significant difference. Not surprising: GridWatch states ref: its Wind record that there’s a further ~30% that is un-metered. Similarly with Solar PV. Therefore in my data-charts I apply adjustment factors to Wind and Solar PV powers.
You can actually get the renewables.ninja data (or at least a version of it) here:
https://www.renewables.ninja/downloads
It does have the virtue of providing long histories, and the methodology ties back the estimates to satellite weather data, with supposedly a correlation to real world data too. More recent years are available if you sign up. The data are given as fraction of capacity generation hourly. It's perhaps a shame that they haven't explicitly published the data used by the Royal Society. I ought to write to Iain Staffell and ask him to do so.
It's important to remember that the Gridwatch data only includes the transmission connected windfarms that are visible to the grid control room (live "metered"), so it leaves out quite a bit of onshore wind that is connected at the distribution level, plus some small offshore projects. A rising complication now is from curtailment - some paid for, and some simply when prices are negative and the subsidies don't apply to some of the CFD holders and those who have yet to commence their CFD.
However, the older data is less affected, and should allow comparison between them. A very useful technique is to look at the cumulative sum of each series relative to its mean. By subtracting the series mean from all points and cumulating you get a clear idea of the behaviour, and whether the modelled data really does look like the actual data when you chart them. I know when I did this for Andrew Blakers' study on Australia I was easily able to show that his wind modelling was entirely phony. Periods of Dunkelflaute and runs of windy weather show up as negative and positive slopes respectively. Seasonal variations will result in significant cumulative deviations.
This comment may be a bit late to the table as they! I was looking back through you posts when I came across this at at a time when I was reviewing a paper about European Dunkelflaute. The paper used 36 historical years of data and identified that winter 1995/6 was the worst case scenario and it also affected the UK. The paper made the following statements:
1/ Models must incorporate multiple weather years (not just average or recent years) to design resilient systems.
2/ Summer-to-summer modeling horizons are better suited to capture winter Dunkelflaute events that span calendar years.
3/ Energy system models and policy must account for rare but extreme weather events to ensure robustness.
For more information see my document https://bit.ly/UKEA-Coping-with-the-Dunkelflaute
This prompted me to look for wind droughts that affected the UK. The have been three since 2010/11. The worst was the Big Freeze in 2010/11 where for 42 continuous days the daily load factor reported from Dukes averaged ~6.1% in contrast to the typical ~23% at the time. For more information see https://docs.google.com/document/d/1nvEfwOm_3GmL_G_fs3P3-210kLRy4d6kCIPBtSEo3CU/edit?usp=sharing
I wonder whether you would care, for fun, to analyse the Big Freeze in the same way that you have assessed period in 2020 and 2021.