

Texas Reality
As I did for California recently, I look at real data from *the last three years* to see what would be required to ‘decarbonise’ power generation in the Lone Star State

Notes:
In this post I explain my thinking and methodology in less detail - see my California Reality post for more explanation. This analysis again uses a publicly-available data-set from the US Energy Information Agency (EIA) which anyone can download. If you’re reasonably adept with Excel you should be able to repeat what I’ve done here.
In this post I also discover Substack’s ‘Gallery View’ of images: very useful for all the charts I use, I hope the results are sufficiently legible as well as informative.
I’m very happy to receive technical feedback on any aspect of this analysis…
Are there errors in my approach? Can you replicate my results?
Introduction
When comparing ‘decarbonisation’ efforts in California (CA) and Texas (TEX) I think it’s a case of same same but different. CA has a surfeit of Solar; TEX has a surfeit of Wind. But neither have anywhere close to enough of either to consistently keep the lights on 60/24/365.
I previously extrapolated to future energy generation in the UK . Then I completed a similar extrapolation for California. For this analysis of how the Texas power grid might be ‘decarbonised’ I returned to the EIA’s excellent data source. Specifically I downloaded file “Region_TEX.xlsx”1 at 17:00 BST on 25 April 2024. It doesn’t matter that the file is over a week old - I’m looking at the *last 3 years* of real power flows as recorded by the EIA.
This particular download of the EIA file contains (on the ¦Published Daily Data¦ tab) complete daily sets of data beginning 2018-July-02 and ending 2024-April-22, i.e. 2,122 days. An excellent resource: however, I prefer to focus on the most-recent three years because then my extrapolations are from a base with very significant *capacities* and recorded real powers supplied by ‘renewable’ generation. This makes the extrapolations somewhat less tenuous.
The ¦Daily Charts¦ tab of the EIA file has a collection of pre-configured charts - the top five of which are shown in Figure 1 - to display the selected year’s data.
Figure 1: EIA Charts (TEX) 2023-04-23 to 2024-04-22
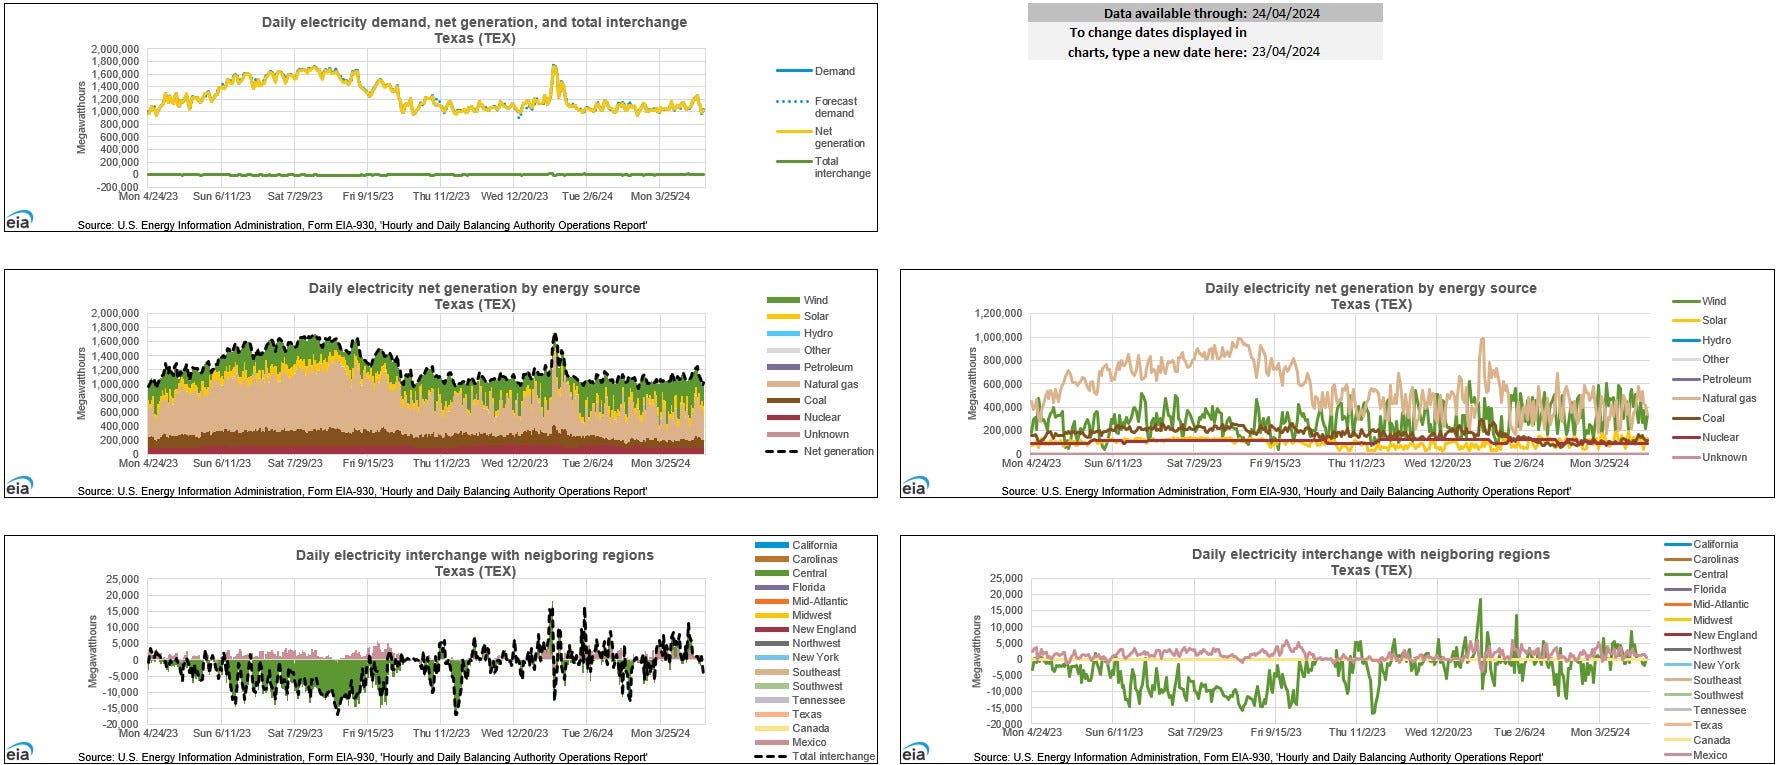
By simply summing the recorded daily MWh in the relevant columns on the ¦Daily Charts¦ tab, for this year ending April 22 2024 we can find:
- Total Demand was 454,101,048 MWh, versus summed Wind 105,869,488 MWh and summed Solar 35,631,635 MWh.
That is, the summed recorded values of Wind + Solar provided 31.2% of Demand across that 365 days.
- Total interchange with neighbouring grids was -832,809 MWh i.e. imported
but this is a fairly trivial quantity of power compared with Demand. Maximum and Minimum interchange were 16,366 MWh and -17,029 MWh respectively, again emphasising that interchange is fairly trivial for TEX.
- Total Nuclear + Hydro was 40,591,041 MWh;
(max daily: 125,111 MWh; min daily: 88,749 MWh)
For my analysis I treat Nuclear and [existing] Hydro as being carbon-free and therefore to be retained in the Future TEX grid. Thus I leave each data-set’s Nuclear MWh and Hydro MWh as recorded by the IEA.
Then for every set of EIA daily data I calculate:
[TEX In-State Net Demand] = [Demand] - [Interchange] - [Nuclear + Hydro] MWh.
Taking as an example the data for Apr 15, 2024:
D = 1,169,755 MWh, TI = 1,894 MWh, N + H = 90,313 MWh;
Hence in-state TEX Demand = [D - TI -(NUC+WAT)]
= 1,169,755 - 1,894 - 90,313 = 1,077,548 MWh.
And so on.
This is the net Demand currently satisfied by burning fossil fuels and hence to be replaced by non-fossil generation if one is going to ‘decarbonise’ the TEX grid.
Possibly worth noting that TEX net Demand is about double the in-state CA Demand at about the same time of year.
Curtailment
Every power grid has to curtail surplus power production to maintain a stable grid frequency within tight tolerances: in the USA I think this is 60 Hz ± ¼ Hz (Hz = cycles per second). This requirement to curtail in future TEX as more and more ‘renewable’ generation is added will remain true UNLESS there is reliable AND flexible AND additional Demand connected to the grid 60/24/365 able to instantaneously absorb that surplus. Similarly in the reverse direction: to benefit from stored energy in reducing shortfalls, the storage has to be connected when the grid instantaneously needs it. I discuss energy storage and my approach to it below.
I have just read this article providing an evaluation of ‘green hydrogen’ production from surplus Wind + Solar by Stephen Wilson (Adjunct Professor at the University of Queensland, Australia). The current crop of politicians in charge in Australia’s Government likes to believe that the continent is so blessed with Solar (and to a lesser extent Wind) that it can become a ‘green energy exporting superpower’. Prof. Wilson disagrees and has the analysis to support that stance.
His article includes this text: “It is more economic to overbuild the wind and solar and curtail it than to store all the power output” [my emphasis]. “A rigorous analysis underpinned by an engineering flow sheet reveals that ‘storage’ to smooth the wind to allow the electrolysers to run 24x365 is not economic. Whether using batteries or building larger hydrogen tanks and using hydrogen to generate electricity to run electrolysers to make hydrogen, the basic problem remains.”
I assume that lower-cost forms of long duration energy storage (LDES) may tip that evaluation, particularly if stored energy was used directly not via the highly-complex hydrogen route. So I’ll run this Texas analysis two ways to see what results I get:
1. Assuming use of LDES as I did for California;
2. Assuming more-massive over-building of Wind & Solar *capacities* so as to satisfy** Demand throughout the year with massive curtailment of surplus generation.
** ‘Satisfy’ may be a slightly flexible concept, we’ll see how it goes
Typical Texas Curtailment
The EIA reported in July 2023:
“As Texas wind and solar capacity increase, energy curtailments are also likely to rise”
…
“In 2022, the Electric Reliability Council of Texas (ERCOT), the grid manager for most of Texas, curtailed 5% of its total available wind generation and 9% of total available utility-scale solar generation.” [my emphasis]
I have used these fixed percentages to estimate uncurtailed TEX Wind and Solar each day across the last three years. Of course this is an approximation.
For example for the data of Apr 15, 2024:
recorded 82,620 MWh Solar; ∴ uncurtailed Solar ≈ 82,620/(100%-9%) ~ 90,791 MWh;
recorded 510,421 MWh Wind; ∴ uncurtailed Wind ≈ 510,421/(100%-5%) ~ 537,285 MWh.
I then extrapolate to future uncurtailed TEX Wind and future uncurtailed Solar via simple multipliers for each.
Current Energy Balances over the Last Three Years
If Texas is to become ‘decarbonised’, then
∑ [uncurtailed Wind + uncurtailed Solar] = ∑ [TEX Demand - [Nuclear + Hydro]]
Looking at each of the most-recent three years ending each April 22.
Year to Apr 22, 2024:
∑ [uncurtailed Wind + uncurtailed Solar] = 111,441,566 + 39,155,643 MWh
∑ [TEX Demand - [Nuclear + Hydro]] = 414,342,816 MWh
Shortfall across the 365 days: -263,745,607 MWh
Year to Apr 22, 2023:
∑ [uncurtailed Wind + uncurtailed Solar] = 117,092,898 + 27,155,984 MWh
∑ [TEX Demand - [Nuclear + Hydro]] = 390,262,501 MWh
Shortfall across the 365 days: -246,013,620 MWh
Year to Apr 22, 2022:
∑ [uncurtailed Wind + uncurtailed Solar] = 106,552,347 + 19,727,669 MWh
∑ [TEX Demand - [Nuclear + Hydro]] = 362,400,862 MWh
Shortfall across the 365 days: -236,120,845 MWh
Overall, TEX Demand looks to be growing about as fast as [uncurtailed Wind + uncurtailed Solar].
For an indication of future TEX Demand, this was on LinkedIn very recently:
“This month, ERCOT released a staggering projection: the agency says 62 gigawatts of new demand could plug into Texas’ grid by 2030.” The corresponding chart from Doug Lewin’s substack is included at Figure 2:
Figure 2: Possible Growth in TEX Demand:
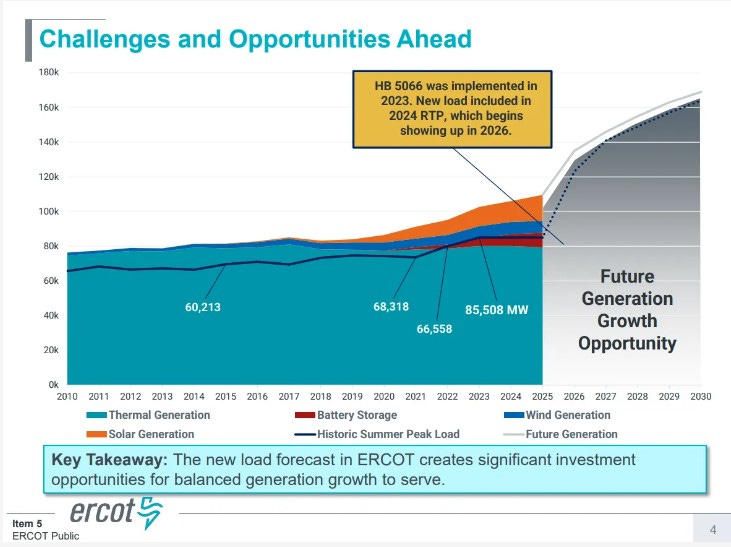
From Figure 2, the projected peak by 2030 is around 165,000 MW. That is around 93% greater than the 85,508 MW shown on the chart in 2023.
Therefore I use a Demand Multiplier = 1.93 in this analysis, and keep it simple by using the same value 1.93 across all three years of real data.
I also simplify my analysis by using a constant Solar Multiplier = 2.0 across all three years of real data. Solar is significantly less dominant than Wind in TEX and I’ve seen no indication this will change. (Maybe this represents acceptance by ERCOT that more and more unbuffered Solar causes increasing problems for the rest of the TEX power grid.)
Having set two of the main variables at constant values I then solve for what Wind Multiplier W do I need in each year to achieve overall energy balance:
Future Year Based on data to Apr 22, 2024:
Future ∑ [TEX Demand - [Nuclear + Hydro]] = 1.93 x 414,342,816 MWh
= 799,681,635 MWh = W x ∑ [uncurtailed Wind] + 2.0 x ∑ [uncurtailed Solar]
Rearranging and solving for W:
799,681,635 MWh - 2.0 x 39,155,643 MWh = W x 111,441,566 MWh
721,370,349 / 111,441,566 = W = 6.47 say W = 6.5
Then Shortfall across the 365 days is 2,999,832 MWh i.e. negligible for my purpose.
Similarly for Future Year Based on data to Apr 22, 2023:
With W’ = 6.0, Shortfall across the 365 days is 3,662,727 MWh i.e. negligible.
And similarly for Future Year Based on data to Apr 22, 2022:
With W’’ = 6.2, Shortfall across the 365 days is 646,228 MWh i.e. negligible.
To summarise up to this point:
IF TEX Demand rises by a factor 1.93;
AND TEX Solar *capacity* rises by a factor 2.0;
THEN simply to achieve [Wind’ + Solar’] = Demand’
across each whole year
REQUIRES Wind *capacity* to be increased by 6 to 6½ times.
Future Texas with LDES
For the ‘with energy storage’ branch of this analysis I follow the approach suggested by the United States Department of Energy (DOE) regarding long-duration energy storage (LDES). I make the same assumptions in this post as I did for CA:
- many (hundreds / thousands) of LDES facilities using a variety of technologies would have to be installed across Texas summing to a total Power capacity of ‘enough’ to be able to capture surplus power (subject to storage capacity and other constraints explained below);
- the round-trip efficiency (RTE) of that fleet of LDES facilities will be 60% on average. That means, for each 10 MWh of ‘renewable’ electricity captured by future TEX LDES, we could get back 6 MWh. *If* all other physical constraints e.g. grid capacity could simultaneously be satisfied.
Figure 3: Future TEX Extrapolated, Three Successive Years, Uncurtailed:


It is clear from Figure 3 that in parts of each year, future Wind alone is greater than future Demand, while future Solar offers little benefit for all the trouble it causes. In other parts of each year, future Wind + future Solar fall far short of meeting future Demand. We can plot the [potential] Surplus versus Shortfall charts as in Figure 4.
Grids have to be balanced, Supply = Demand 60/24/365, so it looks like either immense quantities of energy storage will also be needed in addition to these massive additions to the Wind and Solar fleets; or there will be immense quantities of curtailment.
Figure 4: Future TEX Extrapolated, Three Successive Years, Net Energy:


The red charts represents all the times when the hugely increased [Wind + Solar] is less than the future Demand; the grey charts show all the [potential] surplus that has to be curtailed; all with zero LDES capacity.
Figure 5: … to 2024-04-22, Future TEX, Net Energy with 10 million MWh, 20 million MWh, and 50 million MWh LDES:


Left image of Figure 5:
If TEX were able to incorporate a truly immense 10,000,000 MWh of LDES capacity into its power system…

That is, 3,000 times California’s biggest battery, or 333 million EVs dedicated to supporting the TEX grid, or 1,100 of the UK’s Dinorwyg pumped power station, or 40,000 liquid air energy storage (LAES) systems… or who knows how many compressed air energy storage (CAES) facilities… or some combination of some of the above…
Then for the data year-ending 2024-04-22 the quantity of shortfall would be reduced by around 45 million MWh. This is about 67% of the 67 million MWh reduction in energy curtailed which approximately reflects the RTE of the LDES, but is distorted by the coarseness of the daily data.
Centre image of Figure 5:
Double the scale of the LDES brings less than double the reduction in shortfall, i.e. we yet again see diminishing returns.
Right image of Figure 5:
A colossal 50 Million MWh of LDES brings the shortfall down again, and the ratio of Shortfall to Curtailment is ≈ LDES round trip efficiency = 60%.
Figure 6: … Three Successive Years, Future TEX, 50 million MWh LDES:


Summary: … to 2024-04-22, TEX Future, Varying LDES Capacity:
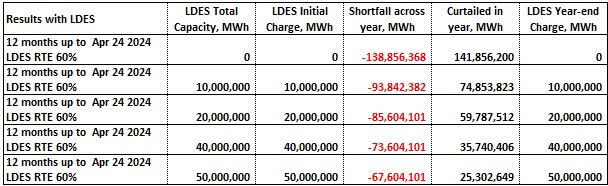
… and very similar results are obtained with 2023 and 2022 years’ data:
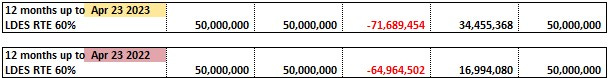
50,000,000 MWh energy storage capacity of mixed LDES would certainly provide all those ‘green jobs’ we keep hearing about…

Future Texas without LDES
For the ‘without energy storage’ branch of this analysis I follow the approach suggested by Stephen Wilson as linked above: “It is more economic to overbuild the wind and solar and curtail it than to store all the power output” [my emphasis].
You can see in the charts of Figure 4 that daily Shortfalls reach ~ -2,000,000 MWh at worst across the three years. What might be considered a “success” in ‘decarbonising’ the Texas power grid?
At the extreme, what multiple of Wind would completely eliminate all Shortfalls?
Answers (see Figure 7):
- for year ending in 2024, Wind Multiplier = 45 times current *capacity*;
- for year ending in 2023, Wind Multiplier = 36 times current *capacity*;
- for year ending in 2024, Wind Multiplier = 40 times current *capacity*
Figure 7: Three Successive Years, Eliminating Shortfalls:


That does not look practicable at all.
Future Texas with ‘a Little Bit’ of LDES
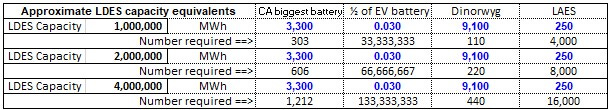
Allowing for installation of ‘a Little Bit’ of LDES, those Wind Multiples can be drastically reduced while still effectively eliminating Shortfalls. Just looking at the year ending in 2024 as it required the highest Wind multiple, we find:
- with 1 Million MWh LDES, Wind Multiplier = 26 times current *capacity*;
- with 2 Million MWh LDES, Wind Multiplier = 20 times current *capacity*;
- with 4 Million MWh LDES, Wind Multiplier = 17 times current *capacity*
Figure 8: Year Ending 2024, LDES & ~ Eliminated Shortfall:


Those LDES capacities? A piece of cake, no worries, good as done…
‘Hey, Tex, you didn’t ever plan to *go* anywhere in that nice new electric pickup truck, did you? Because your State needs it more than you do.’
That’s it for now. Let me know what you think.
Oh, but before you go.
Request for European country data.
I’ve been asked to perform this kind of analysis for e.g. Germany, Denmark. I would gladly do so if I could find a source / sources of Excel-compatible data (as collected by the EIA and GridWatch).
If you know of any please comment with link(s).
Thank you.
Copyright © 2024 Chris S Bond
Disclaimer: Opinions expressed are solely my own.
This material is not peer-reviewed.
I am against #GroupThink.
Your feedback via polite factual comments / reasoned arguments welcome.
Similar to what I noted in the California post, for TEX the EIA make two data-files available. There seems little difference between the plots in the “Region_TEX.xlsx” file (22.5 MB) and the “ERCO.xlsx” file (52 MB). Therefore I chose to use the slimmer file.
Wow - great article on Texas - a lot to take in and reference.
Thank you
This is an awful lot of fuss for a problem that doesn’t even exist, since the impact of CO2 on climate is negligible. But the lies about it are making a lot of people rich.