

US48 Power Generation 'Decarbonization'
Based on the latest year's worth of *real data* from power generation across the contiguous United States (US48), what might be needed to displace medium- and high-CO2 power generation?

Summary
I extrapolate from the latest year’s real power system energy data to estimate what increases in Wind and Solar PV generation will be needed to displace the main emitters of CO21 across US48:
To displace ~90% of high-CO2 emission fuels (coal + oil) would require
~320% *more* Wind plus 100% *more* Solar PV than US48 has currently;To displace ~50% of majority-CO2 emission fuels (coal + gas + oil) would require ~515% *more* Wind plus 100% *more* Solar PV than US48 has currently;
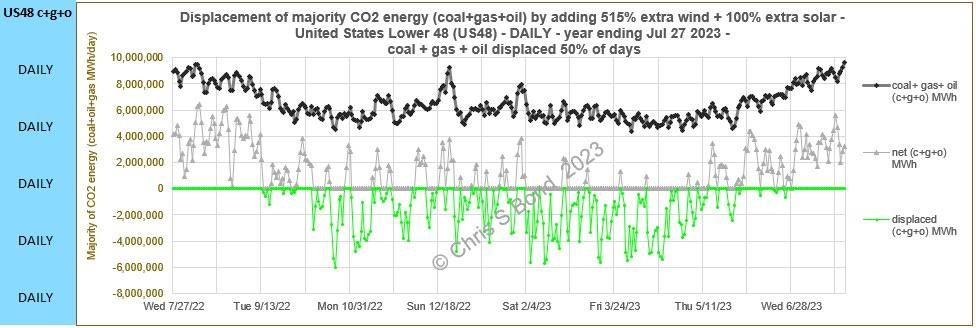
To displace ~90% of majority-CO2 emission fuels (coal + gas + oil) would require ~1060% *more* Wind plus 100% *more* Solar PV than US48 has currently; or
~960% *more* Wind plus 300% *more* Solar PV than US48 has currently
If 90% ‘decarbonization’ is achieved simply by brute force addition of more and more Wind and Solar PV, there will still be intervals when CO2-emitting generators will be required to keep US48 lights on… unless there are huge breakthroughs in the development of immense cheap electricity storage capacity.
But these multiples of Wind and Solar PV are likely anyway to be impossible because of existing distribution grid constraints.
Introduction
A week or so ago I saw a LinkedIn post with charts of power demand and generation for US482. The author included a link to an Excel file which contained the data and the plots, and crucially included this link to the US Energy Information Administration (EIA) real-time operating grid information.
The site has a “download data” button, which by complete contrast with CAISO site data, is easy to use and gives immediate access to comprehensive and continuous data. The record starts July 01, 2015 for any individual balancing authority / region and for all 48 contiguous states. Full records including individual energy sources (coal, gas, nuclear, wind, etc.) begin July 01, 2018.
I wanted to get a high-level view of the whole of the USA, so I downloaded the US48 data: the “Region_US48.xlsx” workbook. This has four tabs. The [published hourly data] and [published daily data] comprise the record, which are added to daily. Most usefully, the [hourly charts] and [daily charts] tabs of the workbook are pre-configured so a user can select the last date for which you want to see data plots, which are already set up. Bravo, EIA!
(I checked the California data-set from EIA: same setup, very good, much much better than CAISO’s own.)
Methodology
As I declared in my first post on Substack, I am not in the modelling business; I prefer to stick close to reality. So, I didn’t do anything opaque, nothing that anyone else who is familiar with Excel could not do. Chart 1 shows some of the pre-set plots of the actual EIA data I started with, for the most-recent year. I just added the ‘year ending Mmm dd yyyy’ string to the header label, and slightly increased the size of the charts themselves to maximise legibility.
Chart 1 - ‘Raw’ EIA, US48
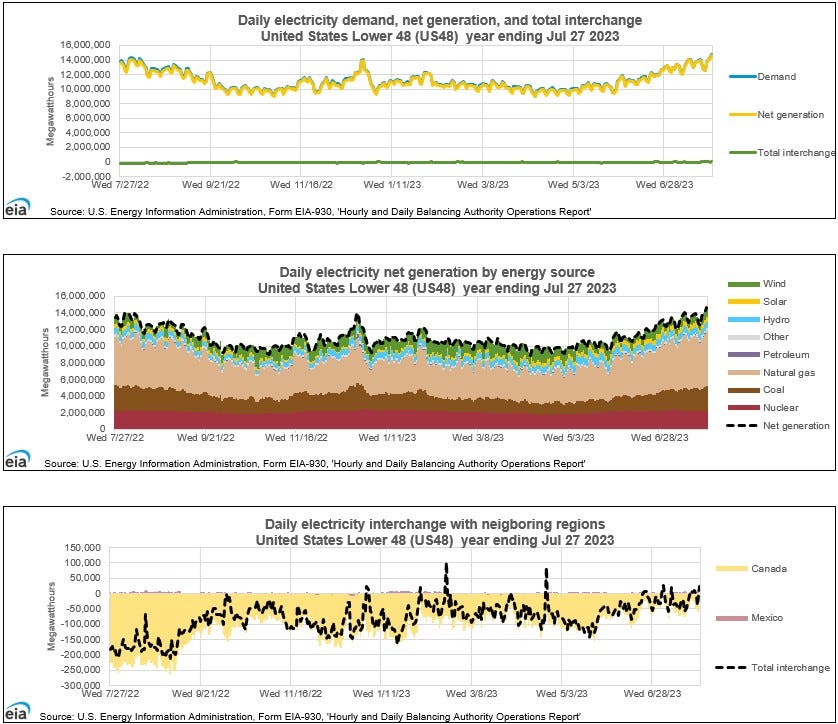
I chose the most recent year both because it was (mostly) non-plague-affected, but also because it contains the most recent Wind and Solar PV fleets’ outputs. *Real* outputs from across the whole of US48, no theoretical models needed.
I simply extrapolated the actual recorded Wind and Solar PV energy quantities and plotted whether the extra Wind and Solar PV energy quantities could displace the actual Coal + Oil (or actual Coal + Gas + Oil) energy quantities. All as recorded by the EIA for each interval. I left all other sources of energy the same in the interval to keep things simple.3
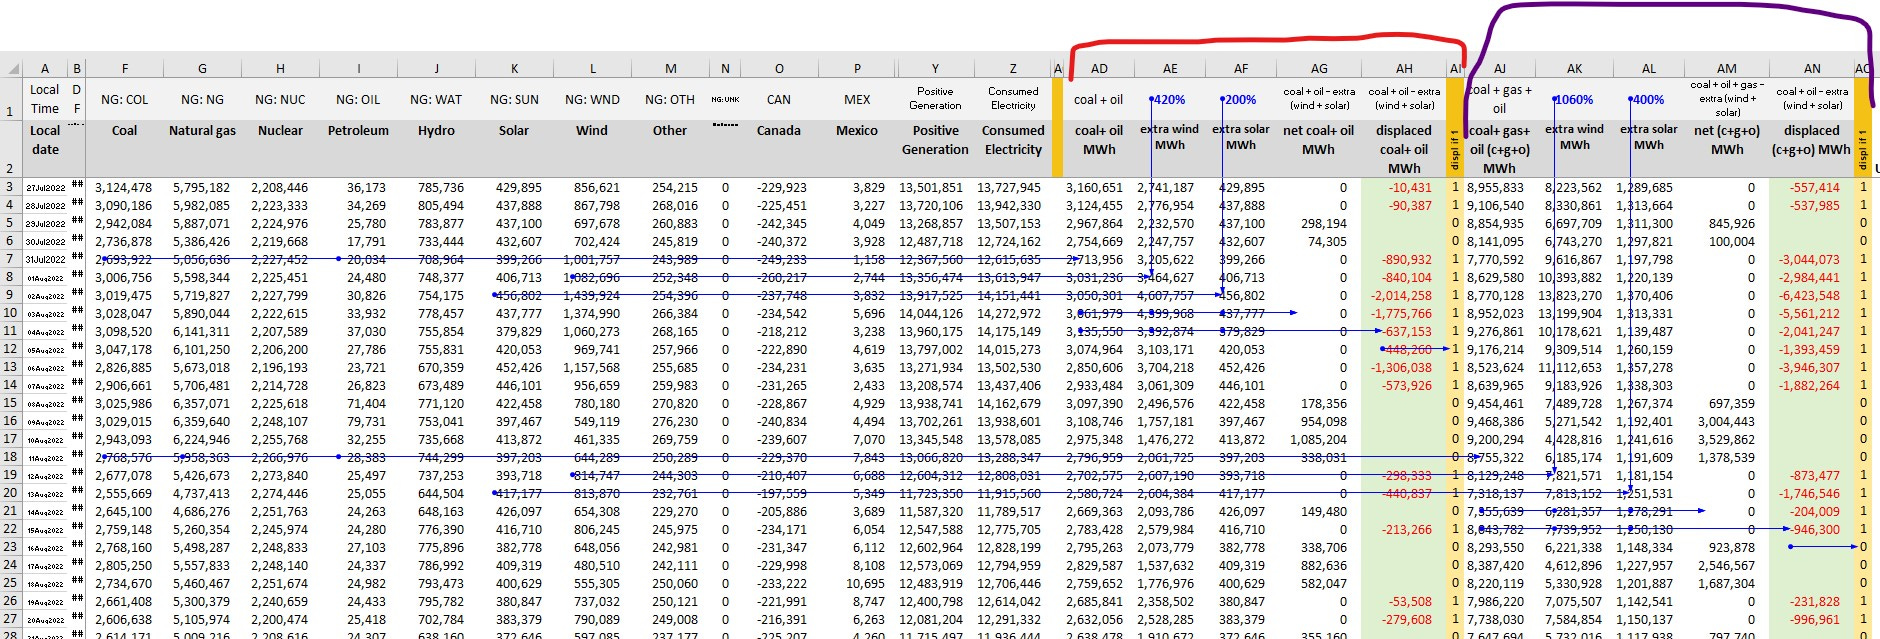
I’ve used Excel’s ‘trace precedents’ in the view in Figure 1 to show exactly what I did on the [Daily Charts] tab. Note: to get the extra Wind or extra Solar PV, subtract 100% from each of the percent numbers at the top of columns AE, AF, AK and AL. I used the same methodology on the [Hourly Charts] tab.
Figure 1: Extrapolation Example Details
I then added specific plots to show the results of the extrapolations. I hope these will inform the debate around exactly how far is America (US48) from ‘decarbonization’. I extrapolated to achieve different levels of success:
90% for the easier task of displacing Coal + Oil, the highest direct producers of CO2. The percentage is of the number of days full displacement is achieved, i.e. there is a ‘1’ in column AI. See Chart 2.
50% for the more difficult task of displacing Coal + Gas + Oil, the majority direct producers of CO2. The percentage is of the number of days full displacement is achieved, i.e. there is a ‘1’ in column AO.
I re-used columns AI thru AO with higher % increases in Wind and/or Solar PV so as to achieve 90% of days full displacement (a ‘1’ in column AO again).
Figure 1 shows some of the numbers from the 50% and 90% scenarios for the first ~25 days of the year ending July 27, 2023.
Chart 2 - 90% Displacement of Coal + Oil, US48
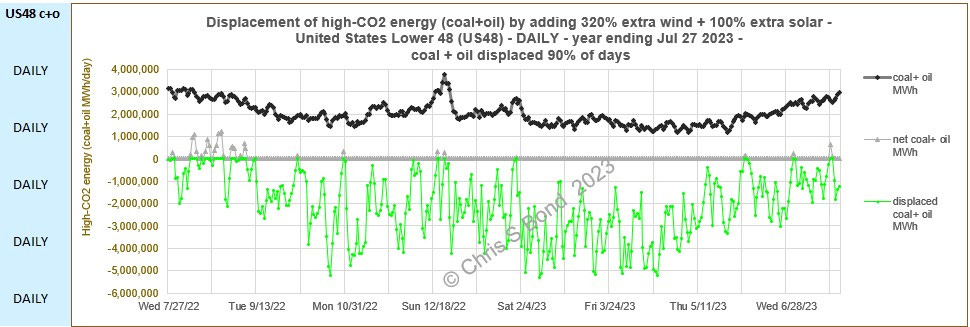
This scenario considers what is needed to displace Coal + Oil, the highest direct producers of CO2, for 90% of the time.
All the green spikes, up to -5,000,000 MWh, would be surplus energy that currently would have to be constrained to maintain grid stability. I don’t believe hydrogen production would currently be the answer, but future developments might bring its cost and complexity down. Except then fugitive emissions of tiny H2 molecules must be accounted for, unlike in California at the moment. Maybe electric vehicles can provide some support if they become prevalent enough. Day-to-day variations of 1,000,000 MWh would require 100 million EVs linked to the grid if they were willing to flex 10 kWh each.
Chart 3 - 50% Displacement of Coal + Gas + Oil, US48
US48 can get half-way to full ‘decarbonization’ by adding just over FIVE TIMES more Wind plus as much Solar PV again as currently exists.
Or
US48 can get half-way to full ‘decarbonization’ by adding just under FIVE TIMES more Wind plus two times as much Solar PV4 as currently exists.
Of course, to displace 90% of Coal + Gas + Oil will take commensurately more Wind, more Solar PV. As if FIVE TIMES more Wind isn’t enough.
So, using this real recorded data from US48 and simply extrapolating further, we can estimate how much more Wind (and maybe more Solar PV) we need to achieve full ‘decarbonization’ of the US48 power grid 90% of the time.
Chart 4 - 90% Displacement of Coal + Gas + Oil, US48
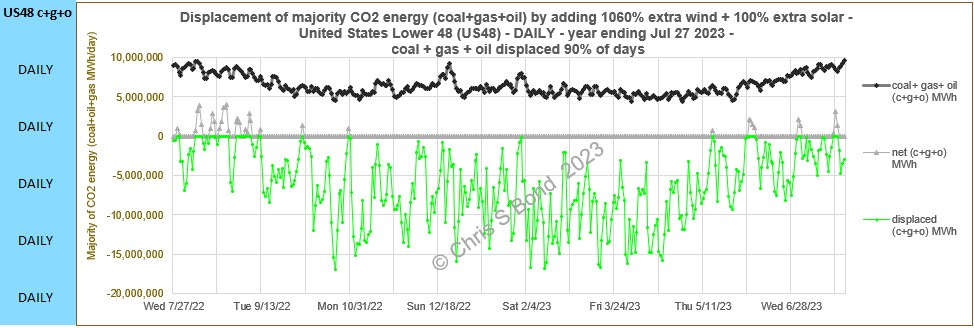
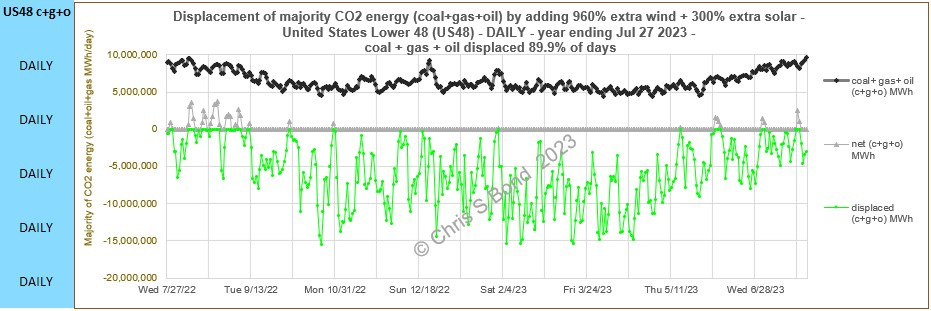
Chart 4A - Alternative Scenario for 90% Displacement of Coal + Gas + Oil, US48
US48 can get 90% ‘decarbonization’ by adding just over TEN TIMES more Wind plus as much Solar PV again as currently exists.
Or
US48 can get 90% ‘decarbonization’ by adding nearly TEN TIMES more Wind plus three times as much Solar PV as currently exists.
And that analysis IGNORES the inevitable increases in electrical power demand which will result from electrification of transport (EVs) and heating (heat pumps) and so on.
Side note: All the chatter about ‘duck curves’ in the USA increasingly convinces me that Solar PV causes more problems than it’s worth in a power grid. Until cheap and immense electricity storage technology is developed and fully commercialised, I believe that will remain the case. In this post I suggested adding buffer electricity storage to every Solar PV facility to even out the power provided to consumers / the local grid over every 24-hour interval. One of my commenters stated: “If you forced solar to come with storage you wouldn't have much solar, especially if you demanded even flow across a day.” I agree. As I replied, “One of the reasons for my post was to emphasise the (in my opinion) absurdity of ever more solar *capacity* while completely ignoring the negative implications.”
Anyway, Charts 4 and 4A show the overall picture for the year ending July 27, 2023. The great thing with the EIA workbook is that you can define the end-date in the [Hourly Charts] tab to zoom in on any 2-week interval. Which is what I did in Charts 5, 5A and 5B to see some detail.
Chart 5 - 90% Displacement of Coal + Gas + Oil, US48: 2 weeks thru Aug 10, 2022
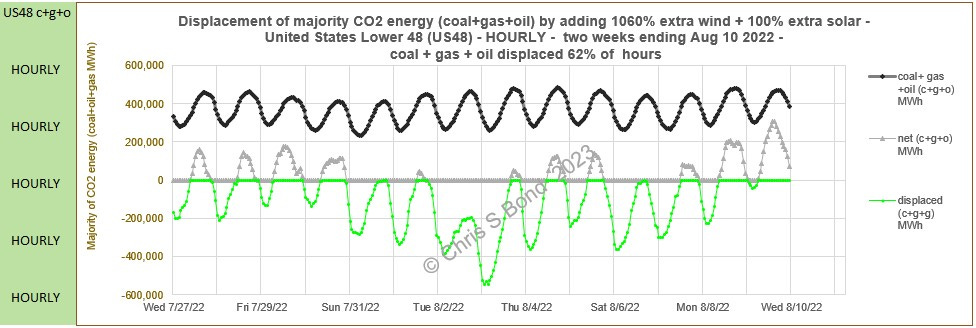
Chart 5A - 90% Displacement of Coal + Gas + Oil, US48: 2 weeks thru Jan 25, 2023
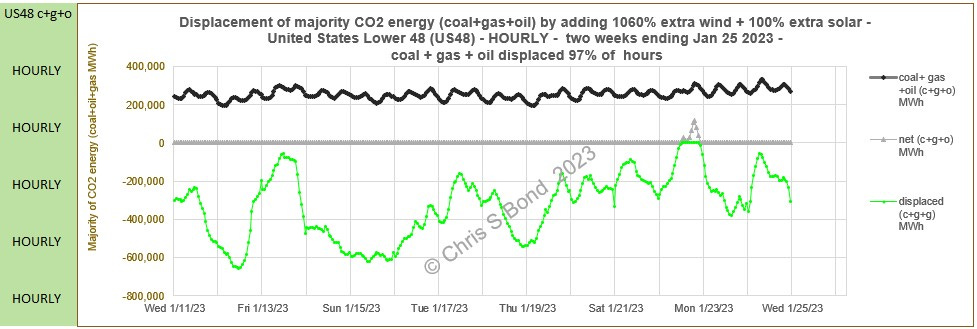
Chart 5B - 90% Displacement of Coal + Gas + Oil, US48: 2 weeks thru July 27, 2023
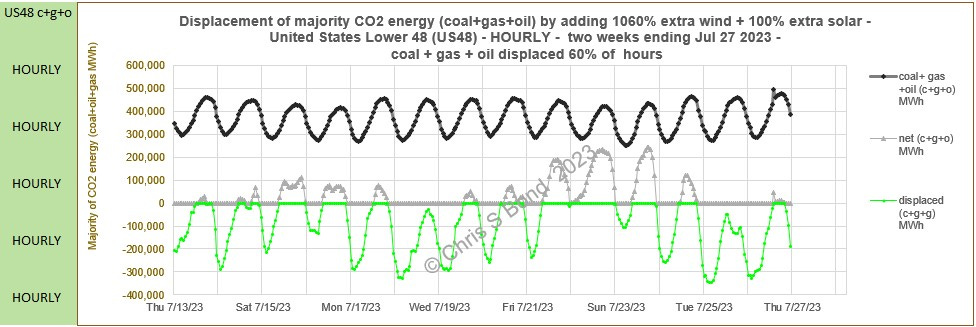
Chart 5A exhibits some discontinuities in the green ‘displaced’ plot, which raises a caution flag regarding the data. Any attempt to automatically process the data to find a maximum ‘ramp rate’ (i.e. rate of change of power) is likely to fail because of such data glitches.
However, simply eye-balling the charts indicates very high rates of change i.e. steep upward and downward lines. This potentially represents power needing to flow at extremely high rates across the continental United States. My analysis does NOT include any assessment of how possible that is. But just from comments I’ve seen made by Americans about grid constraints, I think impossible sums it up.
That’s it. Enjoy!
Disclaimer: Opinions expressed are solely my own.
This material is not peer-reviewed. This is why I’ve stopped believing it would do any good anyway.
I am against #GroupThink. And I am really pro #FreeSpeech.
Your feedback via polite factual comments / reasoned arguments welcome.
I am ignoring fugitive emissions - mainly of methane, but also of other species with global warming potential - from supply chains. Fugitive emissions are important to include honestly in official policy, but too complex to include in this simple broad-brush analysis.
US48 consists of the 48 adjoining U.S. states and the District of Columbia of the United States of America.
I don’t expect hydro-power or pumped hydro storage schemes to suddenly proliferate across US48. Nor a fleet of new nuclear stations. And absolutely not a new fleet of ‘biomass’ power stations: there simply aren’t enough trees now to have any hope of achieving ‘Net Zero’.
I include the options with more Solar PV to please the Solar PV proponents. Many of whom claim the Levelized Cost of Energy (LCOE) is falling exponentially. This despite many including Lazard acknowledging real-world additional ‘Costs of Firming Intermittency’ i.e. having reliable power generators able to step in if the Wind doesn’t blow just right, and every night when Solar PV stops. See the chart headed “Levelized Cost of Energy Comparison—Cost of Firming Intermittency” in Lazard Version 16.)
Regarding your comments about over-production of energy by renewable generating resources, is it not possible simply to balance this in real time by preventing the renewable resources from generating ? I can understand that it is difficult or impossible to switch nuclear or coal or gas fired thermal plants on and off rapidly. On the other hand can you not simply feather a wind generator and disconnect a PV panel? With the granular nature of wind and solar, it would be possible to do this with a fine level of adjustment. I do not really understand the problems of network balancing so maybe this is a stupid question.
Chris, is this the de-carbonisation of the current electricity generation grid? In other words, not transportation, heating, manufacturing, etc? Because those numbers would be far higher, I would guess. In the UK, if we converted all 28 million households' gas boilers (approx 30kW each) to electric (say, 10kW), that would be an extra 280GW load on the national grid, about 7 times the current size.