Diminishing Returns
GB is unlikely to fully benefit from ever more Wind and Solar generation *capacity* until immense electrical storage technology becomes cheap and ubiquitous

[edit]
Editing to correct various snafus with units and use of the wrong csrf Fig.
[edit] shows where I’ve edited.
With apologies to several commenters: it was only when I went back to it after a week away that I saw what you had tried to draw my attention to. And thank you.
I began writing this on 2nd January 2024 (Happy New Year!) while storm Henk was blowing the last few leaves from the trees (and, as it turns out, the asphalt roofing off my carport) with its 50+ mph (80+ kph) gusts. According to GridWatch the GB power grid was getting ‘only’ 20% of Demand from Wind (Fig. 1) - presumably it was the wrong kind of Wind, too strong, too gusty, too something. It was also early afternoon on a cloudy mid-winter day, so Solar PV was contributing a meagre 1½ %.
Figure 0: GridWatch Snapshot 02 Jan 2024, 14:35
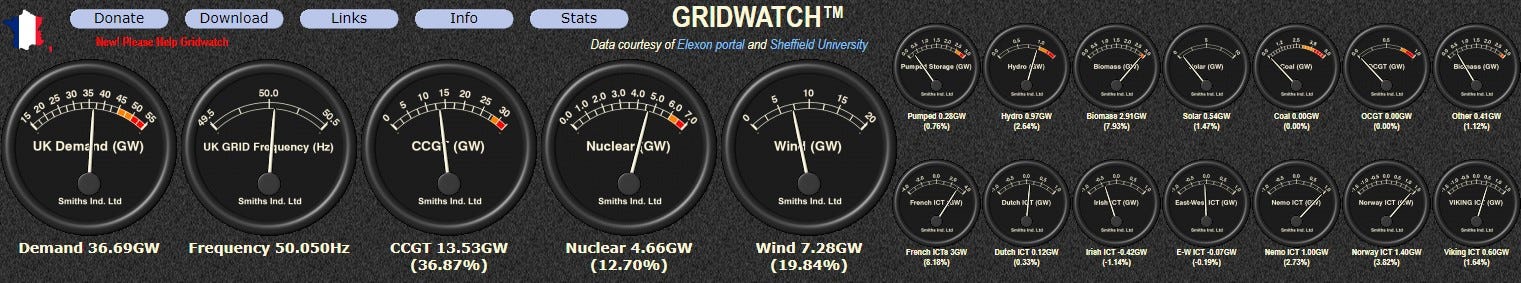
However, a snapshot like that can tell us very little. It is much more instructive to look at granular data spanning, for example, a whole year. We have just ended 2023, so I’ve been looking at some scenarios based on extrapolation of 2023’s real power data from across the GB fleet1 which comprises over 96% of UK electricity.
In this post I’m building on some of the themes from various of my previous substack posts: my evaluation of Labour’s ‘Mission’ for ‘renewable’ energy; the very real issue of ‘surplus’ ‘renewable’ power having to be constrained to maintain grid stability; and my recent post on two early real electrolyser plants - among others.
In particular and based on the factors in the ‘Mission’ post, I’ve estimated Demand, plus effective Wind and Solar *capacities*, at three equal-spaced intervals en route to the end of 2030 by which time Labour’s ‘Mission’ will have become GB’s reality.2
[edit]
Table 1: the 'Mission' Across Three Equal Steps and Results Summary
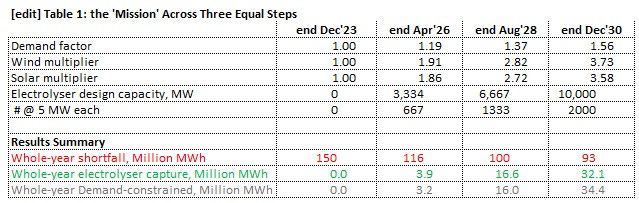
Figure 0A: Wind Adjustment Factors
GridWatch states there is unmetered Wind power, for which I assume DUKES accounts in its annual records i.e. DUKES 6.2, updated each July. This adjustment factor is 1.3016 to bring the integrated total MWh of Wind in 2022 to equal the DUKES total. I’ll continue to use this same adjustment factor until the next DUKES 6.2 update in July 2024. The Wind multiplier is applied to each adjusted Wind power.
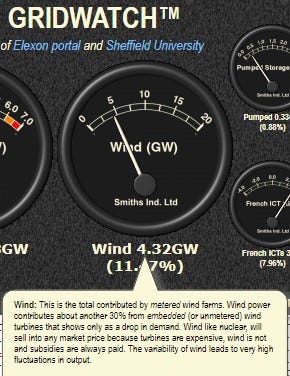
Figure 0B: Solar PV Adjustment Factors
GridWatch states there is unmetered Solar power, similar to that for Wind. The Solar adjustment factor is 1.1914 to bring the integrated total MWh of Solar in 2022 to equal the DUKES total. I’ll continue to use this same adjustment factor until the next DUKES 6.2 update in July 2024. The Solar multiplier is applied to each adjusted Solar power.
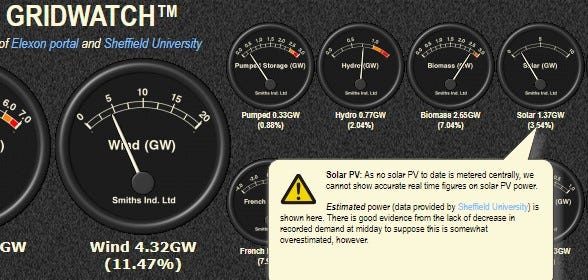
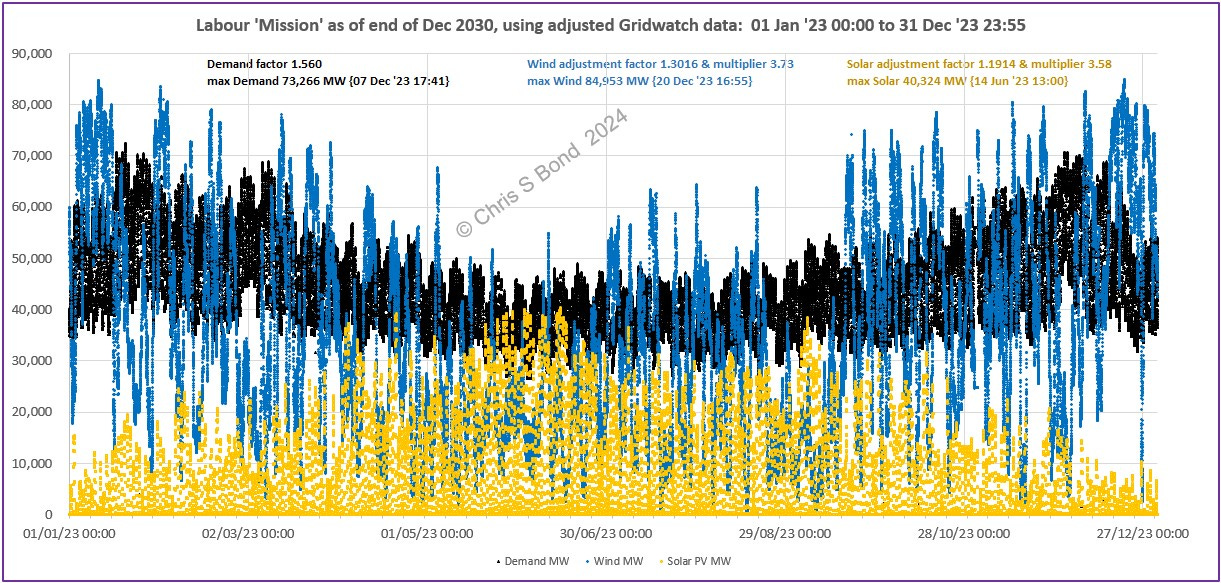
Figure 1: Whole-Year 2023 Demand, Wind and Solar
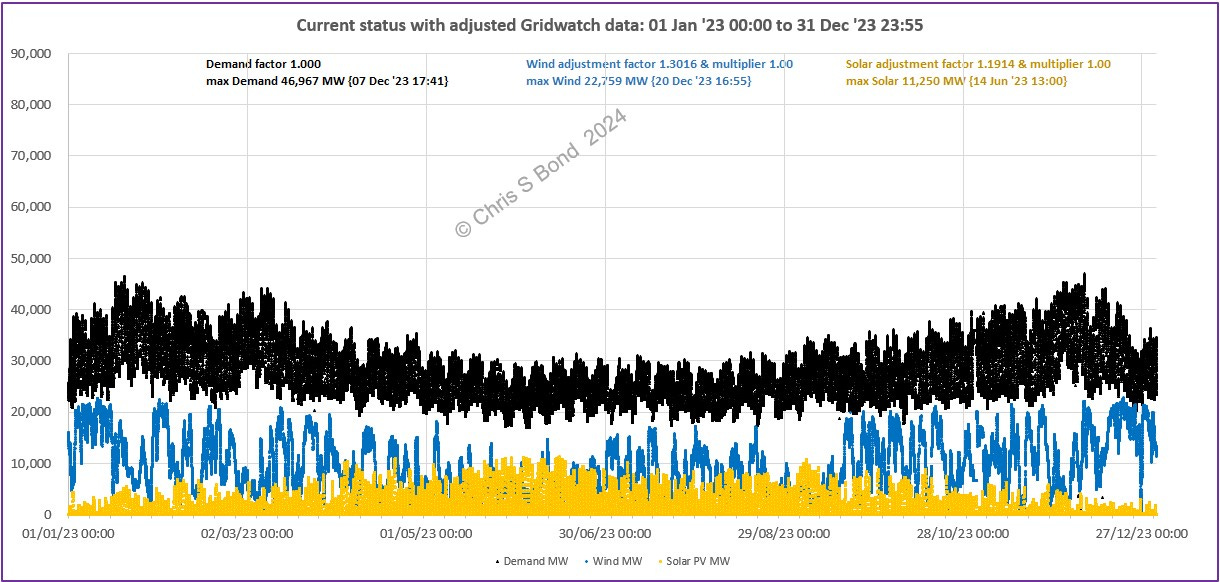
Figure 1 shows Wind was providing sustained high levels of power in the first half of January and in the last half of December of 2023. Figure 1A indicates that there was no surplus ‘renewable’ power during either of those high-Wind intervals. Figure 1A also shows the total power being exchanged by GB.
Note the relative size of the total power capacity of interconnectors:
Maximum + 8,645 MW import to GB ~18.4% of maximum GB Demand;
Minimum - 5,638 MW total export from GB.
Merely on capacity grounds they are not to be relied upon to keep GB’s lights on.
Figure 1A: Whole-Year 2023 Surplus / Shortfall / Interconnectors
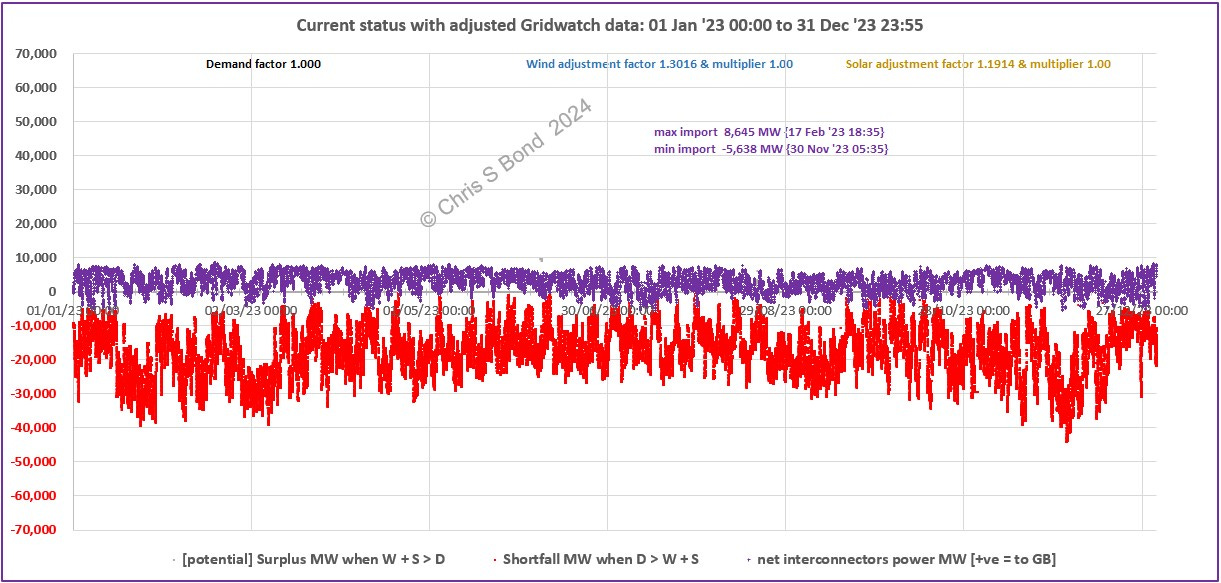
Through the middle of the GB year there were occasional apparent surplus spikes when briefly Wind + Solar > Demand. I think these likely coincided with lower Wind interludes across the Euro land-mass allowing GB ‘surplus’ to be exported.
There is sometimes coincident high generation from European Wind: see, for example, the December data in Figure 1B comparing to Figure 1.
Figure 1B: Europe December 2023
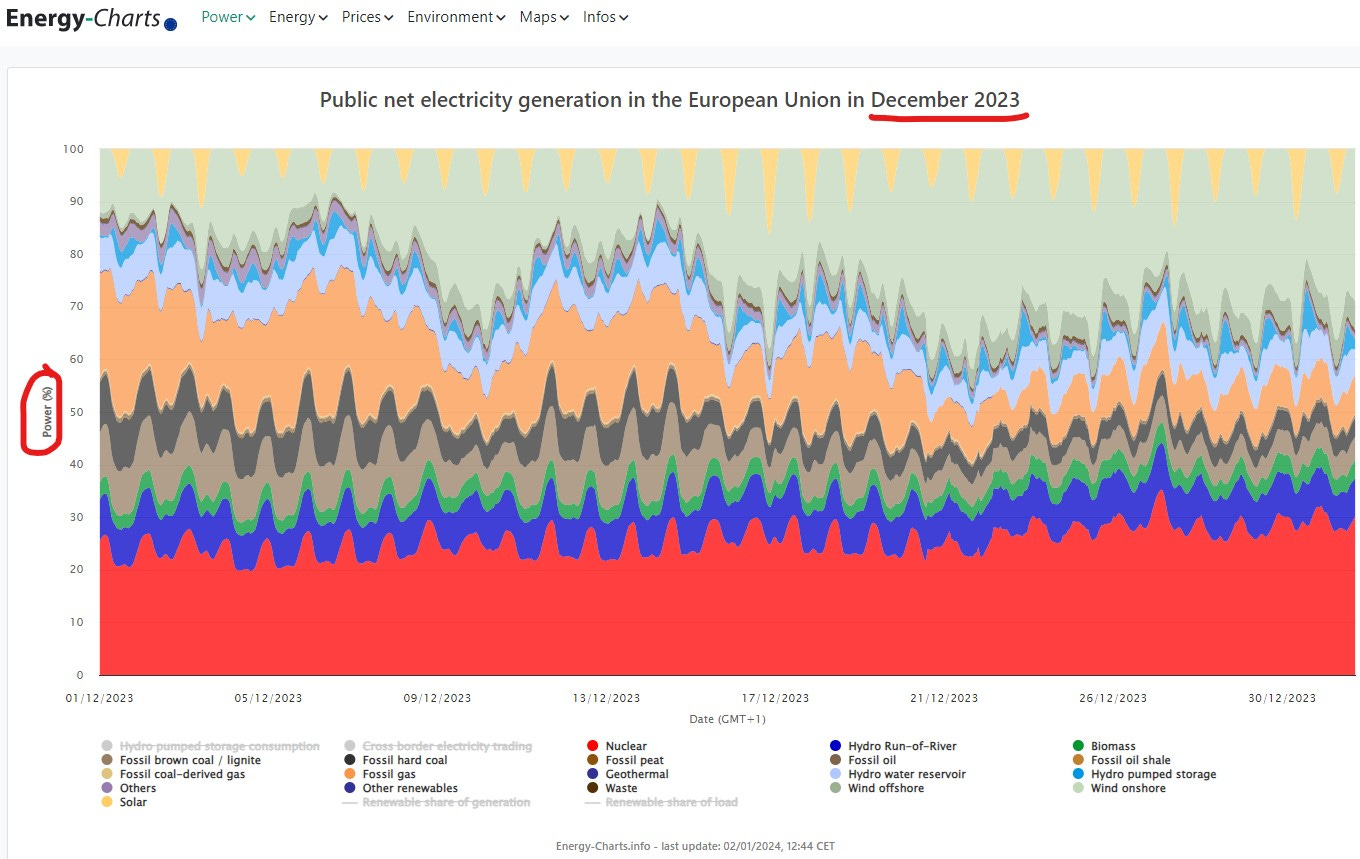
Note the greatly reduced Wind contribution around 14/12/2023 in Europe, which I think coincided with a severe dip in GB Wind. However, data whinge: the energy-charts.info web interface /infos/ Downloads does not make EU-wide data available, so I cannot easily cross-match the GB-level data with the EU-level data.
As of the end of 2023, I don’t think GB has any ‘green’ hydrogen capacity . Hence we don’t have any additional flexible reliable Demand, and so any ‘surplus’ ‘renewable’ power would have nowhere to go and consequently has to be constrained.3 Hence we can generate Figure 1D for 2023.
Figure 1D: Whole-Year 2023 Shortage / Surplus / Electrolysers
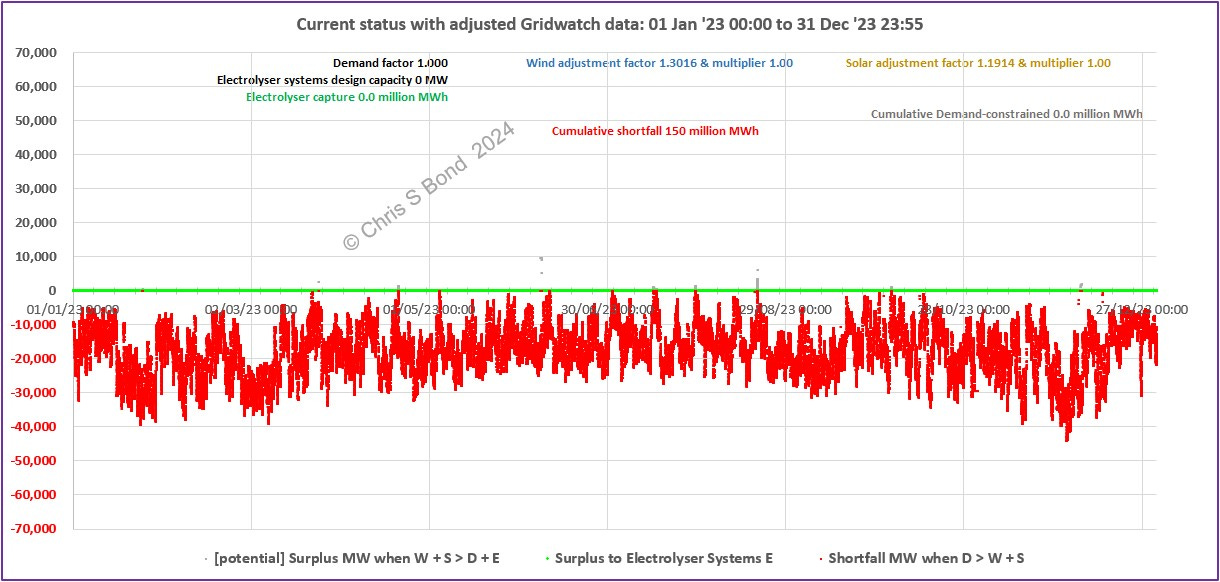
Note the cumulative shortfall of (W + S) by the end of 2023 was 150 Million MWh (=150 TWh)
Extrapolating Future Scenarios from Real Data
To ‘model’ a future case from the real data is quite simple. I extrapolate: each data-set’s Demand is multiplied by the Demand factor; each data-set’s Adjusted Wind is increased by the Wind multiplier; and each data-set’s Adjusted Solar is increased by the Solar multiplier. Assuming (for simplicity) that all other power flows remain unchanged, I then compare future total (Wind + Solar) to future Demand.
If D > W + S there is a shortfall;
If W + S > D there is a surplus, which can be used in electrolysers with design capacity E up to maximum E MW;
If W + S > D + E the super-surplus has to be constrained to maintain control of grid frequency.
Thus we can generate Figures 2 and 2A, etc.
Figure 2: End-April 2026 ~According to the ‘Mission’
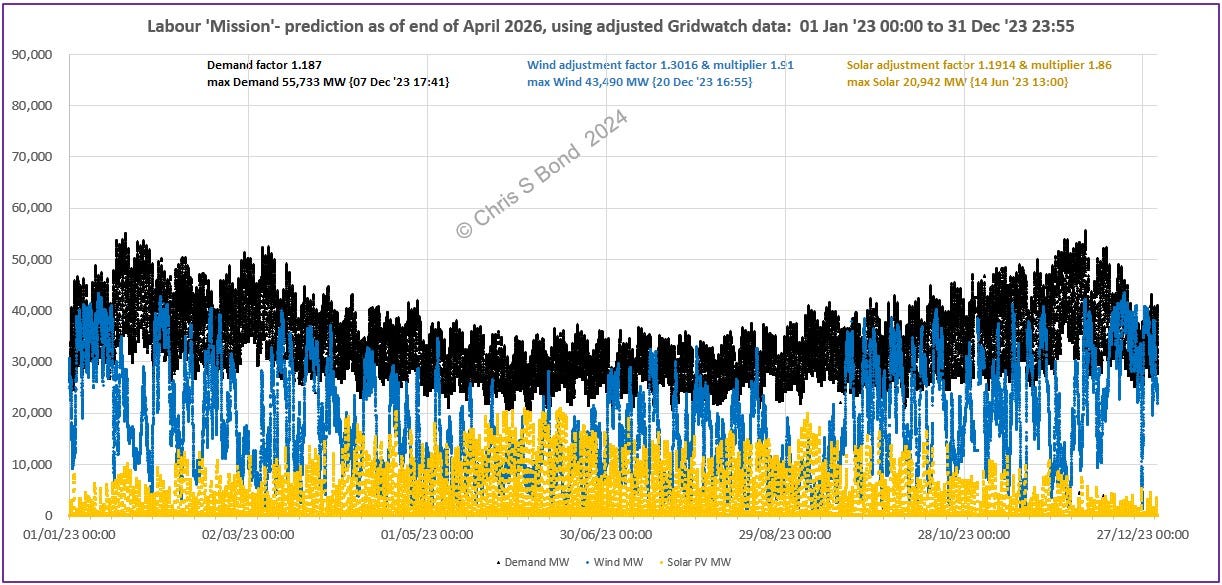
By the end of April 2026 there should be around 3,334 MW of electrolyser capacity (see my post on hydrogen to get an idea of the physical scale of these beasts: a 5.5 MW electrolyser is huge). So by then we’ll be able to start generating ‘green’ hydrogen. But only a little bit; cumulative 3.9 million MWh. That’s about equal to the amount of super-surplus W + S power that would have to be constrained to maintain grid stability.
Figure 2A: End-April 2026 Shortage / Surplus / Electrolysers
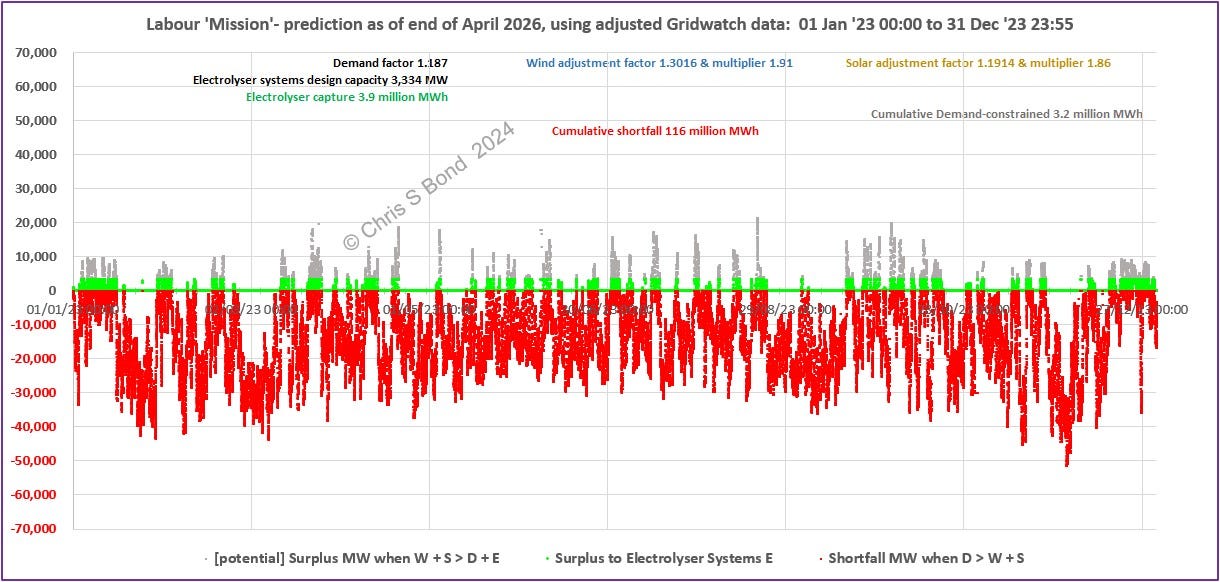
Note the cumulative shortfall of (W + S) by the end of Apr’26 is 116 Million MWh.
Note also the greatest shortfall is around 50,000 MW at the beginning of December, and several shortfall spikes reach ~45,000 MW - giving an indication of the scale of ‘backup’ dispatchable power necessary to keep the lights on by end-April 2026.
Extrapolating to end-August 2028 by the same methodology we can generate Figures 3 and 3A.
Figure 3: End-August 2028 ~According to the ‘Mission’
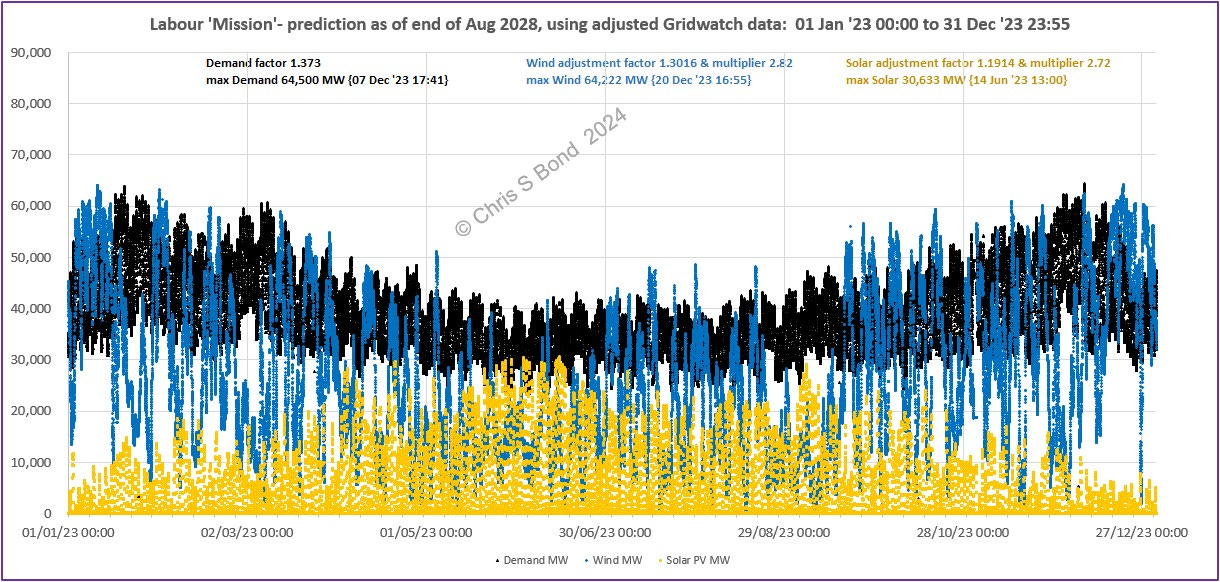
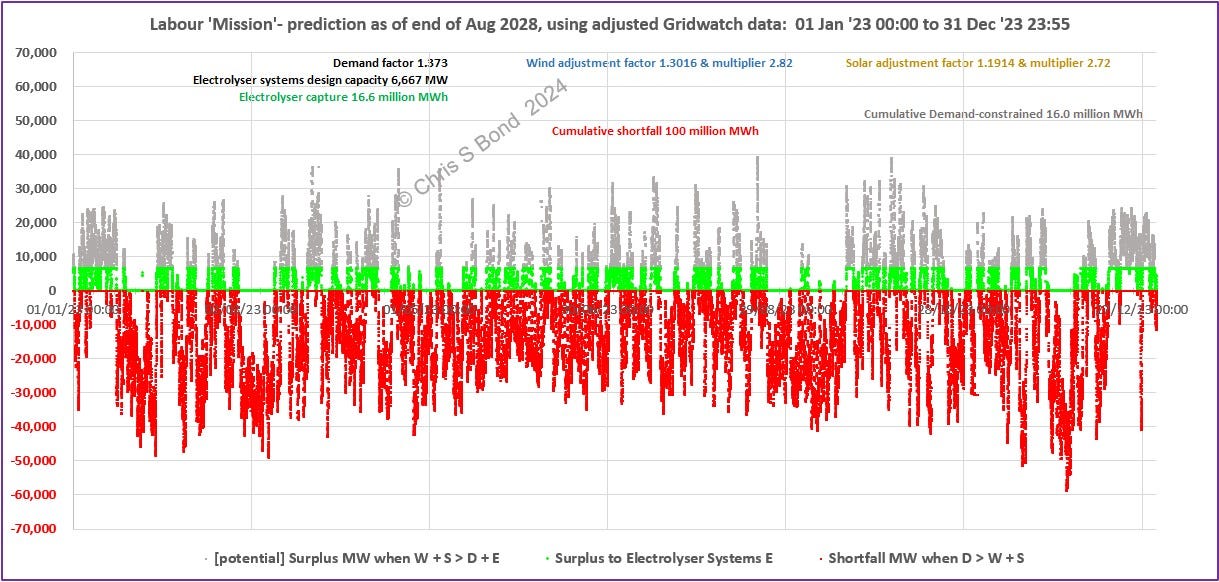
By the end of August 2028 there should be around 6,667 MW of electrolyser capacity. So by then we’ll be able to generate more ‘green’ hydrogen, a cumulative 16.6 million MWh-worth. Again that’s about equal to the amount of super-surplus W + S power that would have be Demand-constrained to maintain grid stability. And we still would have to deal with the cumulative shortfall of around 100 million MWh.
Figure 3A: End-August 2028 Shortage / Surplus / Electrolysers
Completing the extrapolation to the end of 2030:
Figure 4: End-2030 ~According to the ‘Mission’
Based on real 2023 weather, all parts of the GB grid: the high-voltage transmission, the transformers, the low-voltage systems to end-consumers, plus a whole new system of electrolyser plants and hydrogen transmission / storage / hydrogen consumption facilities, all would have to be able to cope with:
[edit]
Peak Demand ~ 73,000 MW;
Peak Wind generation ~ 85,000 MW;
Peak Solar generation ~ 40,000 MW
and from Figure 4A:
Peak shortfall ~ 40,000 to 50,000 MW common (extreme peak ~65,000 MW)
Figure 4A: End-2030 Shortage / Surplus / Electrolysers
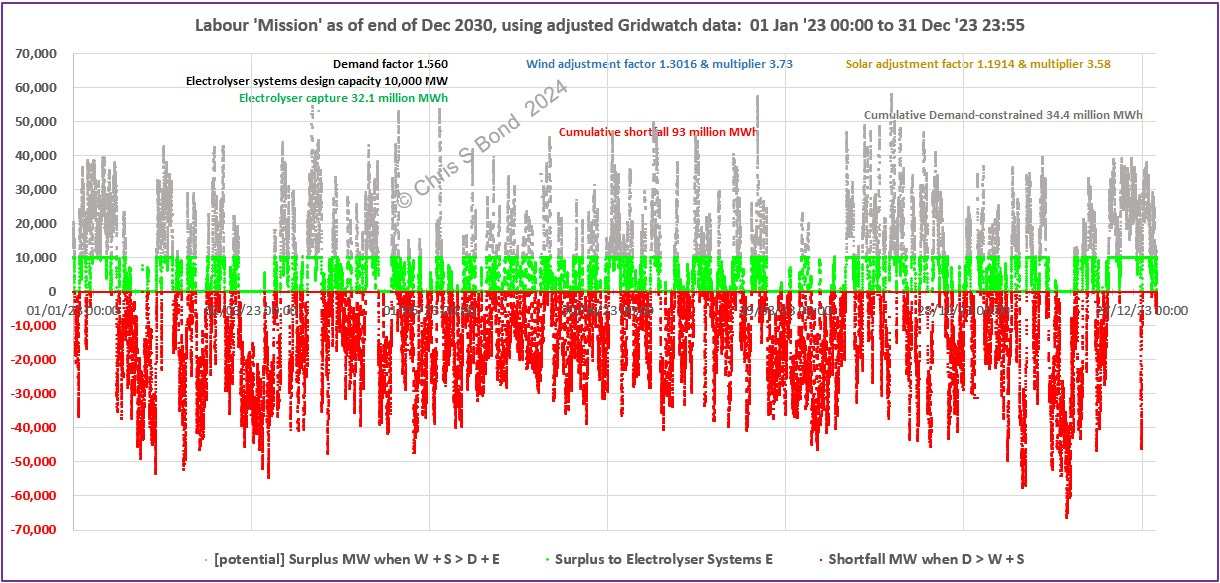
By the end of 2030 there should be 10,000 MW of electrolyser capacity. So we’ll be able to generate a cumulative 32 million MWh-worth of ‘green’ hydrogen. Yet again that’s about equal to the amount of super-surplus W + S power that would have be Demand-constrained to maintain grid stability. And we still would have to deal with the cumulative shortfall of around 93 million MWh.
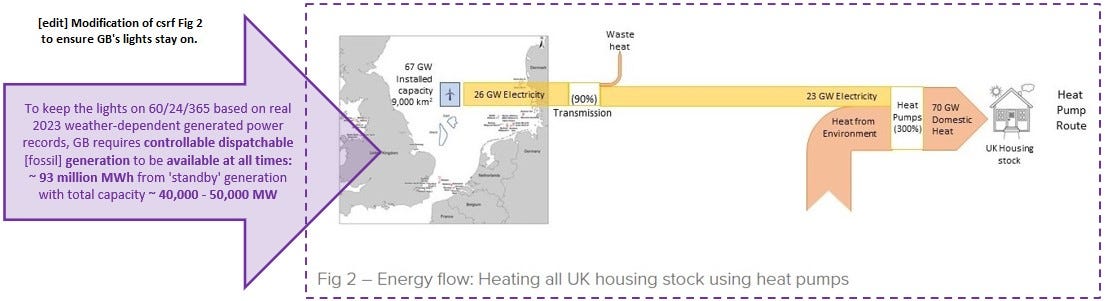
So what does this mean for GB’s future? Well, I think [edit] The Centre for Sustainable Road Freight’s blog-post Fig 2 needs to be adjusted as shown in Figure 5:
[edit] Figure 5: Keeping GB Lights On by end 2030
I am fully aware that the weather-related generation of 2023 will never be repeated. Some years are better, some worse. But if planners continue to ignore the huge real intermittency I’ve seen especially in GB’s Wind data across the last four years then bad things will happen, mostly to people in our society who can least cope.
Yes, taller bigger Wind turbines are likely on average to achieve higher load factors. But to take a predicted average load factor and mistake it for a guaranteed load factor, as some Wind proponents seem to do?
Not valid, sorry. Just look at the data.
Copyright © 2024 Chris S Bond
Disclaimer: Opinions expressed are solely my own.
This material is not peer-reviewed.
I am against #GroupThink.
Your feedback via polite factual comments / reasoned arguments welcome.
Northern Ireland’s grid is operated by SONI (System Operator for NI), owned by Irish state company EirGrid: the power grid across the island of Ireland is integrated. Two interconnectors run between GB and NI / Ireland: ‘Moyle’, ± 500 MW, linking Scotland with NI; and ‘East-West’, ± 500 MW, linking Wales with Ireland. All-time peak NI electricity Demand is 1,777 MW, i.e. approximately 3.8% of 2023’s peak GB Demand (see Figure 1).
I know that’s difficult for many engineers to believe, but we just have to put aside our scepticism. Politicians have said it most earnestly, hands on hearts, so it must true.
I’m somewhat puzzled that National Grid ESO only seems to address ‘constraint’ payments in terms of local grid capacity deficiencies - not the more-general need to ensure that the right amount of electricity is where it’s needed, when it’s needed – always keeping supply and demand in perfect balance. The costs to consumers in the constraint payments document are not trivial: minimum around £ 0.5 billion / year over the next 20 years, or “£16bn … based on the ‘Leading the Way’ scenario” in 2020/21 prices.
Excellent analysis. I appreciate your effort to plow through the numbers.
To make it easier for others to digest, I would if you could convert the extra storage needed into the price to buy Tesla Powerwalls:
https://www.tesla.com/powerwall/design
In Australia we are seeing the capacity factor of renewables decrease as renewable penetration increases.
https://open.substack.com/pub/criticaluncertainties/p/dont-worry-offshore-wind-will-save?r=nv184&utm_medium=ios&utm_campaign=post