

Intermittency aka Diminishing Returns #2
Analysis of a 'decarbonised' UK reliant on Wind + Solar PV generation based on real weather-dependent generation 2020 - 2021 - 2022 - 2023.

The Substack app is warning me this post is ‘too long for email’. In case of truncation please click the image in the email to see the full post - complete with its zoomable graphics.
Introduction
From my earliest posts I’ve used real GB power Demand and generation data to evaluate how realistic are the claims that we can ‘decarbonise’ our grid just by installing ever more Wind + Solar PV generation *capacity*. Even two years ago, and based on just two years of data, I found there is a need for immense quantities of electrical energy storage to ensure the lights stay on consistently.
We have now moved on two years and the good people at GridWatch have continued to build their database of real GB energy flows. Official HM Gov statistics compiled under the Digest of UK Energy Statistics (DUKES) have also been extended.
Note I deliberately use data from recent years - those for which the installed operating *capacity* [.xlsx] of onshore Wind, of offshore Wind and of Solar PV are already substantial - so I only need to extrapolate fairly modestly to estimate future generation from each. I don’t do any theoretical ‘modelling’, I simply multiply by factors to estimate what a future GB’s power generation might look like. All recent overall capacity factors for GB Wind and Solar PV are in DUKES 6.3 [.xlsx]).
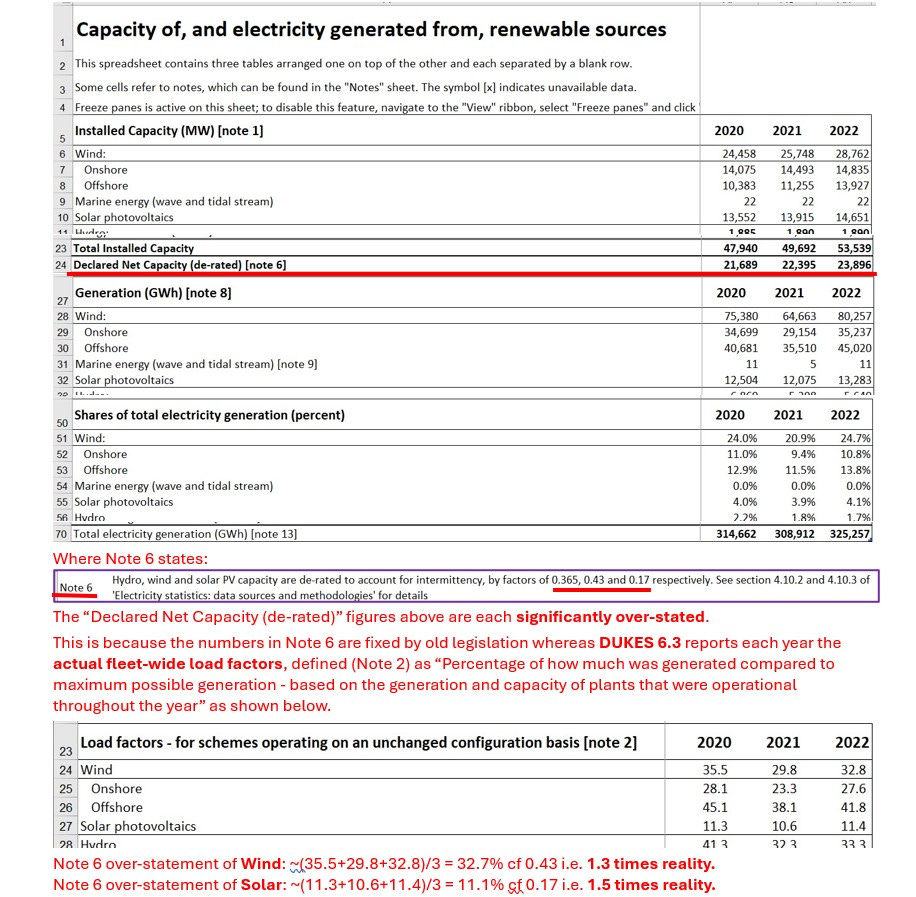
I summarise the main parameters from DUKES for the most-recent years in Figure 0.
Figure 0: Summary of Actual Recent GB ‘Renewables’ per DUKES
Globally in energy we benefit from another two years of experience seeing where ever-higher proportions of ‘renewable’ generation *capacity* is leading. For example, in May 2023 the United States Department of Energy (DOE) published the results of their “lift-off” study on long-duration energy storage (LDES). They state:
“The U.S. grid may need 225-460 GW of LDES capacity for a net-zero economy by 2050, representing $330B in cumulative capital requirements.”
They don’t state what number of GWh of stored energy that corresponds to, because that’s to be determined. But the DOE’s analysis suggests that large savings can be made by providing for immense stored energy versus building ever more gas generation capacity. The DOE implicitly accepts it must keep US lights on by providing reliable dispatchable energy, either from storage or by burning gas, when the sun isn’t shining and when the wind isn’t blowing, and for substantial lengths of time. Some of the energy will be stored as heat, to offload heating applications; some as coolth to offload cooling applications; and some as electricity itself. All to be determined as technologies and funding mechanisms, etc. develop.
In the 16-slide presentation pack the DOE defined what they consider to be LDES, and outline the time-scales of energy storage, potential technologies and applications. The presentation focuses on the “inter-day LDES” (10-36 hours) and the “multi-day LDES” (36-160+ hours), their potential technologies and their pros and cons.
To emphasise: these technologies do not currently exist except in infant states and/or are currently too expensive for widespread adoption at sufficient magnitude. Hence the need for lots of “lift-off” funding, ahem, “market interventions”.
Key messages I take away from the presentation are captured in Figures A, B, C and D.
Figure A: DOE “Lift-Off” Summary
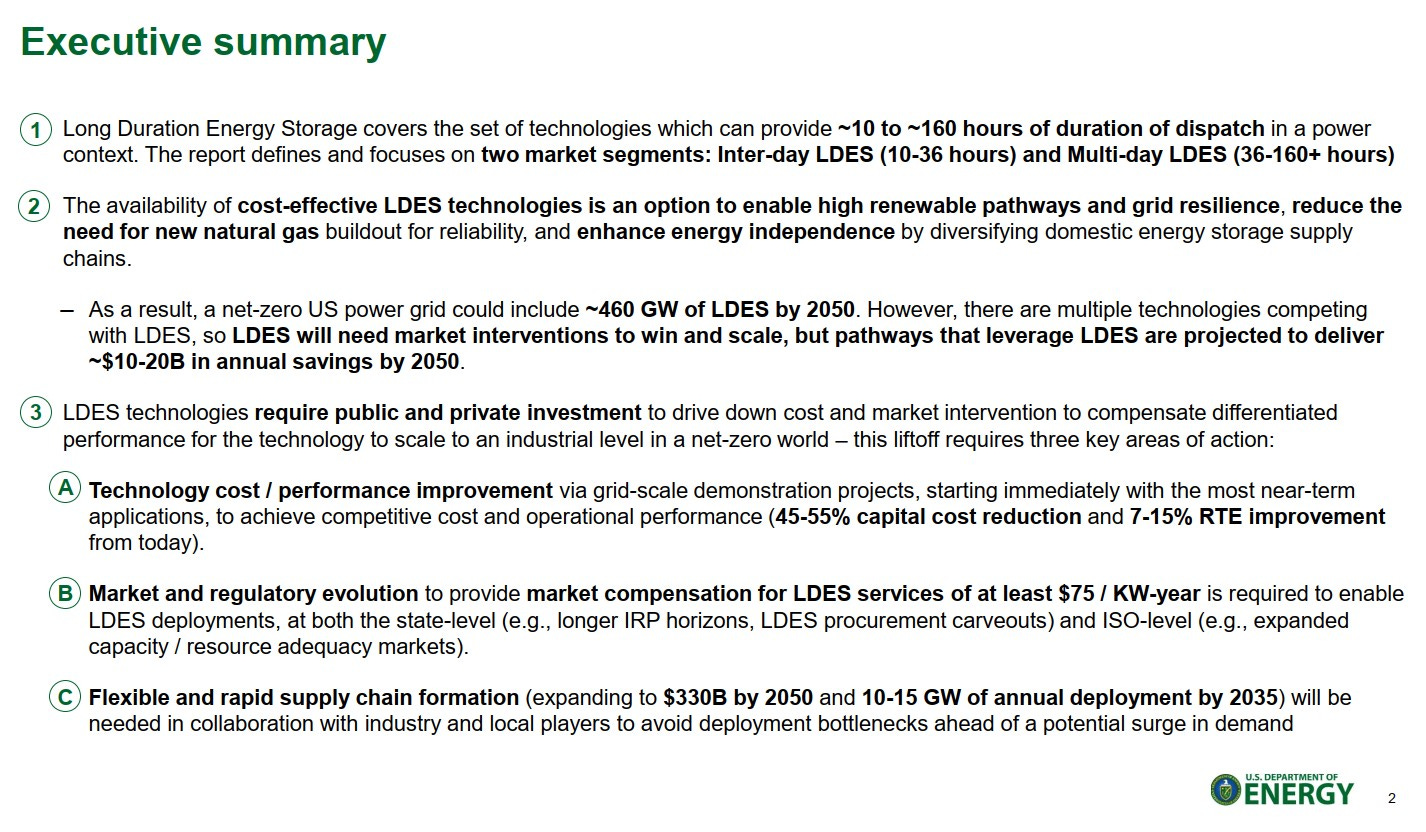
Figure B: DOE “Lift-Off” Focus: Inter-Day and Multi-Day LDES
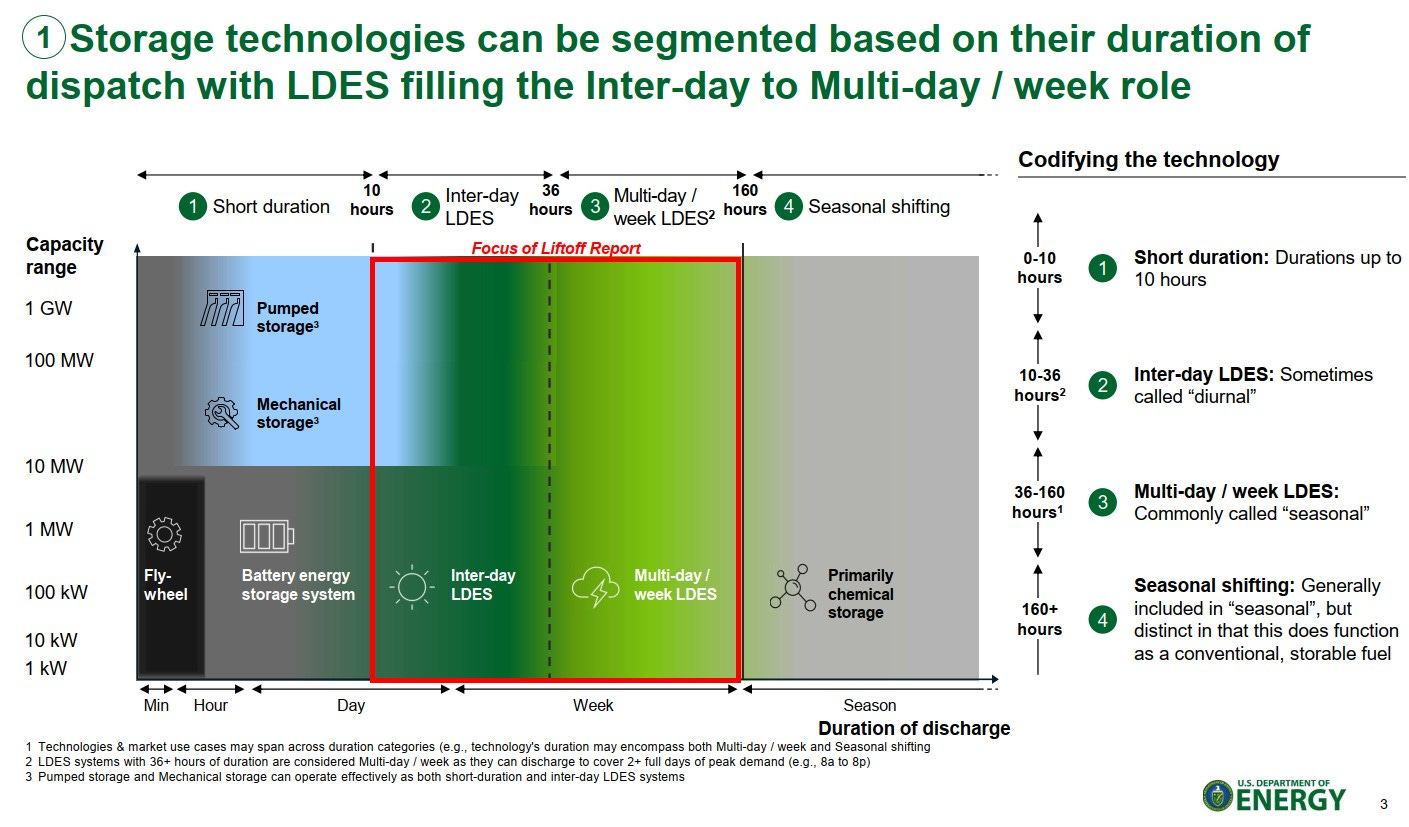
Figure C: DOE “Lift-Off” - LDES Displaces Gas
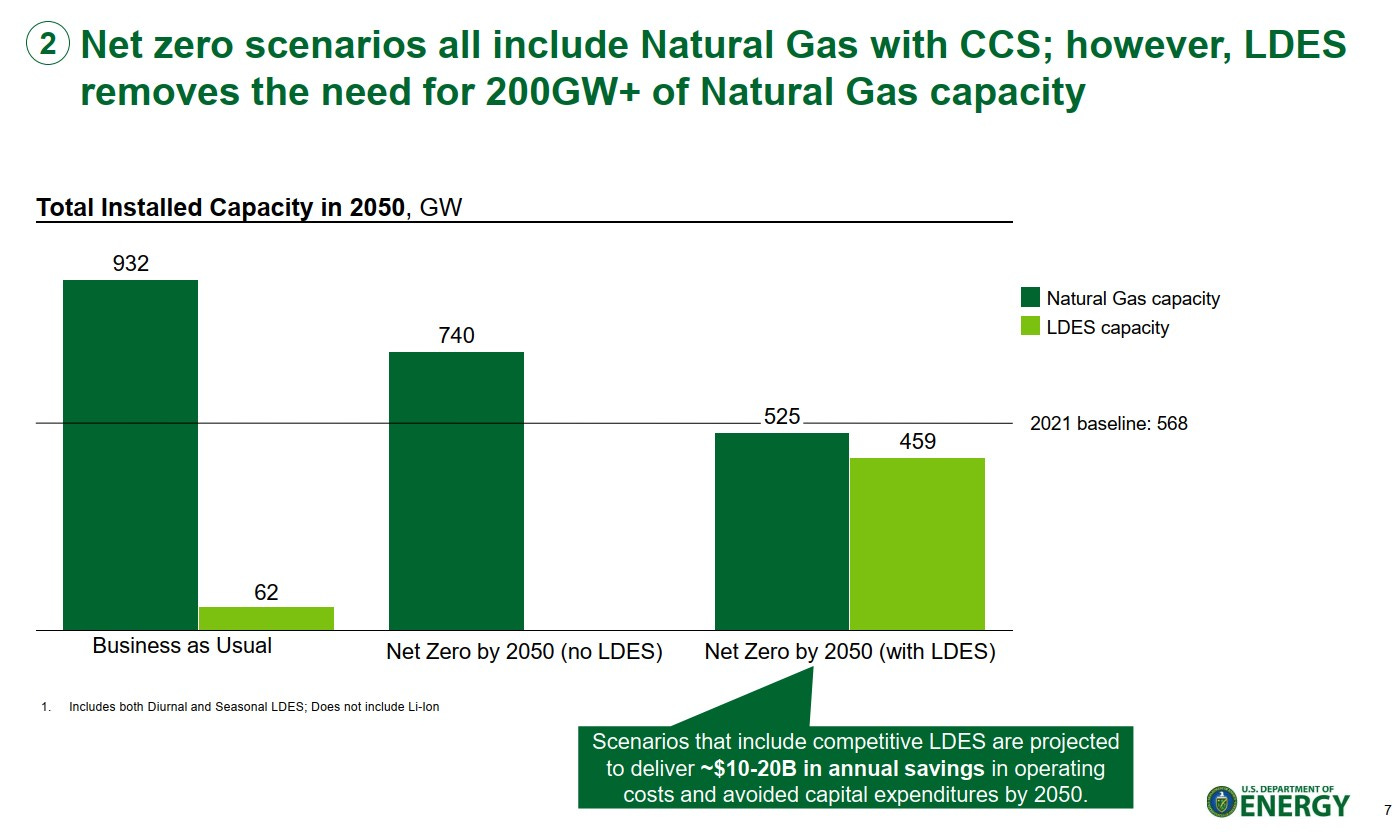
Figure D: DOE “Lift-Off” - KPIs to 2030
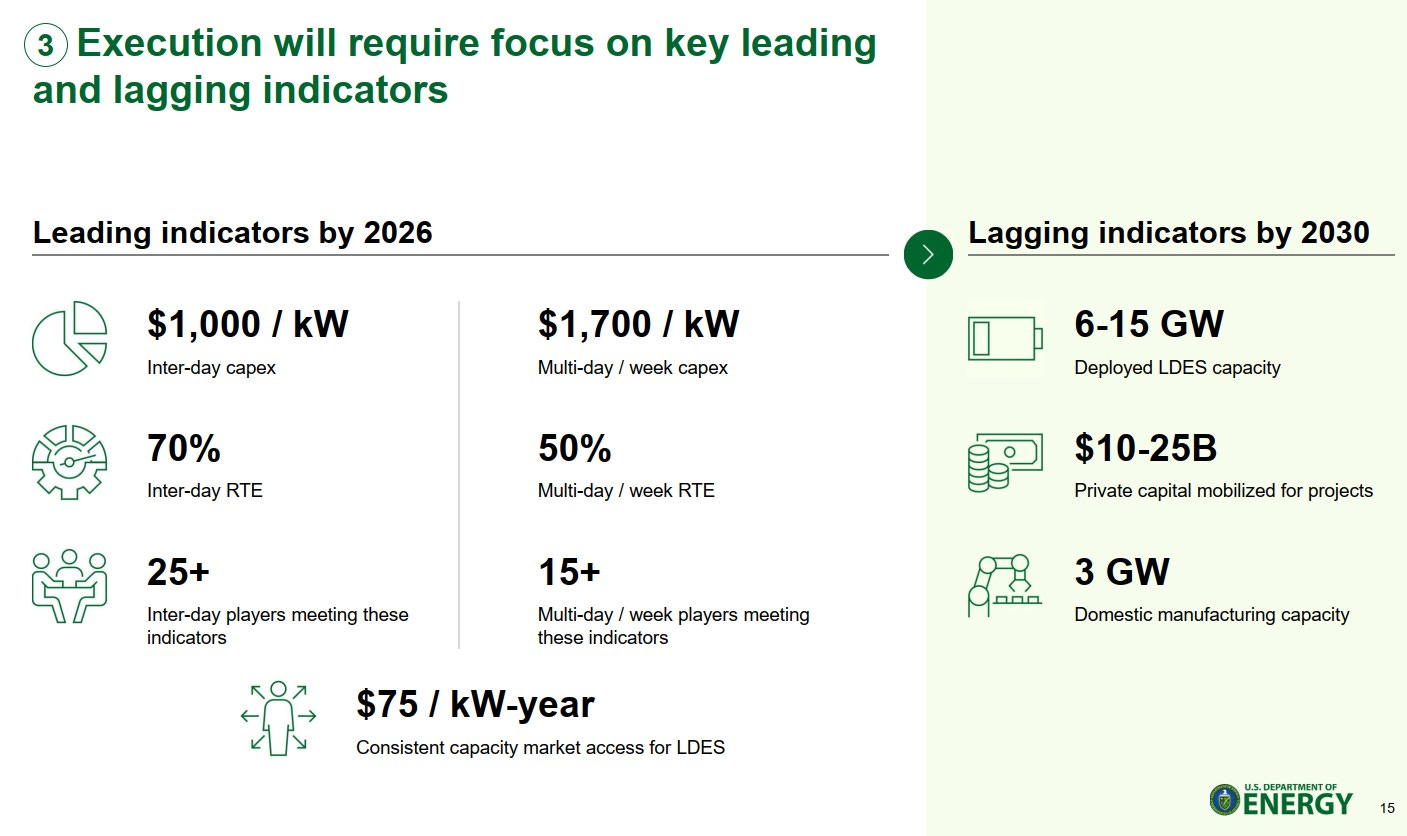
I’ve previously suggested that the huge inevitable daily variation of Solar PV power should be smoothed by installing electrical energy storage to avoid ‘duck curves’ and ever-increasing costs of constraint / curtailment. Inter-day LDES could fulfil that role. Multi-day LDES, meanwhile, could mitigate the common issue of long-lasting wind lulls (don’t call them ‘dunkelflaute’, please). But neither will happen unless and until those technologies exist at sufficient scale and are sufficiently cheap. Is $1,000 - $1,700 / kW sufficiently cheap? I’ll leave any financial modelling to others.
For me, the most useful information from Figure D is the likely range of round-trip efficiency (RTE) of LDES: 70% for inter-day and 50% for multi-day. For simplicity - and because I can’t predict the future mix of the two categories of LDES that might be used - I’m going to assume the LDES we might install in the UK will have a RTE of 60%. That is, for each 10 MWh of ‘renewable’ electricity sent to future UK LDES, we could get back 6 MWh. *If* all other physical constraints e.g. grid capacity could be satisfied.
Data
I continue to use GridWatch as my source of data for actual GB power flows. For this post I’m looking at future scenarios based on extrapolation of 2020-2023 real years’ power data from across the GB fleet (i.e. over 96% of UK electricity).
Adjustment Factors for Wind and Solar PV
GridWatch states there is unmetered Wind power, which I assume the Digest of UK Energy Statistics (DUKES) accounts for in its annual records. Similarly, there is unmetered Solar power not accounted for by GridWatch data. Both are reported in DUKES 6.2 and updated each July. Therefore I apply adjustment factors. For example, for the most-recent complete (DUKES) year, 2022, these are:
Wind: DUKES 6.2: total 80,257 GWh, i.e. 80,257,260 MWh
Integrating Gridwatch data: 63,309,864 MWh = 78.884% of the official number
Hence adjust Gridwatch 2022 wind by 100% / 78.884% = 1.2677
Solar PV: DUKES recorded 13,283 GWh, i.e. 13,282,910 MWh
Integrating Gridwatch data: 11,403,288 MWh = 85.849 % of the official number
Hence adjust Gridwatch 2022 solar PV by 100% / 85.849 % = 1.1648
Similarly the adjustment factors for 2020 and 2021 can be derived.
Until DUKES 6.2 is updated in ~July 2024 I am using the 2022 adjustment factors for 2023. In case you notice, the 2022 Wind and Solar PV adjustment factors published here are marginally different from the values I used previously - simply because I found minor errors.
I again use my estimation of the effective increases in Wind and Solar *capacity* based on Labour’s ‘Mission’ for ‘renewable’ energy. Table 1 summarises the adjustment and multiplication factors for each year’s actual Demand, Wind and Solar PV to extrapolate to the end of 2030 = “Future GB”.
Table 1: Future GB Adjustment and Multiplication Factors

Would the ‘Mission’ be achievable by December 2030? I have serious doubts looking at the trend to date versus what would be required. But for the sake of this analysis I will put my doubts aside.
Methodology
For GridWatch data from each of those years I extrapolate to end-2030 by:
- Adjusting recorded Wind power flows by the Wind adjustment factor, then
multiplying the adjusted Wind by the Wind multiplier to get [future Wind];
- Adjusting recorded Solar PV power flows by the Solar adjustment factor, then
multiplying the adjusted Solar by the Solar multiplier to get [future Solar];
- Increasing the recorded Demand by the Demand factor to get [future Demand];
- Calculating [future Wind + future Solar] - [future Demand]
Simplistically, if [future Wind + future Solar] - [future Demand] is greater than zero, the future UK is more or less energy-independent and the UK’s lights will stay on.
However, if [future Wind + future Solar] - [future Demand] is less than zero, the future UK is NOT energy-independent. Depending on what third parties decide to do, the UK’s lights may or may not stay on.
In my previous analysis I only considered energy storage via hydrogen production, because that technology actually exists. That effectively assumed there would be a limited number of hydrogen production facilities clustered around salt cavern geology locations to provide the immense hydrogen storage capacities required. Hence in my prior analysis their combined localised power rating would constrain the quantity of power possible to save via electrolysis and hydrogen storage.
Having read the DOE summary, for this post I am widening the scope of my analysis to include hundreds or possibly thousands of distributed LDES facilities each of limited power & capacity but cumulatively summing to ‘enough’. I suspect these future LDES facilities would mostly be co-located with the generating assets so there would be less need to reinforce the grid over long distances; and if generation is offshore its connection to shore-based LDES would be sized to suit maximum load.1 All of which is to say that total MW power capacity would not be a limit for distributed LDES.
However, future LDES would have to operate within other constraints:
Table 2: The Logic Tree for Future LDES:
1 IF there is surplus [future Wind + future Solar]
2 AND there is unused energy storage capacity in future LDES
3 THEN that future LDES can receive and store ‘green’ energy (thereby reducing the
amount of energy that has to be constrained / curtailed)
4 UNTIL (at maximum) the future LDES becomes ‘full’
SO
4 WHEN there is a shortfall of [future Wind + future Solar]
5 AND there is ‘charged-up’ future LDES
6 THEN we could get back up to 60% [1] of the energy stored in the LDES (thereby
reducing the shortfall of energy)
7 UNTIL (at minimum) the LDES becomes ‘empty’ [2]
[1] based on average round-trip efficiency per DOE
[2] The operating range of LDES needs to remain within constraints on e.g. depth of discharge (DOD) which will probably depend on its technology. I’ll work with net storage capacity and assume we remain within such constraints, whatever the technology mix.
I assume no limits on charge / discharge cycles or other aspects of LDES operation: if there is capacity to be charged, or stored energy to be discharged, then my analysis uses it.
The net effect of LDES after applying Table 2 logic would be to reduce the size of the energy shortfalls in the future GB, and reduce constrained / curtailed quantities and hence costs. I’m making the gross simplification that all energy stored in the LDES system is equivalent to electrical power, on the basis that stored heat and coolth would unload the power system by those amounts. I understand this simplification is thermodynamically incorrect: don’t ‘@’ me.
Also, reminder: if you view this post in Substack and want to see the detail in any of the following (complex) charts simply click on the small image to open a zoomed view.
Real GB Weather-Dependent Power Generation
Figure 1A: Future 2030 GB Generation Based on 2020 Actual Weather
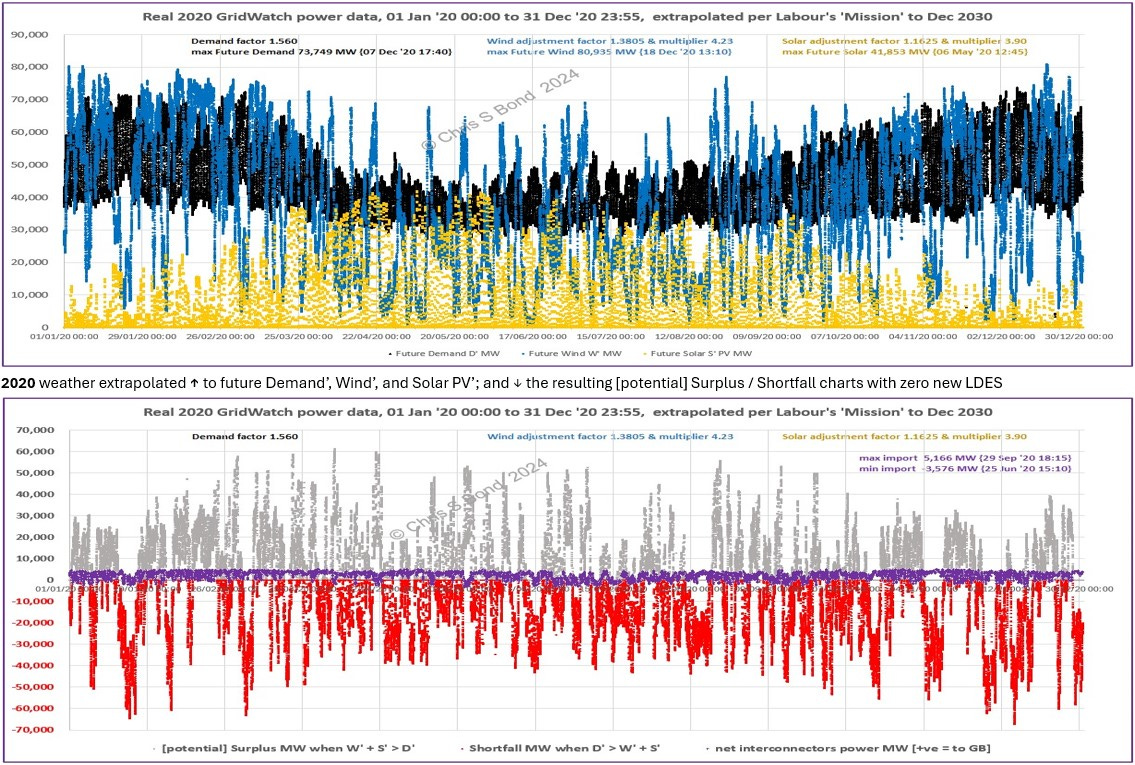
Figure 1B: Future 2030 GB Generation Based on 2021 Actual Weather
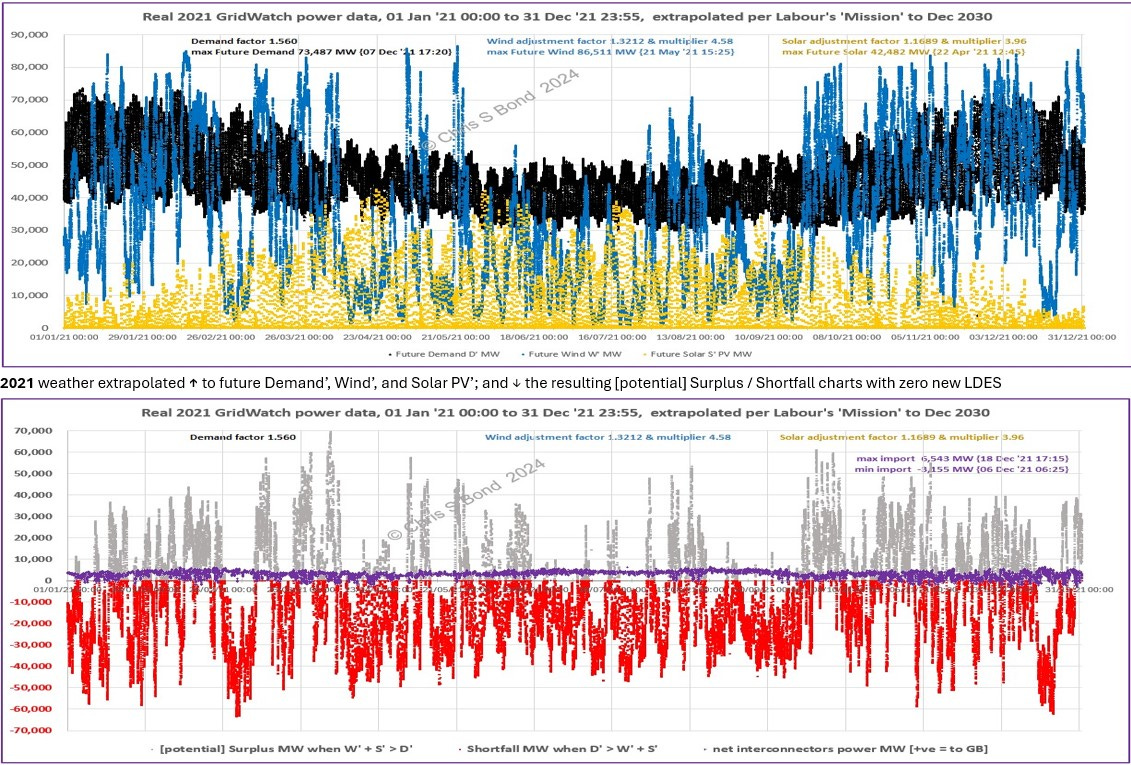
Figure 1C: Future 2030 GB Generation Based on 2022 Actual Weather
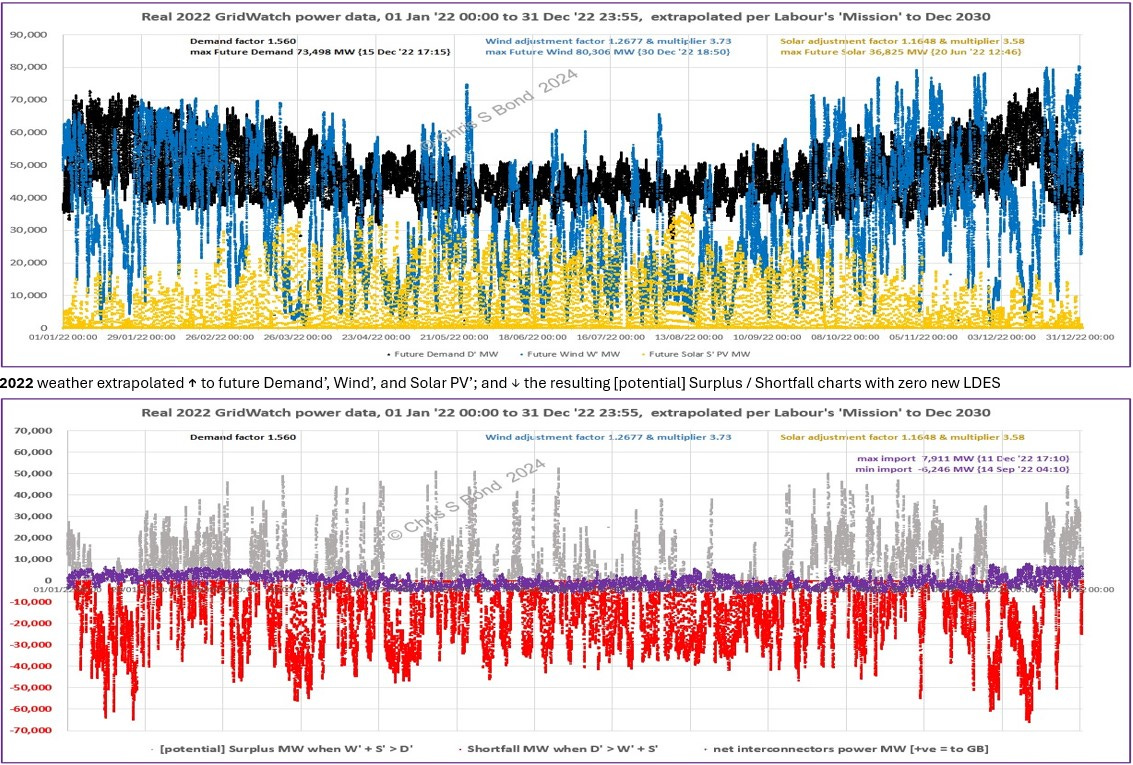
Figure 1D: Future 2030 GB Generation Based on 2023 Actual Weather
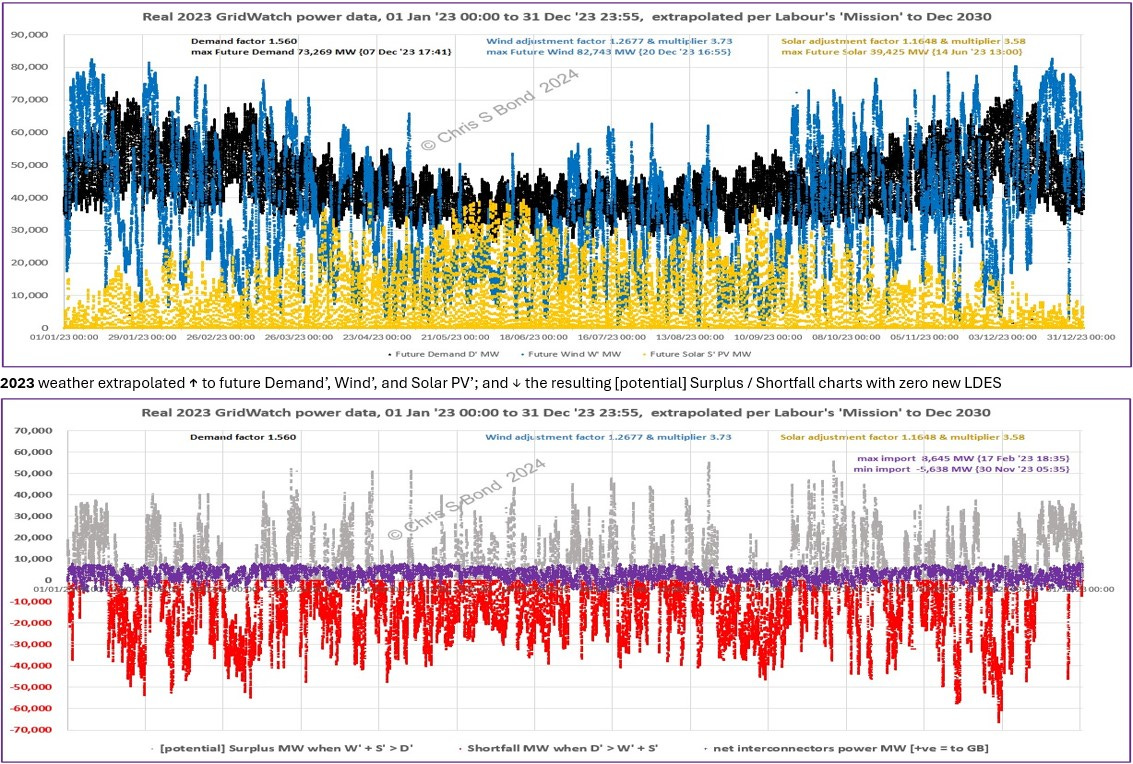
Figures 1A-1D show my estimates of future GB power flows IF we were to achieve installation of the colossal increases in Wind and Solar *capacity* called for in Labour’s ‘Mission’, and we had a repeat of all 1,461 days’ of 2020-2023 weather as recorded by GridWatch. Each upper chart shows how ‘spiky’ the Wind and Solar generation profiles are, and the shear magnitude of future power flows. Each lower chart indicates there would still be lots of shortfalls [red] in ‘renewable’ power generated despite all the extra *capacity*.
General trends over this 4 years: shortfalls are slightly more prevalent in the cold parts of each year; and the difference in magnitude between the imports [purple] and the shortfalls is stark. The latter is largely why I don’t see interconnectors riding to GB’s rescue any time soon, certainly not by December 2030.
The plots of [potential] surplus represent the energy we want to capture using the additional flexible reliable Demand provided by [future] LDES instead of constraining / curtailing it. But how much benefit would it provide? I applied the logic tree approach to evaluate the cumulative effects. Once again I was surprised where the data took me.
Figure 2A: 2030 GB, 2020 & 2021 Actual Weather, 100,000 MWh LDES
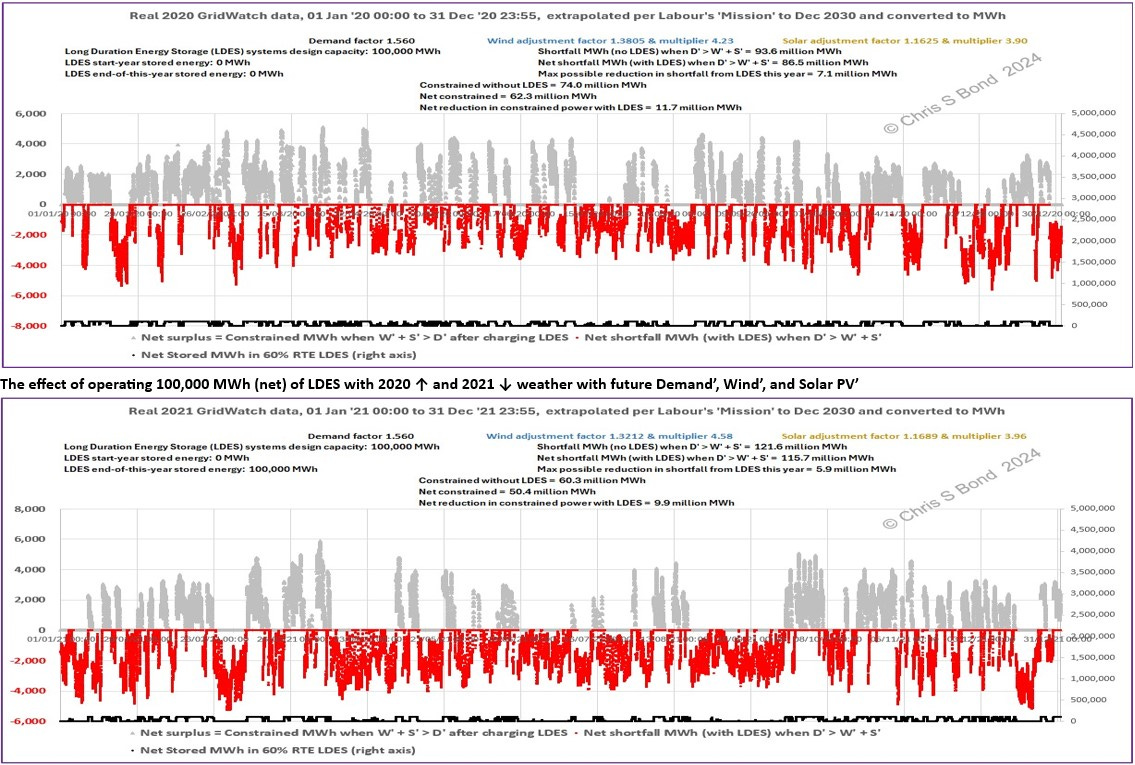
Figure 2B: 2030 GB, 2022 & 2023 Actual Weather, 100,000 MWh LDES
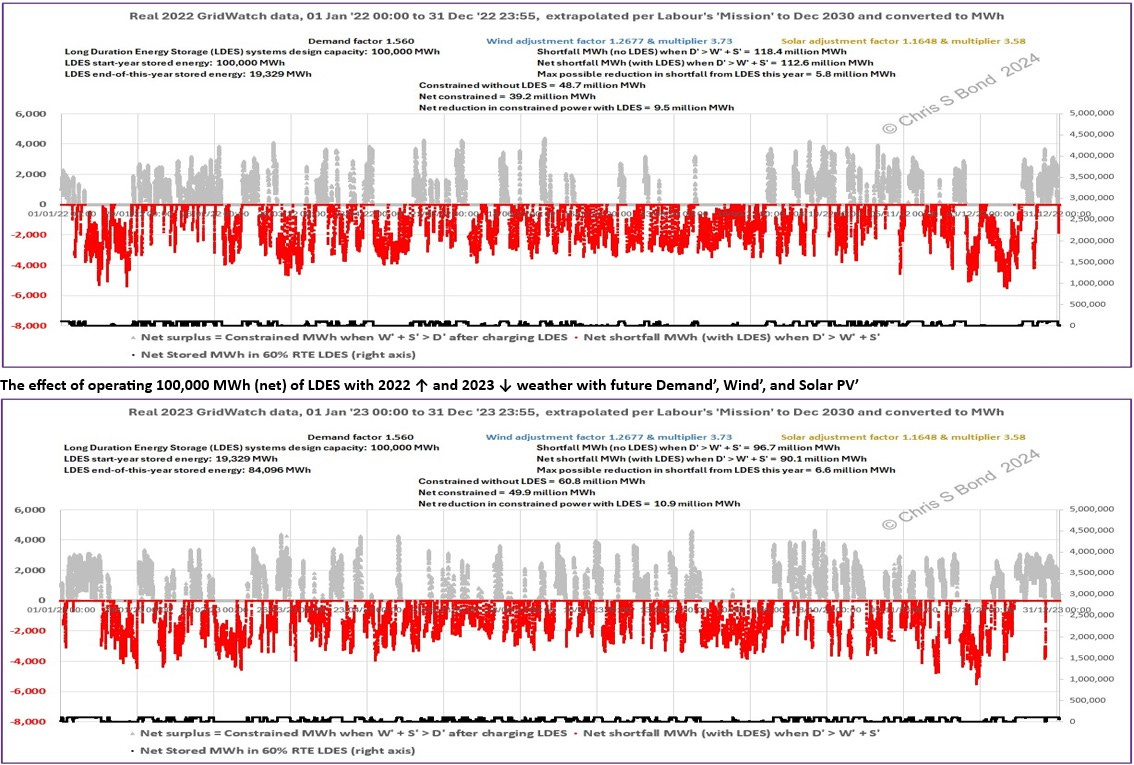
Figures 2A and 2B show that for recent real years’ weather and for a ‘modest’ total LDES storage capacity, there are multiple times each year when the LDES combined ‘battery’ goes completely flat. Table 3A and the text following indicate why I characterise the capacity of LDES as ‘modest’.
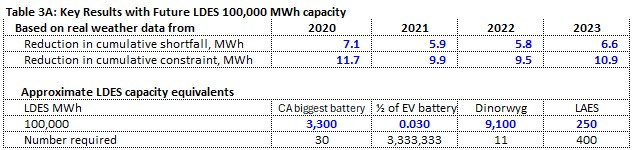
30 times California’s biggest lithium-ion battery to date; or
3.33 million 60 kWh electric vehicles constantly connected to the grid with vehicle-to-grid technology and with half their usable capacity donated to ‘the greater good’; or
11 times Dinorwyg Pumped Hydro Storage scheme, although this is not distributed and so would require far greater grid reinforcement to and from the part of the country with appropriate geography; or
400 times the size of a proposed liquid air energy storage (LAES) demonstration project... IF they can get funding. As the licensor correctly states, LAES technology has the major advantage that it can be located almost anywhere, and the energy can be stored as liquid air for extended periods.2
Figure 2C: 2030 GB, 2020 & 2021 Actual Weather, 500,000 MWh LDES
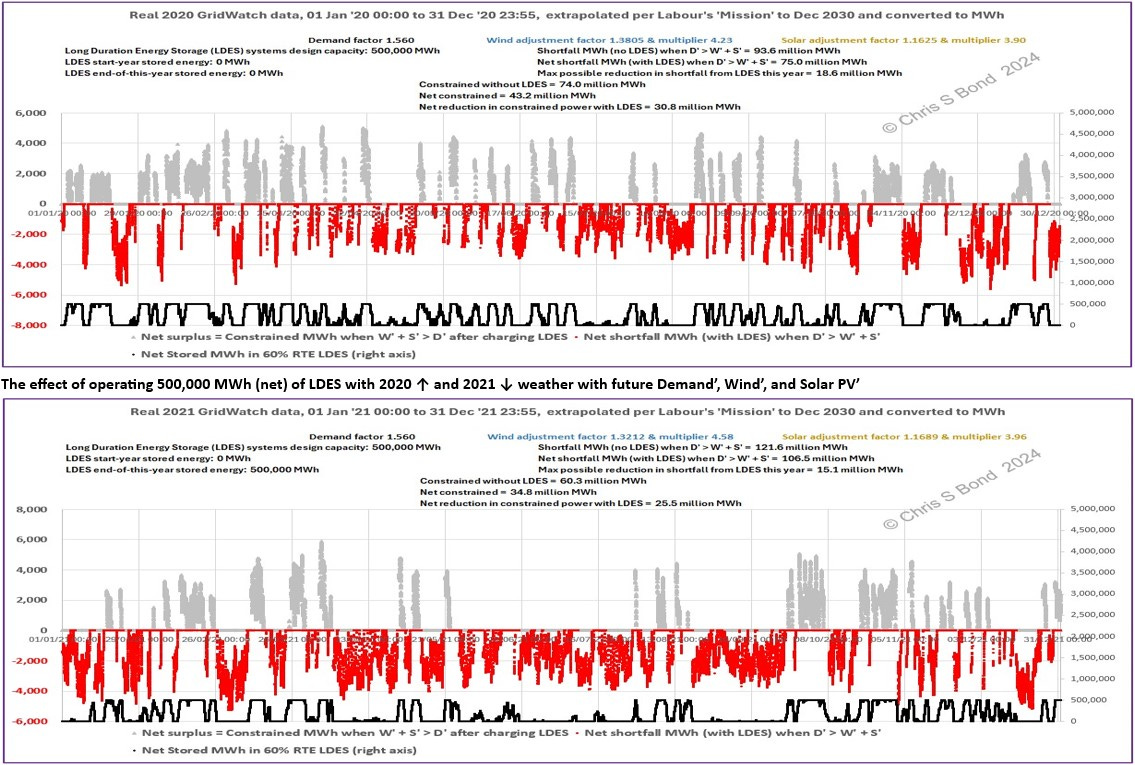
Figure 2D: 2030 GB, 2022 & 2023 Actual Weather, 500,000 MWh LDES
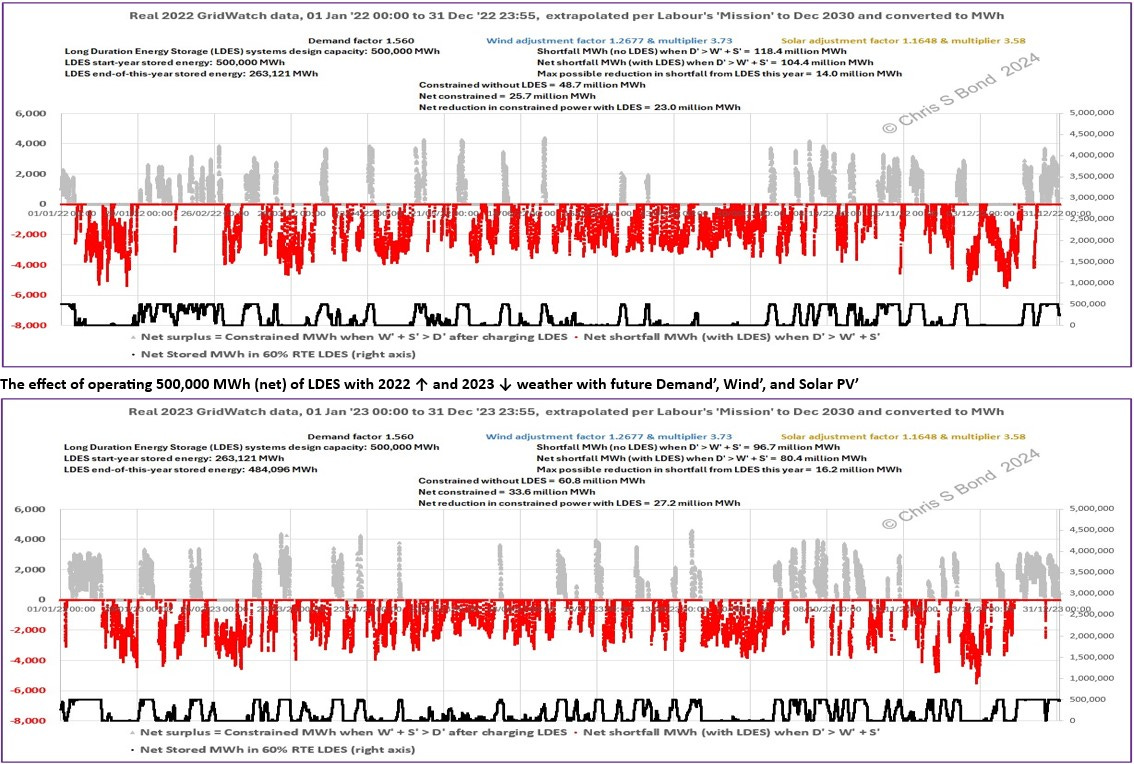
Figures 2CA and 2D show even more clearly that there are many times each year when the LDES combined ‘battery’ goes completely flat. Table 3B summarises the potential benefits and at what ‘cost’.
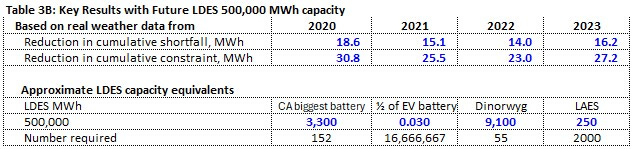
~150 times California’s biggest lithium-ion battery; or
16.7 million 60 kWh electric vehicles constantly connected to the grid etc.; or
55 times Dinorwyg Pumped Hydro Storage scheme etc.; or
2000 times the size of a proposed liquid air energy storage (LAES) demonstration project... etc.
Figure 2E: 2030 GB, 2022 & 2023 Actual Weather, 1,000,000 MWh LDES
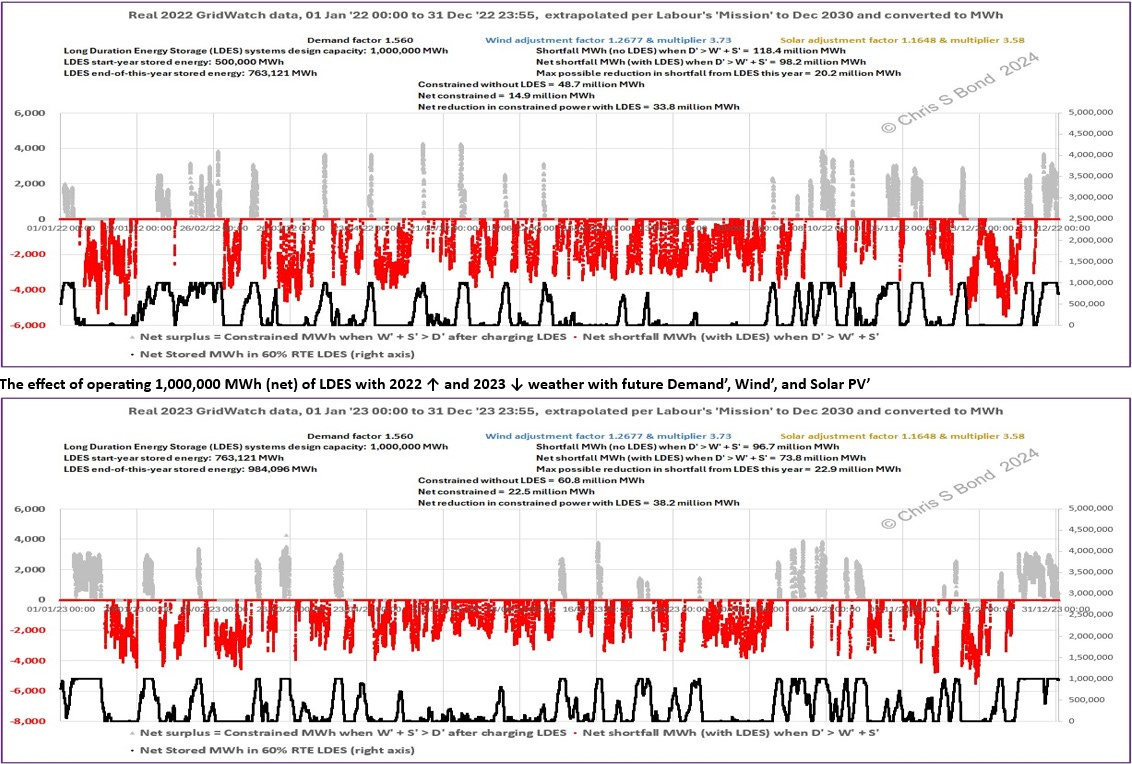
Figure 2E shows the same patterns / trends with a total net capacity of the LDES system of 1,000,000 MWh. Neither shortfalls nor curtailments are even close to being eliminated. The LDES goes completely ‘flat’ multiple times through the years, so there is also zero seasonal shifting of energy.
Table 4: Diminishing Returns
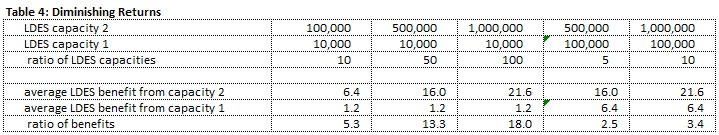
The trend is again very clear: less benefit (in terms of improvements in energy shortfall) is obtained for increments in LDES capacity, and the more LDES capacity is installed the worse it gets. For example:
go from 10,000 MWh to 100,000 MWh of LDES (10 times) you get 5.3 times the benefit in terms of the reduction in shortfall over the four years; whereas
go from 100,000 MWh to 1,000,000 MWh of LDES (also 10 times) you get 3.4 times the benefit in terms of the reduction in shortfall over the four years.
How much LDES would we need to completely stop curtailment of ‘renewable’ energy? For illustration, just looking at 2023 as that had a total shortfall (without LDES) of ‘just’ 96.7 million MWh, i.e. it was a ‘good’ year in Wind + Solar PV terms:
Figure 3: 2030 GB, 2023 Actual Weather, 7,300,000 MWh LDES
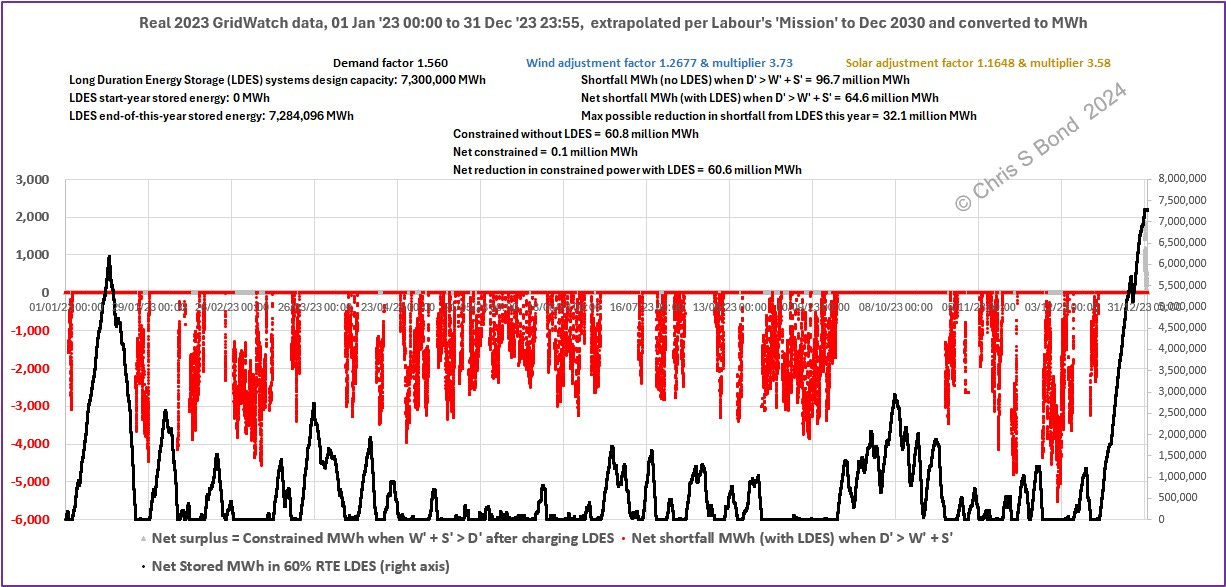
Figure 4: Key Numbers - 7,300,000 MWh LDES

~2,200 times California’s biggest lithium-ion battery; or
~240 million 60 kWh electric vehicles constantly connected to the grid etc.; or
~800 times Dinorwyg Pumped Hydro Storage scheme etc.; or
Nearly 30,000 times the size of a proposed liquid air energy storage (LAES) demonstration project... etc.
Cumulative shortfall over the year is still nearly 65 million MWh - requiring an awful lot of [fossil-fuelled] reliable dispatchable power generation capacity to be held on standby for those frequent intervals when the Wind doesn’t blow especially every night.
Would we ever go that far? Getting ever lower benefits for each increment of LDES capacity? I sincerely hope there would be transparent and honest cost-benefit analysis presented to the population by whichever politicians are then in power. But that may well be a forlorn hope, too much in this field is driven by ideology not data.
What do you think?
Do my charts ‘speak to you’ like they do me - every picture is worth a thousand words - or do they just confuse you?
Copyright © 2024 Chris S Bond
Disclaimer: Opinions expressed are solely my own.
This material is not peer-reviewed.
I am against #GroupThink.
Your feedback via polite factual comments / reasoned arguments welcome.
I trust that people will abandon the idea of offshore electrolysis with hydrogen piped to shore. The far higher costs of doing anything off-shore should rapidly kill such proposals, but alas I fear not before millions in ‘green’ subsidies are sunk.
A downside of cryogenic processes is that they have to be kept intensely cold, so it will be interesting to see as experience is developed revealing the overall efficiency and economics of LAES facilities.
Great analysis. Just a couple of comments:
Using data from later years, poses a problem in that it includes a substantial amount of curtailment. When modelling their grid, I default to earlier years to get a more accurate picture.
You may be interested in https://wrjohn1.substack.com/p/grid-based-energy-storage-explained where I talk about "How Much Storage Capacity is Needed". I discuss the trade-off between Capex and FCOE.
You mention "Diminishing Returns" for energy storage. But, it also has a major effect on actual generation. I talk about it in: https://wrjohn1.substack.com/p/wind-solar-and-the-effect-of-diminishing
Chris I understand you are making a point on LDES.
It would be interesting to increase the mix with RNG to help run the balance of NG dispatchers and adding Nuclear? The RNG CCS fuels aviation etc. and reduces organics which would decompose anyway.
Given this reality if the population would also adjust their habits to help reduce the demand response what could that look like?
Cryogenic plants have been around for 100+ years. Today a large Cryo separation plant runs at +98% capacity year-round. No issues with Liquid Air storage IMO other than economics. It requires serious level of industrialization to be reshored. There is also CO2 cryo storage being demoed.